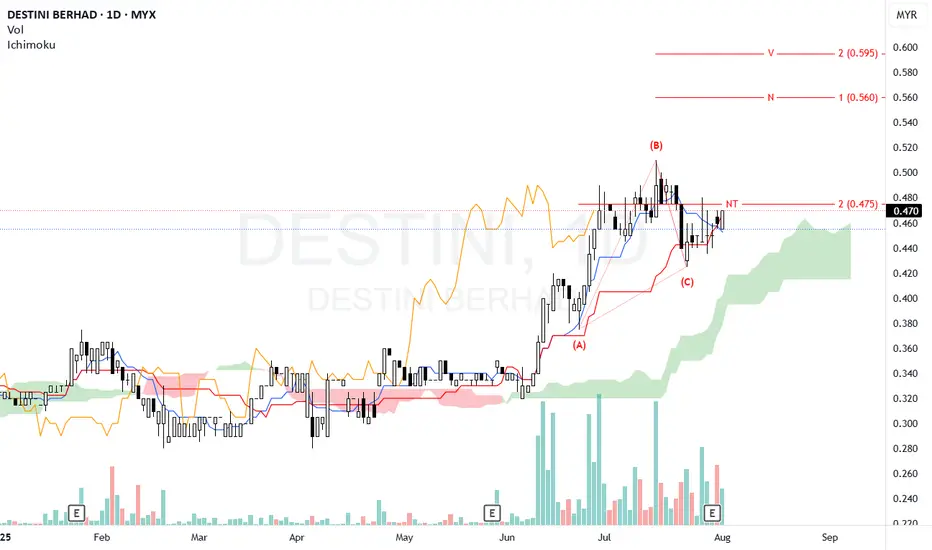
N wave with V, N & NT projection.
The chart shows a bullish correction starting after a prior downtrend, with the current price around 0.470.
Price is trading above the Kumo, suggesting a bullish bias is developing. The Kumo shows support below the current price, with potential for upward momentum.
Currently testing the NT level at 0.475, which acts as immediate resistance. If Price break and stay above this level convincingly, it might aim for higher targets (N and V).
Volume has been variable, but a volume increase on breakout would strengthen the move.
Entry: Consider going long if the price clearly breaks above the 0.475 level with volume confirmation.
Stop Loss: Place SL slightly below recent lows, around 0.440, to manage downside risk.
Confirm breakout with volume and price action. If price fails to break 0.475 and falls below 0.445, it may enter a sideways/consolidation phase or pull back to test the top of the cloud near 0.430.
Note:
1. Analysis for education purpose only.
2. Trade at your own risk.
Haftungsausschluss
Die Informationen und Veröffentlichungen sind nicht als Finanz-, Anlage-, Handels- oder andere Arten von Ratschlägen oder Empfehlungen gedacht, die von TradingView bereitgestellt oder gebilligt werden, und stellen diese nicht dar. Lesen Sie mehr in den Nutzungsbedingungen.
Haftungsausschluss
Die Informationen und Veröffentlichungen sind nicht als Finanz-, Anlage-, Handels- oder andere Arten von Ratschlägen oder Empfehlungen gedacht, die von TradingView bereitgestellt oder gebilligt werden, und stellen diese nicht dar. Lesen Sie mehr in den Nutzungsbedingungen.