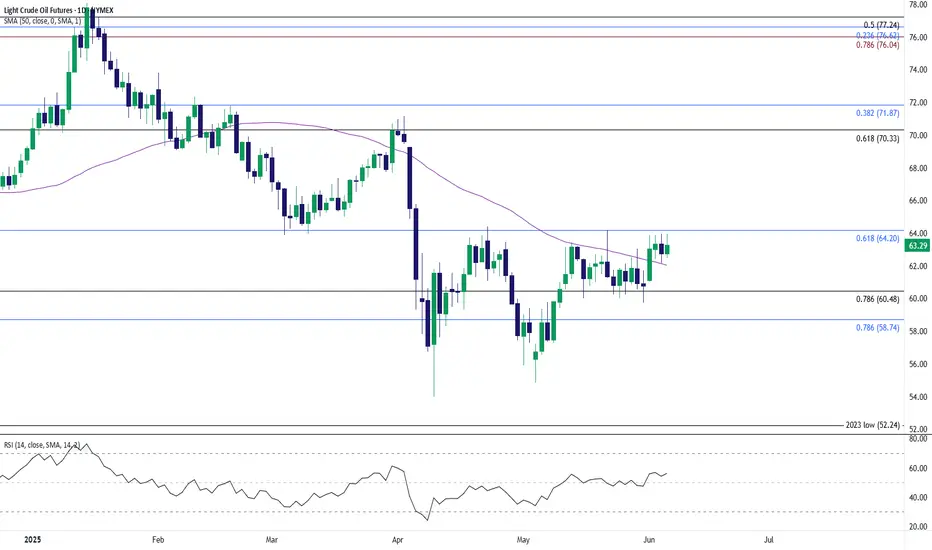
The price of oil is on the cusp of testing the May high ($64.19) after closing above the 50-Day SMA ($62.04) for the first time since April, with a break/close above $64.20 (61.8% Fibonacci retracement) bringing the April high ($71.16) on the radar.
Need a move/close above the $70.30 (61.8% Fibonacci retracement) to $71.90 (38.2% Fibonacci retracement) zone to open up the February high ($73.84), but lack of momentum to push/close above $64.20 (61.8% Fibonacci retracement) may keep the price of oil within the April range.
Failure to defend the advance from the weekly low ($61.06) may push crude back toward the $58.70 (78.6% Fibonacci extension) to $60.50 (78.6% Fibonacci retracement) region, with the next area of interest coming in around the May low ($54.84).
--- Written by David Song, Senior Strategist at FOREX.com
Haftungsausschluss
Die Informationen und Veröffentlichungen sind nicht als Finanz-, Anlage-, Handels- oder andere Arten von Ratschlägen oder Empfehlungen gedacht, die von TradingView bereitgestellt oder gebilligt werden, und stellen diese nicht dar. Lesen Sie mehr in den Nutzungsbedingungen.
Haftungsausschluss
Die Informationen und Veröffentlichungen sind nicht als Finanz-, Anlage-, Handels- oder andere Arten von Ratschlägen oder Empfehlungen gedacht, die von TradingView bereitgestellt oder gebilligt werden, und stellen diese nicht dar. Lesen Sie mehr in den Nutzungsbedingungen.