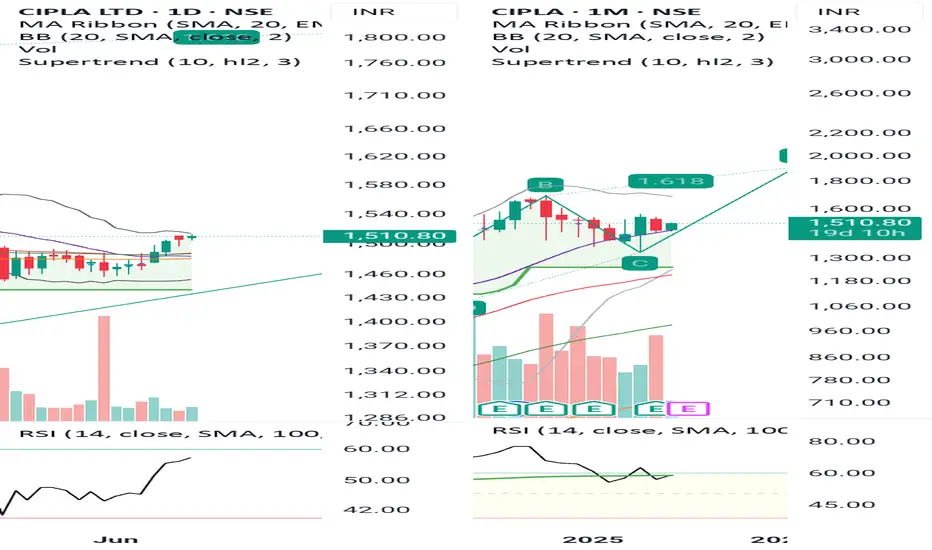
Cipla Ltd. is an interesting consolidation to keep on radar
Technicals
1. RSI on all time frames above 50
2. Major daily moving averages are clustered in range of 1478-1482 be it 20 sma, 50 ema, 200 ema, 100 ema
3. Major weekly moving averages i.e. 50 EMA and 20 SMA at 1474 and 1476 respectively
4. Narrowing Bollinger band on weekly charts
5. Price taking support at 20 month sma and recovered
Fundamentals
Q4 FY25 Results: Net profit rose ~30% year-over-year to ₹1,222 cr, while revenue increased ~8.5%, beating expectations .
Quarterly (Q3): Earlier Q3 profit jumped ~49%, supported by strong domestic demand even as U.S. sales remained subdued .
Financial health: Near zero debt (D/E ~0.01), steady ROE (₹65/year), with trailing P/E around 23, well below the sector average (~39) .
U.S. drug launch potential: FDA approval secured for generic Abraxane — a big oncology drug — slated for launch in H1 FY26 .
Pipeline expansion: Launch of respiratory drug Advair and oncology Abraxane expected to contribute significantly .
Key risks: Potential U.S. tariffs on generics and supply issues (e.g., Lanreotide) can temporarily pressure revenues .
Lets see how it evolves.
Disclaimer: NOT A BUY / SELL RECOMMENDATION I am not an expert I just share interesting charts here for educational purpose and not to be taken as buy/sell recommendation. Please seek expert opinion before investing and trading as trading/ investing in market is subject to market risks. I do hold small position in the stock as on date and I may look to take some position further with my own Risk Reward matrix.
Haftungsausschluss
Die Informationen und Veröffentlichungen sind nicht als Finanz-, Anlage-, Handels- oder andere Arten von Ratschlägen oder Empfehlungen gedacht, die von TradingView bereitgestellt oder gebilligt werden, und stellen diese nicht dar. Lesen Sie mehr in den Nutzungsbedingungen.
Haftungsausschluss
Die Informationen und Veröffentlichungen sind nicht als Finanz-, Anlage-, Handels- oder andere Arten von Ratschlägen oder Empfehlungen gedacht, die von TradingView bereitgestellt oder gebilligt werden, und stellen diese nicht dar. Lesen Sie mehr in den Nutzungsbedingungen.