Celer Network (CELR) is currently standing at a critical juncture that could define its next major move.
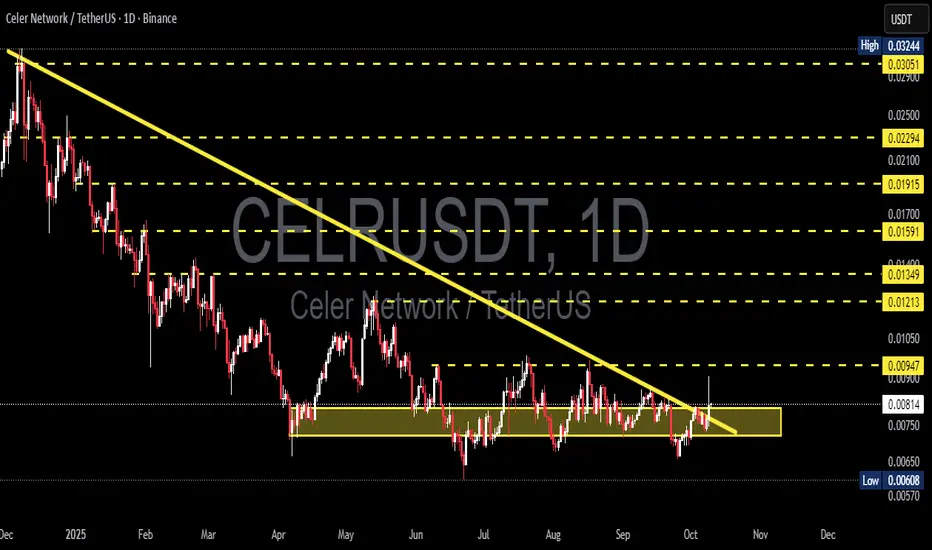
After months trapped below a long-term descending trendline, price is once again testing a crucial area — the accumulation zone between 0.008 and 0.0072.
This yellow zone has consistently acted as a strong demand area, showing that buyers have been quietly absorbing sell pressure.
At the same time, the long-term downtrend line remains a heavy ceiling that has capped every rally attempt so far.
Now, both forces are converging — making this a true decision point for CELR.
---
Pattern Description
The chart displays a descending triangle pattern characterized by:
A sequence of lower highs (declining selling pressure).
A horizontal support base around 0.008–0.0072 (firm buying interest).
This structure typically signals a compression phase — the market builds energy for its next big move.
A breakout could mark the beginning of a major trend reversal, while a breakdown could trigger a continuation of the broader downtrend.
---
Bullish Scenario — The Start of a Reversal?
If CELR manages to break and close above the descending trendline, especially with a daily close above 0.0094–0.0095, it would signal the first technical shift in momentum after months of decline.
A breakout accompanied by rising volume would confirm that buyers are taking control.
📈 Upside targets:
Target 1: 0.0095 – initial breakout retest zone.
Target 2: 0.0121 – first horizontal resistance.
Target 3: 0.0135 – a psychological level often triggering follow-up buying.
Extended targets: 0.0159 – 0.019 – medium-term expansion zone if bullish momentum sustains.
If CELR can hold above the breakout level on a successful retest, it may mark the beginning of a significant trend reversal phase driven by renewed demand.
---
Bearish Scenario — Continuation Risk
If CELR fails to break above the trendline and gets rejected around 0.0085–0.0090, selling pressure could return.
A daily close below 0.0072 would confirm a bearish breakdown and could lead price toward:
0.0068 – 0.0065 → the previous local low zone.
0.00608 → the next key support if selling continues.
This scenario would indicate that buyers are still weak and the long-term downtrend remains dominant.
---
Technical Context
The long-term descending trendline remains a major resistance area monitored by technical traders.
The yellow accumulation zone (0.008–0.0072) has acted as a high-liquidity demand region.
Volume confirmation is crucial — a breakout without volume often leads to a false move.
Momentum appears to be shifting slowly, but true confirmation will depend on how the next few daily closes unfold.
---
Conclusion
> CELR stands at a historic inflection point.
The clash between long-term selling pressure and strong accumulation support will determine its next trend direction.
A breakout above resistance could trigger a long-awaited trend reversal, while a breakdown below support could extend the bearish structure.
Patience and confirmation are key — not anticipation.
---
#CELRUSDT #CELR #CelerNetwork #CryptoAnalysis #TechnicalAnalysis #DescendingTriangle #BreakoutSetup #TrendReversal #DecisionPoint #CryptoTrading #SupportResistance #SwingTrade
✅ Get Free Signals! Join Our Telegram Channel Here: t.me/TheCryptoNuclear
✅ Twitter: twitter.com/crypto_nuclear
✅ Join Bybit : partner.bybit.com/b/nuclearvip
✅ Benefits : Lifetime Trading Fee Discount -50%
✅ Twitter: twitter.com/crypto_nuclear
✅ Join Bybit : partner.bybit.com/b/nuclearvip
✅ Benefits : Lifetime Trading Fee Discount -50%
Haftungsausschluss
Die Informationen und Veröffentlichungen sind nicht als Finanz-, Anlage-, Handels- oder andere Arten von Ratschlägen oder Empfehlungen gedacht, die von TradingView bereitgestellt oder gebilligt werden, und stellen diese nicht dar. Lesen Sie mehr in den Nutzungsbedingungen.