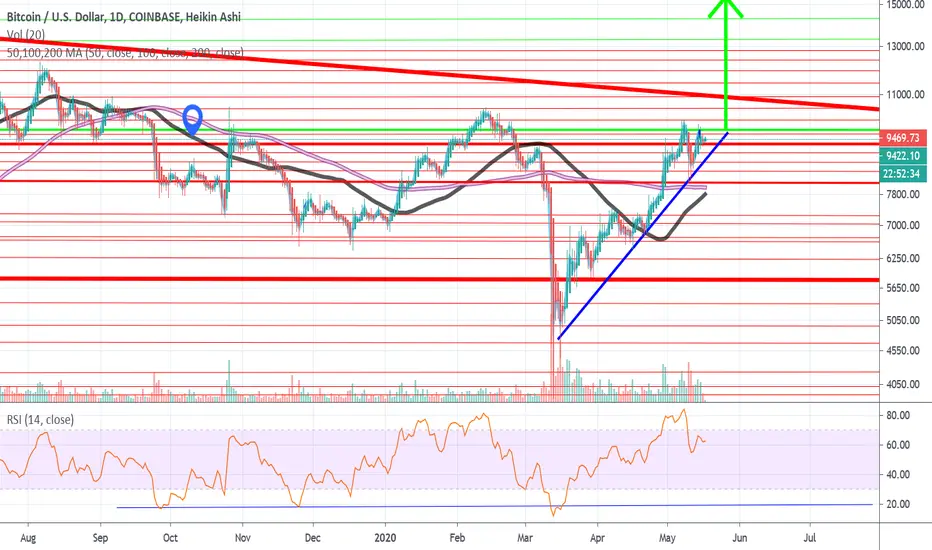
Inside of the ascending triangle on a micro scale Bitcoin is forming a cup & handle, there is merit potentially for a inverted H&S as well.
The RSI is displaying a inverse H&S, interesting because the moving averages are about to converge
Only time will tell, but a golden cross followed by an immediate death cross seems like a future occurrence.
The RSI is displaying a inverse H&S, interesting because the moving averages are about to converge
Only time will tell, but a golden cross followed by an immediate death cross seems like a future occurrence.
Anmerkung
You can see the inverse H&S well on a smaller time frame, and additionally, the bullish flag becomes apparent. I have placed three green arrows pointing sideways to the right that will either hold for a triple bottom or play out bearishly as a descending triangle once breaking below the bottom area of confluence.

Haftungsausschluss
Die Informationen und Veröffentlichungen sind nicht als Finanz-, Anlage-, Handels- oder andere Arten von Ratschlägen oder Empfehlungen gedacht, die von TradingView bereitgestellt oder gebilligt werden, und stellen diese nicht dar. Lesen Sie mehr in den Nutzungsbedingungen.
Haftungsausschluss
Die Informationen und Veröffentlichungen sind nicht als Finanz-, Anlage-, Handels- oder andere Arten von Ratschlägen oder Empfehlungen gedacht, die von TradingView bereitgestellt oder gebilligt werden, und stellen diese nicht dar. Lesen Sie mehr in den Nutzungsbedingungen.