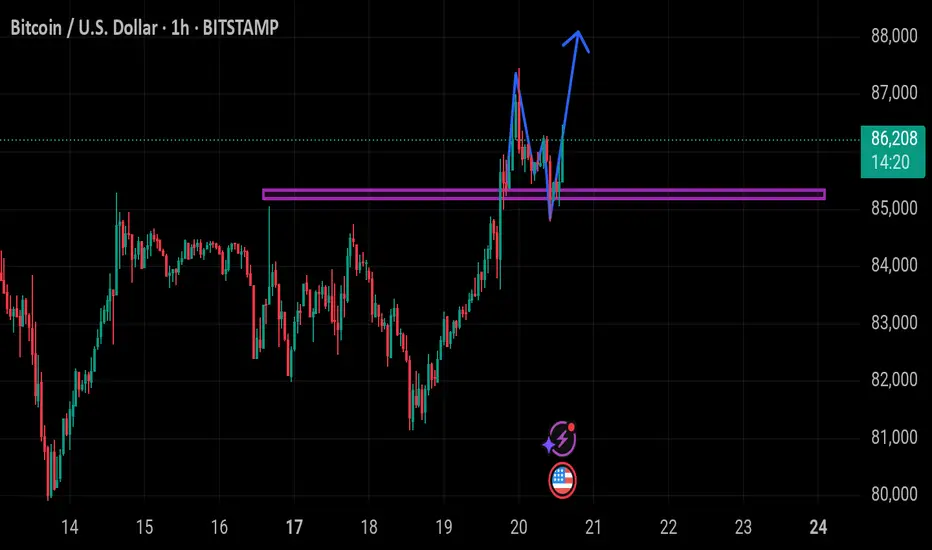
This is a Bitcoin (BTC/USD) price chart on the 1-hour timeframe from TradingView. The price is currently at $86,278, down -0.68%.
Key Observations:
1. Support Zone (Purple Line): A strong horizontal support/resistance level is drawn around $85,000.
2. Breakout & Retest: The price recently broke above this support zone, retested it, and bounced back up.
3. Bullish Projection (Blue Arrow): A potential bullish move is indicated, suggesting further upside momentum.
This chart suggests a possible continuation of the uptrend if the support holds. Let me know if you need further analysis!
Haftungsausschluss
Die Informationen und Veröffentlichungen sind nicht als Finanz-, Anlage-, Handels- oder andere Arten von Ratschlägen oder Empfehlungen gedacht, die von TradingView bereitgestellt oder gebilligt werden, und stellen diese nicht dar. Lesen Sie mehr in den Nutzungsbedingungen.
Haftungsausschluss
Die Informationen und Veröffentlichungen sind nicht als Finanz-, Anlage-, Handels- oder andere Arten von Ratschlägen oder Empfehlungen gedacht, die von TradingView bereitgestellt oder gebilligt werden, und stellen diese nicht dar. Lesen Sie mehr in den Nutzungsbedingungen.