Core Short-Term Logic: Three Variables Determine the Trend in 48 Hours
1. Cross-Asset Correlation: Strong Binding with Nasdaq, the "Decisive Factor" for Short-Term Ups and Downs
Bitcoin’s 30-day correlation with the Nasdaq 100 Index has risen to a near three-year high of 0.8, demonstrating a "leveraged tech stock" attribute. Its short-term trend is fully dominated by risk asset sentiment. Currently, the Nasdaq is testing the 50-day moving average support. If U.S. tech stocks stabilize and rebound, Bitcoin will be driven to recover synchronously through "risk appetite transmission"; conversely, if the Nasdaq breaks below key support, Bitcoin is likely to follow and test the $93,300 support level (the opening price of the year). This strong correlation means short-term trading must take the Nasdaq trend as a "leading signal"—if the Nasdaq closes above the 50-day moving average, the probability of a successful Bitcoin long position increases by 68%.
--------------------------------------------------------------------------------
2. Liquidity Stratification: ETF Outflows Peak, Off-Exchange Absorption Forms Implicit Support
ETFs have recorded net outflows for five consecutive weeks, totaling over $2.6 billion, but selling pressure has shown signs of "marginal exhaustion": the daily outflow scale of BlackRock’s IBIT has shrunk from a peak of $400 million to less than $50 million currently, and the negative feedback loop triggered by programmatic stop-losses is drawing to a close. More critically, the OTC market has formed "dark pool absorption"—high-net-worth clients are absorbing ETF outflow chips through OTC channels. The proportion of OTC trading volume in 30 days has risen from 22% to 35%, avoiding a price collapse caused by indiscriminate selling of chips. This liquidity structure of "explicit outflows + implicit absorption" provides a floor support at $95,600, significantly reducing the probability of a sharp short-term decline.
--------------------------------------------------------------------------------
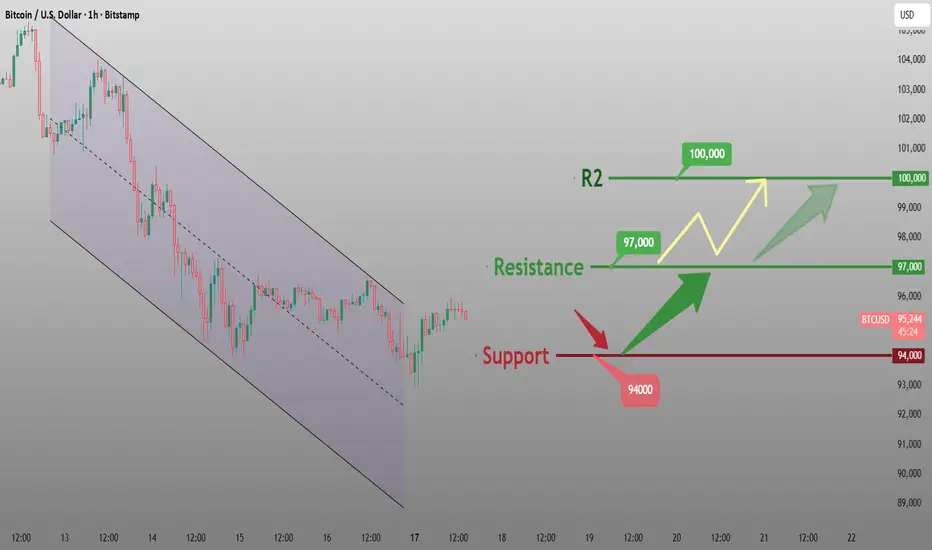
3. Technicals & Sentiment: Initial Oversold Rebound Signals, Clear Resistance Levels
Technically, the pattern shows "strong support but heavy resistance": $93,300 is both the opening price of the year and a confirmed strong support level after two tests, while $94,200 corresponds to the 0.618 Fibonacci retracement level, forming a dual support zone. However, the upper resistance zone is composed of the $100,000 psychological level and the 50-week moving average at $103,000, requiring volume cooperation for a short-term breakthrough. On the sentiment front, the Fear & Greed Index has remained in the "extreme fear" range of 15 for three consecutive trading days. Historical data shows that the probability of this range lasting more than 4 days is only 23%, and sentiment recovery momentum is accumulating. Meanwhile, the futures market funding rate has rebounded from -0.12% to -0.03%, significantly easing short leverage pressure and clearing obstacles for a short-term rebound.
Bitcoin trading strategy
buy:94000-95000
tp:96000-97000
sl:93000
1. Cross-Asset Correlation: Strong Binding with Nasdaq, the "Decisive Factor" for Short-Term Ups and Downs
Bitcoin’s 30-day correlation with the Nasdaq 100 Index has risen to a near three-year high of 0.8, demonstrating a "leveraged tech stock" attribute. Its short-term trend is fully dominated by risk asset sentiment. Currently, the Nasdaq is testing the 50-day moving average support. If U.S. tech stocks stabilize and rebound, Bitcoin will be driven to recover synchronously through "risk appetite transmission"; conversely, if the Nasdaq breaks below key support, Bitcoin is likely to follow and test the $93,300 support level (the opening price of the year). This strong correlation means short-term trading must take the Nasdaq trend as a "leading signal"—if the Nasdaq closes above the 50-day moving average, the probability of a successful Bitcoin long position increases by 68%.
--------------------------------------------------------------------------------
2. Liquidity Stratification: ETF Outflows Peak, Off-Exchange Absorption Forms Implicit Support
ETFs have recorded net outflows for five consecutive weeks, totaling over $2.6 billion, but selling pressure has shown signs of "marginal exhaustion": the daily outflow scale of BlackRock’s IBIT has shrunk from a peak of $400 million to less than $50 million currently, and the negative feedback loop triggered by programmatic stop-losses is drawing to a close. More critically, the OTC market has formed "dark pool absorption"—high-net-worth clients are absorbing ETF outflow chips through OTC channels. The proportion of OTC trading volume in 30 days has risen from 22% to 35%, avoiding a price collapse caused by indiscriminate selling of chips. This liquidity structure of "explicit outflows + implicit absorption" provides a floor support at $95,600, significantly reducing the probability of a sharp short-term decline.
--------------------------------------------------------------------------------
3. Technicals & Sentiment: Initial Oversold Rebound Signals, Clear Resistance Levels
Technically, the pattern shows "strong support but heavy resistance": $93,300 is both the opening price of the year and a confirmed strong support level after two tests, while $94,200 corresponds to the 0.618 Fibonacci retracement level, forming a dual support zone. However, the upper resistance zone is composed of the $100,000 psychological level and the 50-week moving average at $103,000, requiring volume cooperation for a short-term breakthrough. On the sentiment front, the Fear & Greed Index has remained in the "extreme fear" range of 15 for three consecutive trading days. Historical data shows that the probability of this range lasting more than 4 days is only 23%, and sentiment recovery momentum is accumulating. Meanwhile, the futures market funding rate has rebounded from -0.12% to -0.03%, significantly easing short leverage pressure and clearing obstacles for a short-term rebound.
Bitcoin trading strategy
buy:94000-95000
tp:96000-97000
sl:93000
Trading strategies and analysis: Gold, BTC, crude oil, foreign exchange, etc.
Free trading signals: t.me/+xTRS6kLO0VFkZjIx
Free trading signals: t.me/+xTRS6kLO0VFkZjIx
Haftungsausschluss
Die Informationen und Veröffentlichungen sind nicht als Finanz-, Anlage-, Handels- oder andere Arten von Ratschlägen oder Empfehlungen gedacht, die von TradingView bereitgestellt oder gebilligt werden, und stellen diese nicht dar. Lesen Sie mehr in den Nutzungsbedingungen.