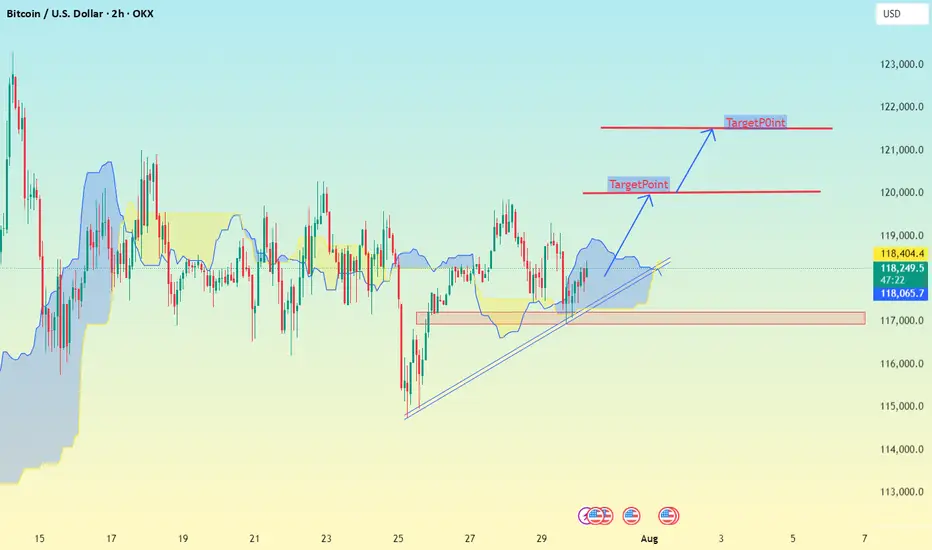
✅ Chart Analysis (2h Timeframe)
MY using Ichimoku Cloud, support/resistance zones, and trend lines.
Price is currently around 118,319 USD.
It has broken out of the Ichimoku cloud and is respecting the trendline support, indicating bullish momentum.
---
🎯 Upside Target Levels
🔵 Target 1:
Level: ~120,000 USD
Reason: Horizontal resistance (clearly marked)
Action: Minor profit-taking or partial exit
🔵 Target 2 (Main):
Level: ~122,000 USD
Reason: Second resistance zone & projected move from breakout
Action: Ideal full target zone
---
🔻 Support & Invalidations
🟡 Immediate Support Zone:
Levels:
118,404
118,296
118,065
These are dynamic Ichimoku & short-term support levels
📲 Join telegram channel free .
t.me/addlist/dg3uSwzkMSplNjFk
Forex, Gold & Crypto Signals with detailed analysis & get consistent results.
t.me/addlist/dg3uSwzkMSplNjFk
Gold Signal's with proper TP & SL for high profit opportunities.
t.me/addlist/dg3uSwzkMSplNjFk
Forex, Gold & Crypto Signals with detailed analysis & get consistent results.
t.me/addlist/dg3uSwzkMSplNjFk
Gold Signal's with proper TP & SL for high profit opportunities.
Haftungsausschluss
Die Informationen und Veröffentlichungen sind nicht als Finanz-, Anlage-, Handels- oder andere Arten von Ratschlägen oder Empfehlungen gedacht, die von TradingView bereitgestellt oder gebilligt werden, und stellen diese nicht dar. Lesen Sie mehr in den Nutzungsbedingungen.