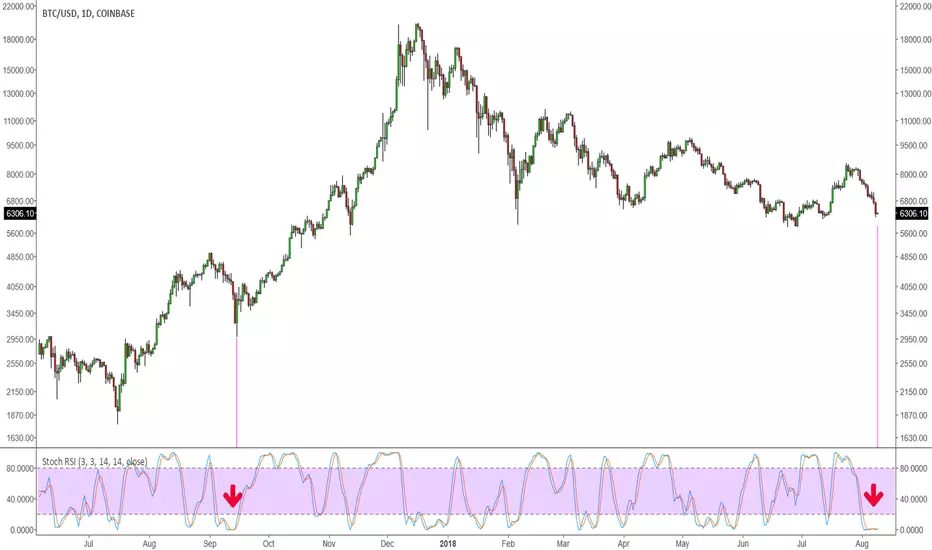
I made a peculiar observation while looking at the charts this evening. Everybody looks at the price for waves, support / resistance, fibs, etc. etc. etc. But while looking at the daily Stochastic RSI Indicator I noticed that it has basically flat-lined. That seemed odd so I went back as far as I could to find something similar. I could only find one similar occurrence. This is the chart. Make of it what you will.
Disclaimer. I've been long since about $6,185, so yeah, I'm looking for this bounce to continue. :)
Disclaimer. I've been long since about $6,185, so yeah, I'm looking for this bounce to continue. :)
Trade wurde manuell geschlossen
I took a small profit and closed my long. Currently flat. I'm not happy with the price reaction so. Could it go higher? Sure. Could it flush even further? Yep. For that reason I'm going to sit back and wait for a better long entry. I'm not 100% convinced the decline is over and I have no clue if, or how large/small, any retrace might be. I have an idea, but not many ideas are working 100% lately so nothing is reliable.Haftungsausschluss
Die Informationen und Veröffentlichungen sind nicht als Finanz-, Anlage-, Handels- oder andere Arten von Ratschlägen oder Empfehlungen gedacht, die von TradingView bereitgestellt oder gebilligt werden, und stellen diese nicht dar. Lesen Sie mehr in den Nutzungsbedingungen.
Haftungsausschluss
Die Informationen und Veröffentlichungen sind nicht als Finanz-, Anlage-, Handels- oder andere Arten von Ratschlägen oder Empfehlungen gedacht, die von TradingView bereitgestellt oder gebilligt werden, und stellen diese nicht dar. Lesen Sie mehr in den Nutzungsbedingungen.
