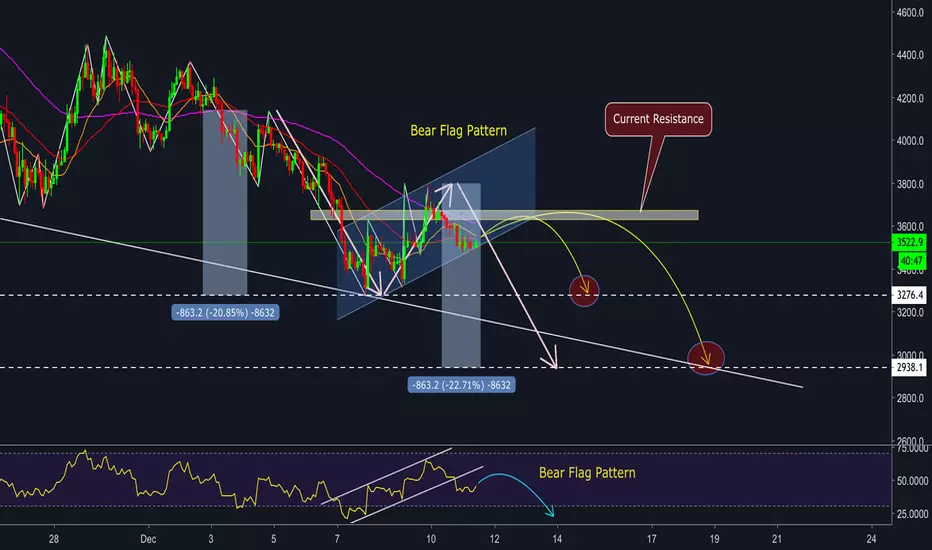
BITCOIN - Bearish Flag Pattern - The bottom zone

Hi guys, xuanhaimmoer is here for all you with the daily updated in today like a gift so LIKE this post for support me for more daily analysis !
Okay, today I also public chart for short term and middle term. I also keep my opinion in for several days that is hard for Bitcoin break up the important zone 3600$ - 3900$. You can also check my last daily analysis in yesterday in here:

So after the last day I public my analysis the price fall down. What meaning about that ? We all see that Crypto market right now is capitulation and disbelieve about the future. Also some investor - they are in panic psychology.
So any one think that we can bounce up immediately ? Comment in below this post if you think it can bounce up right now and your explain?
Today I update about the new signals. As last chart, we have Bearish Flag Patter in RSI so it has been break down as I predict in yesterday. So look at RSI because it may give us very helpful predict right now.
When RSI break down the pattern so it must re-test the break-out point before keep dropping. So what about the price ?
Surely, may we have small up correction from now before dropping to 2 targets in below.
The target for re-test is 36xx$ before dropping. And focus on the price we also have similar pattern with Bearish Flag Pattern. And when I calculated we may fall down to 29xx$ after we reach 32xx$ ( the last bottom zone )
Okay, so in above is my explain about the psychology for all you why we can go up at this time, may be yes but we need lower bottom zone for momentum for pump.
I also update my viewpoint about the target for short-middle term.
So hope all you interesting with this chart and LIKE this chart for next day with my analysis update for long term.
Which price for Bitcoin in next 5 - 7 years ? So LIKE for new update in tomorrow.
LOVE ALL YOU <3 <3 <3
Okay, today I also public chart for short term and middle term. I also keep my opinion in for several days that is hard for Bitcoin break up the important zone 3600$ - 3900$. You can also check my last daily analysis in yesterday in here:

So after the last day I public my analysis the price fall down. What meaning about that ? We all see that Crypto market right now is capitulation and disbelieve about the future. Also some investor - they are in panic psychology.
So any one think that we can bounce up immediately ? Comment in below this post if you think it can bounce up right now and your explain?
Today I update about the new signals. As last chart, we have Bearish Flag Patter in RSI so it has been break down as I predict in yesterday. So look at RSI because it may give us very helpful predict right now.
When RSI break down the pattern so it must re-test the break-out point before keep dropping. So what about the price ?
Surely, may we have small up correction from now before dropping to 2 targets in below.
The target for re-test is 36xx$ before dropping. And focus on the price we also have similar pattern with Bearish Flag Pattern. And when I calculated we may fall down to 29xx$ after we reach 32xx$ ( the last bottom zone )
Okay, so in above is my explain about the psychology for all you why we can go up at this time, may be yes but we need lower bottom zone for momentum for pump.
I also update my viewpoint about the target for short-middle term.
So hope all you interesting with this chart and LIKE this chart for next day with my analysis update for long term.
Which price for Bitcoin in next 5 - 7 years ? So LIKE for new update in tomorrow.
LOVE ALL YOU <3 <3 <3
Anmerkung
If this post reached 200 LIKEs >>> I will make a report about the price of Bitcoin in next 5 years <3 <3 <3Anmerkung
Reached target 1Verbundene Veröffentlichungen
Haftungsausschluss
Die Informationen und Veröffentlichungen sind nicht als Finanz-, Anlage-, Handels- oder andere Arten von Ratschlägen oder Empfehlungen gedacht, die von TradingView bereitgestellt oder gebilligt werden, und stellen diese nicht dar. Lesen Sie mehr in den Nutzungsbedingungen.
Verbundene Veröffentlichungen
Haftungsausschluss
Die Informationen und Veröffentlichungen sind nicht als Finanz-, Anlage-, Handels- oder andere Arten von Ratschlägen oder Empfehlungen gedacht, die von TradingView bereitgestellt oder gebilligt werden, und stellen diese nicht dar. Lesen Sie mehr in den Nutzungsbedingungen.


