Title:
Complete Beginner’s Guide to Fibonacci, AutoFibGauge, and How to Plan Perfect Trades! 🎯
⸻
Many traders hear about Fibonacci but don’t really know what it is or how to use it properly.
Here’s a full beginner-friendly guide covering everything — from the math basics to real trading strategies!
What is Fibonacci?
The Fibonacci Sequence is a set of numbers where each number is the sum of the two numbers before it.
It looks like this:
0, 1, 1, 2, 3, 5, 8, 13, 21, 34, 55, 89, 144…
This simple rule creates a pattern that we see everywhere in nature:
• In the way flowers bloom
• In the spiral of seashells
• In the structure of hurricanes
• Even in galaxies
Nature follows Fibonacci.
Markets, which are built by human emotions (fear, greed, hope), also often follow Fibonacci behavior.
That’s why Fibonacci is important in trading.
⸻
The Special Golden Ratio — 61.8%
From the Fibonacci sequence, if you divide a number by the next one (e.g., 21 ÷ 34), you get approximately 0.618 — or 61.8%.
This is called the Golden Ratio.
The Golden Ratio shows up in art, architecture, music, human faces, and… yes, financial markets.
In trading, the 61.8% retracement is considered the strongest potential turning point.
If a price pulls back by around 61.8%, there’s a high chance it will bounce and continue the trend.
⸻
What is Fibonacci Retracement in Trading?
In trading, after a big move (up or down), the market rarely moves in a straight line.
It pulls back (corrects) before continuing.
Fibonacci Retracement levels help us predict where the pullback might end and the trend might continue.
Commonly Used Fibonacci Levels:
• 23.6% — Very shallow retracement
• 38.2% — Healthy pullback
• 50.0% — Halfway mark (not a Fibonacci number, but widely watched)
• 61.8% — Golden zone (high probability area)
• 78.6% — Deep retracement before a reversal
Traders look at these levels as support and resistance zones.
⸻
What is AutoFibGauge?
Normally, drawing Fibonacci manually takes time — you have to find correct swings and plot retracement.
AutoFibGauge does it automatically:
• Detects swing highs and swing lows
• Plots Fibonacci retracement levels instantly
• Keeps updating live as price moves
✅ Saves time
✅ Reduces human error
✅ Keeps your chart clean and professional
It’s built for traders who want speed, simplicity, and reliability.
⸻
My Default Settings for AutoFibGauge:
• Swing Length: 25
• Fib Levels Displayed: 23.6%, 38.2%, 50.0%, 61.8%, 78.6%, 100%
• Mode: Automatic (finds swings without needing to adjust)
• Visual: Bands instead of just thin lines (for easier viewing)
Adjustment Tip:
• 15 min chart: Swing Length 20–25
• 1 Hour chart: Swing Length 25–30
• 4 Hour chart: Swing Length 30–40
Higher timeframes = Slightly bigger swing lengths.
⸻
How to Plan Entry:
1. Wait for price to approach a major Fibonacci level (especially 38.2%, 50%, or 61.8%).
2. Watch how the candles behave:
• If you see a bullish engulfing candle, hammer, or strong bounce from the level → Good sign to buy.
• If price hesitates or gives bearish reversal → Could signal continuation of downtrend.
3. Combine with trend confirmation tools (QMA, Parabolic SAR, moving averages).
✅ Remember: Confirmation is key.
Don’t just blindly buy or sell because price touched a level.
⸻
How to Plan Exit:
• Set first target at the next major Fibonacci level.
Example:
• If you enter near 61.8%, target 38.2% or 23.6%.
• Another method: Trail your stop-loss behind swing highs/lows as price moves in your favor.
✅ This way you lock profits even if the market reverses later.
⸻
When Fibonacci Works Well:
✅ In trending markets (clear uptrend or downtrend)
✅ When combined with price action or indicators
✅ After strong impulsive moves followed by natural pullbacks
⸻
When Fibonacci Might Not Work Well:
❌ In sideways (rangebound) markets
❌ During extreme news events or unexpected volatility
❌ When used alone without confirmation
Always remember — Fibonacci levels are not magical.
They are guidelines, not exact rules.
You need to combine them with market structure and momentum for best results.
⸻
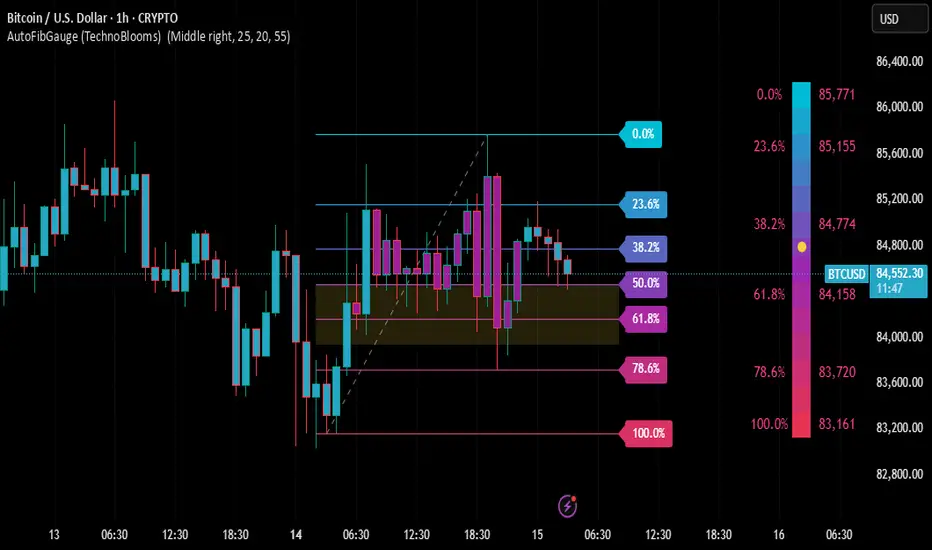
Real Example (BTC/USD 1H Chart):
• After a rally, price retraced into the 50%-61.8% zone.
• Bullish candles appeared showing price respecting the zone.
• This was an excellent opportunity to plan a long entry with Fibonacci guidance.
⸻
Final Words:
• Fibonacci is not only for “professional” traders — anyone can learn it.
• AutoFibGauge makes using Fibonacci simple and automatic, even if you’re just starting out.
• If you respect the levels, wait for confirmation, and follow a disciplined plan, Fibonacci becomes one of your best trading tools.
⸻
Found this helpful? Tap LIKE ❤ & FOLLOW ➕ for more beginner-to-advanced trading guides every week!
⸻
#Fibonacci #AutoFibGauge #FibonacciRetracement #TechnicalAnalysis #PriceAction #TradingTools #LearnTrading #CryptoTrading #ForexStrategy #SwingTrading #BeginnersGuide
Complete Beginner’s Guide to Fibonacci, AutoFibGauge, and How to Plan Perfect Trades! 🎯
⸻
Many traders hear about Fibonacci but don’t really know what it is or how to use it properly.
Here’s a full beginner-friendly guide covering everything — from the math basics to real trading strategies!
What is Fibonacci?
The Fibonacci Sequence is a set of numbers where each number is the sum of the two numbers before it.
It looks like this:
0, 1, 1, 2, 3, 5, 8, 13, 21, 34, 55, 89, 144…
This simple rule creates a pattern that we see everywhere in nature:
• In the way flowers bloom
• In the spiral of seashells
• In the structure of hurricanes
• Even in galaxies
Nature follows Fibonacci.
Markets, which are built by human emotions (fear, greed, hope), also often follow Fibonacci behavior.
That’s why Fibonacci is important in trading.
⸻
The Special Golden Ratio — 61.8%
From the Fibonacci sequence, if you divide a number by the next one (e.g., 21 ÷ 34), you get approximately 0.618 — or 61.8%.
This is called the Golden Ratio.
The Golden Ratio shows up in art, architecture, music, human faces, and… yes, financial markets.
In trading, the 61.8% retracement is considered the strongest potential turning point.
If a price pulls back by around 61.8%, there’s a high chance it will bounce and continue the trend.
⸻
What is Fibonacci Retracement in Trading?
In trading, after a big move (up or down), the market rarely moves in a straight line.
It pulls back (corrects) before continuing.
Fibonacci Retracement levels help us predict where the pullback might end and the trend might continue.
Commonly Used Fibonacci Levels:
• 23.6% — Very shallow retracement
• 38.2% — Healthy pullback
• 50.0% — Halfway mark (not a Fibonacci number, but widely watched)
• 61.8% — Golden zone (high probability area)
• 78.6% — Deep retracement before a reversal
Traders look at these levels as support and resistance zones.
⸻
What is AutoFibGauge?
Normally, drawing Fibonacci manually takes time — you have to find correct swings and plot retracement.
AutoFibGauge does it automatically:
• Detects swing highs and swing lows
• Plots Fibonacci retracement levels instantly
• Keeps updating live as price moves
✅ Saves time
✅ Reduces human error
✅ Keeps your chart clean and professional
It’s built for traders who want speed, simplicity, and reliability.
⸻
My Default Settings for AutoFibGauge:
• Swing Length: 25
• Fib Levels Displayed: 23.6%, 38.2%, 50.0%, 61.8%, 78.6%, 100%
• Mode: Automatic (finds swings without needing to adjust)
• Visual: Bands instead of just thin lines (for easier viewing)
Adjustment Tip:
• 15 min chart: Swing Length 20–25
• 1 Hour chart: Swing Length 25–30
• 4 Hour chart: Swing Length 30–40
Higher timeframes = Slightly bigger swing lengths.
⸻
How to Plan Entry:
1. Wait for price to approach a major Fibonacci level (especially 38.2%, 50%, or 61.8%).
2. Watch how the candles behave:
• If you see a bullish engulfing candle, hammer, or strong bounce from the level → Good sign to buy.
• If price hesitates or gives bearish reversal → Could signal continuation of downtrend.
3. Combine with trend confirmation tools (QMA, Parabolic SAR, moving averages).
✅ Remember: Confirmation is key.
Don’t just blindly buy or sell because price touched a level.
⸻
How to Plan Exit:
• Set first target at the next major Fibonacci level.
Example:
• If you enter near 61.8%, target 38.2% or 23.6%.
• Another method: Trail your stop-loss behind swing highs/lows as price moves in your favor.
✅ This way you lock profits even if the market reverses later.
⸻
When Fibonacci Works Well:
✅ In trending markets (clear uptrend or downtrend)
✅ When combined with price action or indicators
✅ After strong impulsive moves followed by natural pullbacks
⸻
When Fibonacci Might Not Work Well:
❌ In sideways (rangebound) markets
❌ During extreme news events or unexpected volatility
❌ When used alone without confirmation
Always remember — Fibonacci levels are not magical.
They are guidelines, not exact rules.
You need to combine them with market structure and momentum for best results.
⸻
Real Example (BTC/USD 1H Chart):
• After a rally, price retraced into the 50%-61.8% zone.
• Bullish candles appeared showing price respecting the zone.
• This was an excellent opportunity to plan a long entry with Fibonacci guidance.
⸻
Final Words:
• Fibonacci is not only for “professional” traders — anyone can learn it.
• AutoFibGauge makes using Fibonacci simple and automatic, even if you’re just starting out.
• If you respect the levels, wait for confirmation, and follow a disciplined plan, Fibonacci becomes one of your best trading tools.
⸻
Found this helpful? Tap LIKE ❤ & FOLLOW ➕ for more beginner-to-advanced trading guides every week!
⸻
#Fibonacci #AutoFibGauge #FibonacciRetracement #TechnicalAnalysis #PriceAction #TradingTools #LearnTrading #CryptoTrading #ForexStrategy #SwingTrading #BeginnersGuide
Haftungsausschluss
Die Informationen und Veröffentlichungen sind nicht als Finanz-, Anlage-, Handels- oder andere Arten von Ratschlägen oder Empfehlungen gedacht, die von TradingView bereitgestellt oder gebilligt werden, und stellen diese nicht dar. Lesen Sie mehr in den Nutzungsbedingungen.
Haftungsausschluss
Die Informationen und Veröffentlichungen sind nicht als Finanz-, Anlage-, Handels- oder andere Arten von Ratschlägen oder Empfehlungen gedacht, die von TradingView bereitgestellt oder gebilligt werden, und stellen diese nicht dar. Lesen Sie mehr in den Nutzungsbedingungen.