I know that RSI isn't a solid predictor, but I feel it may be giving us an idea of where our current status is in relation to the overall cycle of Bitcoin.
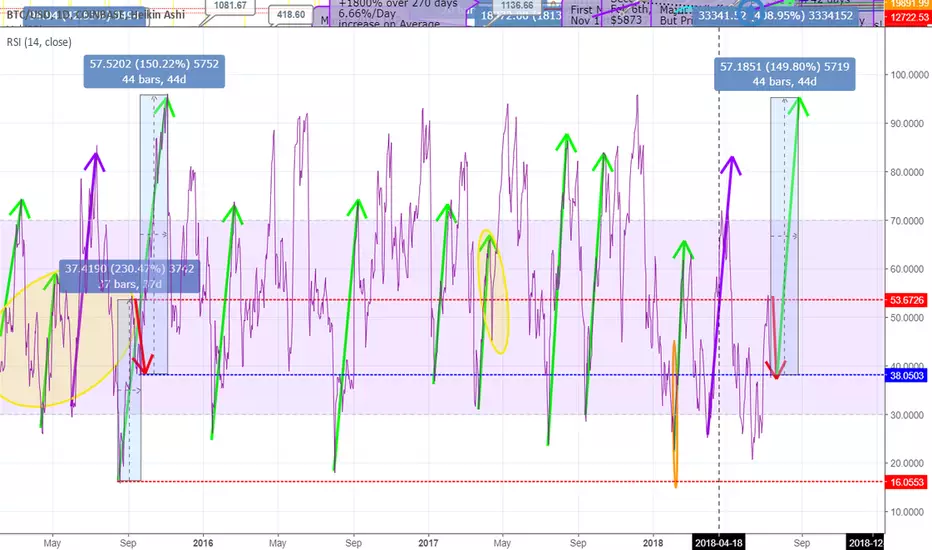
See this image for a zoomed in look at 2015 when we had fallen from a value of $300 per Bitcoin to $198. We rose again for a short time, looked like we may get out, but then we fell again. The RSI pattern is the key here, as I had noted months ago, the current RSI pattern is on target with the same RSI trend of 2015.

I won't make any predictions on price based upon this, but I'll just say be patient, be ready to buy more once you feel we've bottomed out because it won't be long and the uptrend will take off as it does in the image above.
See this image for a zoomed in look at 2015 when we had fallen from a value of $300 per Bitcoin to $198. We rose again for a short time, looked like we may get out, but then we fell again. The RSI pattern is the key here, as I had noted months ago, the current RSI pattern is on target with the same RSI trend of 2015.
I won't make any predictions on price based upon this, but I'll just say be patient, be ready to buy more once you feel we've bottomed out because it won't be long and the uptrend will take off as it does in the image above.
Anmerkung
This is what happened after the RSI bump in 2015...Anmerkung
Ok, here's a prediction.. or a history review..Within 2 years after that RSI pattern bump, the same one we're experiencing now, BTC values went up 2038% from Sept 2015 to Sept 2017.
Anmerkung
We just bounced above the Purple Lambo bottom line.Anmerkung
Is it beginning?Haftungsausschluss
Die Informationen und Veröffentlichungen sind nicht als Finanz-, Anlage-, Handels- oder andere Arten von Ratschlägen oder Empfehlungen gedacht, die von TradingView bereitgestellt oder gebilligt werden, und stellen diese nicht dar. Lesen Sie mehr in den Nutzungsbedingungen.
Haftungsausschluss
Die Informationen und Veröffentlichungen sind nicht als Finanz-, Anlage-, Handels- oder andere Arten von Ratschlägen oder Empfehlungen gedacht, die von TradingView bereitgestellt oder gebilligt werden, und stellen diese nicht dar. Lesen Sie mehr in den Nutzungsbedingungen.