## BLS (NSE: BLS) Weekly Chart Analysis and Trade Idea
### **Technical Overview**
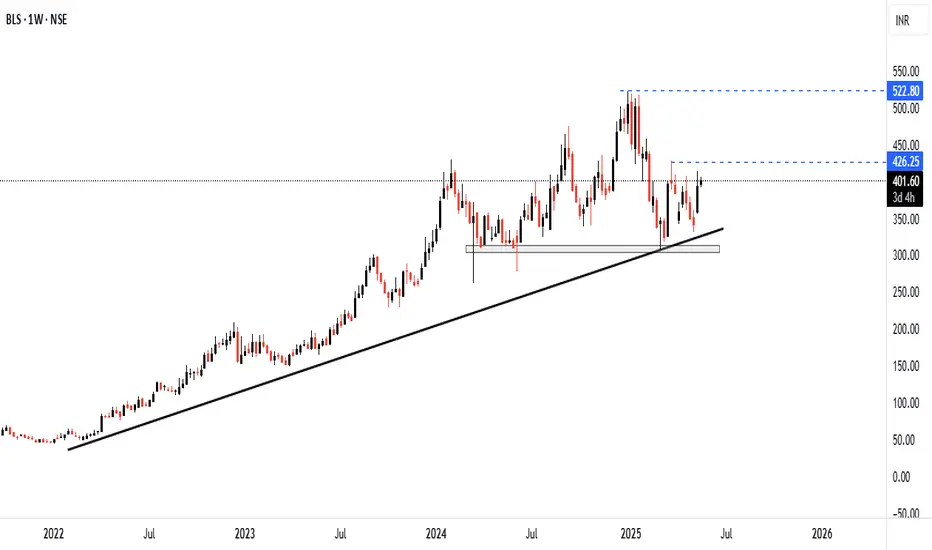
- **Trend:** The chart displays a strong long-term uptrend supported by a rising trendline from early 2022.
- **Support:** The price has repeatedly bounced from the trendline and a horizontal support zone around 350–370 INR.
- **Current Price:** 401.50 INR (as of the latest weekly candle).
- **Resistance Levels:**
- **426.25 INR:** Immediate resistance (dashed blue line).
- **522.80 INR:** Previous all-time high and major resistance (dashed blue line).
Recent Price Action
The stock recently rebounded from the trendline and support zone, suggesting renewed buying interest.
The latest weekly candle is bullish, closing near the highs of the week
### **Summary**
BLS is showing a bullish technical setup after a correction and trendline bounce. As long as the price holds above 350 INR, the outlook remains positive for a move toward 426 INR and potentially 523 INR. If the price closes below 350 INR, consider exiting the trade.
### **Technical Overview**
- **Trend:** The chart displays a strong long-term uptrend supported by a rising trendline from early 2022.
- **Support:** The price has repeatedly bounced from the trendline and a horizontal support zone around 350–370 INR.
- **Current Price:** 401.50 INR (as of the latest weekly candle).
- **Resistance Levels:**
- **426.25 INR:** Immediate resistance (dashed blue line).
- **522.80 INR:** Previous all-time high and major resistance (dashed blue line).
Recent Price Action
The stock recently rebounded from the trendline and support zone, suggesting renewed buying interest.
The latest weekly candle is bullish, closing near the highs of the week
### **Summary**
BLS is showing a bullish technical setup after a correction and trendline bounce. As long as the price holds above 350 INR, the outlook remains positive for a move toward 426 INR and potentially 523 INR. If the price closes below 350 INR, consider exiting the trade.
Haftungsausschluss
Die Informationen und Veröffentlichungen sind nicht als Finanz-, Anlage-, Handels- oder andere Arten von Ratschlägen oder Empfehlungen gedacht, die von TradingView bereitgestellt oder gebilligt werden, und stellen diese nicht dar. Lesen Sie mehr in den Nutzungsbedingungen.
Haftungsausschluss
Die Informationen und Veröffentlichungen sind nicht als Finanz-, Anlage-, Handels- oder andere Arten von Ratschlägen oder Empfehlungen gedacht, die von TradingView bereitgestellt oder gebilligt werden, und stellen diese nicht dar. Lesen Sie mehr in den Nutzungsbedingungen.