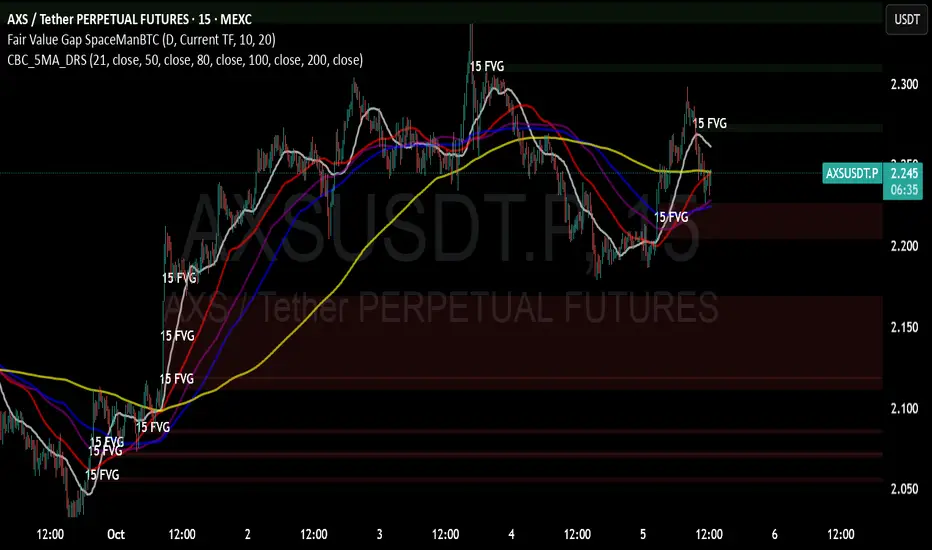
AXS is currently trading below multiple Fair Value Gaps (FVGs) on the higher timeframes, with strong confluence zones forming on the 4H chart.
Weekly Chart Outlook:
Two bullish FVGs above price:
$4.65 – $5.52 (major imbalance zone)
$4.00 (minor FVG)
Two bearish FVGs below price:
$1.88
$0.66 (extreme low – could be tapped only if the market turns strongly bearish)
4H Chart Structure:
Active FVG: $2.34 – $2.37 → aligns perfectly with the 200 MA, a key dynamic resistance.
Below price: three smaller FVGs
$2.17 – $2.12 (near 50 MA, solid demand)
$2.00 zone (historical liquidity pocket)
Momentum: RSI rising from oversold; structure forming potential higher low.
💡 Bias & Plan:
Watching for a retrace into $2.17–$2.12 to confirm a higher low before entering long.
Targeting the $2.34 – $2.37 FVG first, and eventually the $4.00+ zone if momentum sustains.
Invalidation below $1.95.
If the broader market enters a deeper bear cycle, the $0.66–$1.88 levels could be revisited — however, at current momentum and liquidity structure, such retrace would likely take several months, not immediate.
---
⏳ Expected Timing:
If BTC maintains range-bound or mildly bullish momentum, the $0.66 zone would only be hit in a full macro downturn, potentially in 2026 or later.
Short term (1–3 weeks): expecting reaction around **$2.12–$
Haftungsausschluss
Die Informationen und Veröffentlichungen sind nicht als Finanz-, Anlage-, Handels- oder andere Arten von Ratschlägen oder Empfehlungen gedacht, die von TradingView bereitgestellt oder gebilligt werden, und stellen diese nicht dar. Lesen Sie mehr in den Nutzungsbedingungen.
Haftungsausschluss
Die Informationen und Veröffentlichungen sind nicht als Finanz-, Anlage-, Handels- oder andere Arten von Ratschlägen oder Empfehlungen gedacht, die von TradingView bereitgestellt oder gebilligt werden, und stellen diese nicht dar. Lesen Sie mehr in den Nutzungsbedingungen.