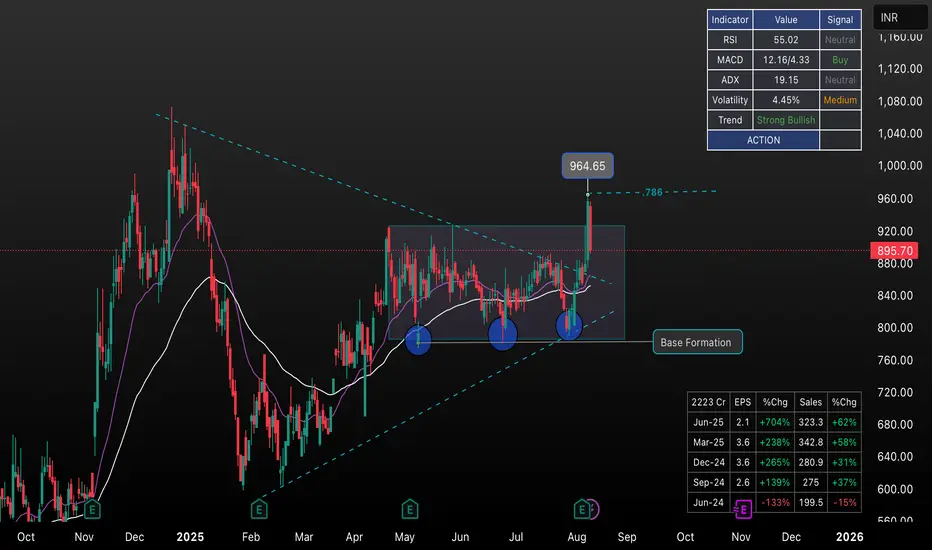
Technical Analysis Overview:
AVALON is currently displaying a classic base formation pattern on the daily chart, which is a bullish continuation signal following the strong uptrend from earlier lows.
Key Observations:
• Current Price: ₹895.70 (as of recent data)
• Pattern: Clean base formation around the ₹780-800 support zone
• Volume: Consolidation phase with declining volume, typical of healthy basing patterns
• Technical Indicators: Strong Buy signal from moving averages (12 buy vs 0 sell signals)
• RSI: 56.04 - indicating bullish momentum without being overbought
Base Formation Analysis: The stock has been consolidating in a tight range after the significant rally, forming what technical analysts call a “flat base pattern”. This is a second-stage consolidation that typically provides another buying opportunity before the next leg up.
Key Levels to Watch:
• Resistance: ₹900-920 zone (recent highs)
• Support: ₹780-800 (base formation low)
• Breakout Target: Above ₹920 could trigger next bullish move
Trading Strategy:
• Entry: On breakout above ₹900-920 with volume confirmation
• Stop Loss: Below ₹780 (base support)
• Target: ₹1000+ based on base depth projection
Risk Management: The tight consolidation range offers an excellent risk-reward ratio for position traders. The narrow base formation suggests strong underlying demand.
Fundamental Backdrop: AVALON Technologies shows strong financial metrics with consistent growth, supporting the technical setup.
Disclaimer: This is for educational purposes only. Always do your own research and manage risk appropriately.
Haftungsausschluss
Die Informationen und Veröffentlichungen sind nicht als Finanz-, Anlage-, Handels- oder andere Arten von Ratschlägen oder Empfehlungen gedacht, die von TradingView bereitgestellt oder gebilligt werden, und stellen diese nicht dar. Lesen Sie mehr in den Nutzungsbedingungen.
Haftungsausschluss
Die Informationen und Veröffentlichungen sind nicht als Finanz-, Anlage-, Handels- oder andere Arten von Ratschlägen oder Empfehlungen gedacht, die von TradingView bereitgestellt oder gebilligt werden, und stellen diese nicht dar. Lesen Sie mehr in den Nutzungsbedingungen.