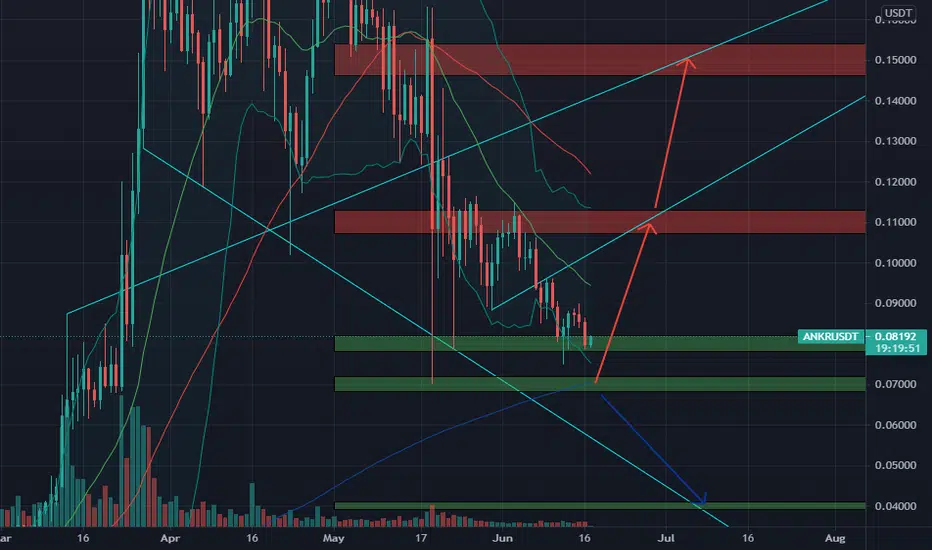
$0.07 and $0.08 are reliable support zones of ANKR so that a strong buying force can appear and create a strong rally for ANKR to $0.11 and $0.15 zones in June and early July. The risk is quite low, but if ANKR loses the $0.07 zone, it will continue a strong downtrend to the $0.04 zone.
📈BUY
🔴Buy : 0.078-0.082$
🔴Buy : 0.068-0.072$. SL if B
📉SELL
🔴Sell : 0.107-0.113$. SL if A
🔴Sell : 0.146-0.154$. SL if A
♻️BACK-UP
🔵Sell : 0.068-0.072$ if B. SL if A
🔵Buy : 0.039-0.041$. SL if B
❓Details
🕯Timeframe : 1 Day
📈Red Arrow : Main Direction as BUY and SELL section
📉Blue Arrow : Back-Up Direction as BACK-UP section
🟩Green zone : Support zone as BUY section
🟥Red zone : Resistance zone as SELL section
🅰️A : The Close price of candlestick is Above the zone
🅱️B : The Close price of candlestick is Below the zone
Verbundene Veröffentlichungen
Haftungsausschluss
Die Informationen und Veröffentlichungen sind nicht als Finanz-, Anlage-, Handels- oder andere Arten von Ratschlägen oder Empfehlungen gedacht, die von TradingView bereitgestellt oder gebilligt werden, und stellen diese nicht dar. Lesen Sie mehr in den Nutzungsbedingungen.