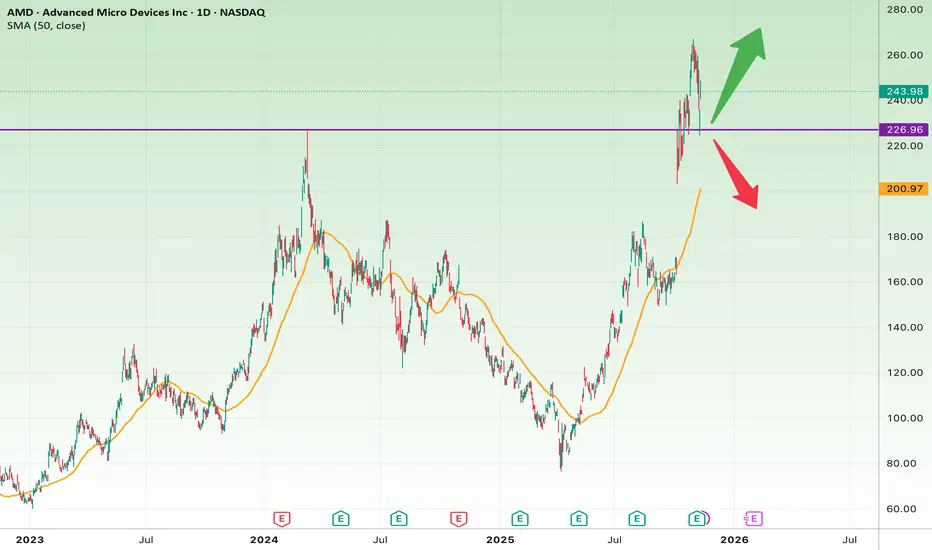
AMD surged strongly from around $140 to nearly $275, and it’s now pulling back toward a key support zone around $230–$235, which was the previous breakout level. The 50-day SMA (around $199) is trending upward, providing dynamic support below.
Short-Term View (1–3 weeks):
• Holding above $230 would keep the bullish structure intact.
• Short-term target: $255–$265
• Stop-loss: below $225
Long-Term View (2–6 months):
• A confirmed rebound and breakout above $275 could extend the uptrend toward $300 or higher.
• A breakdown below $230, however, may trigger a correction toward $200–$185.
Summary:
AMD is at a decisive support level. If buyers defend the $230 zone, a new rally could form; otherwise, a deeper pullback is likely before the next leg up.
Haftungsausschluss
Die Informationen und Veröffentlichungen sind nicht als Finanz-, Anlage-, Handels- oder andere Arten von Ratschlägen oder Empfehlungen gedacht, die von TradingView bereitgestellt oder gebilligt werden, und stellen diese nicht dar. Lesen Sie mehr in den Nutzungsbedingungen.
Haftungsausschluss
Die Informationen und Veröffentlichungen sind nicht als Finanz-, Anlage-, Handels- oder andere Arten von Ratschlägen oder Empfehlungen gedacht, die von TradingView bereitgestellt oder gebilligt werden, und stellen diese nicht dar. Lesen Sie mehr in den Nutzungsbedingungen.