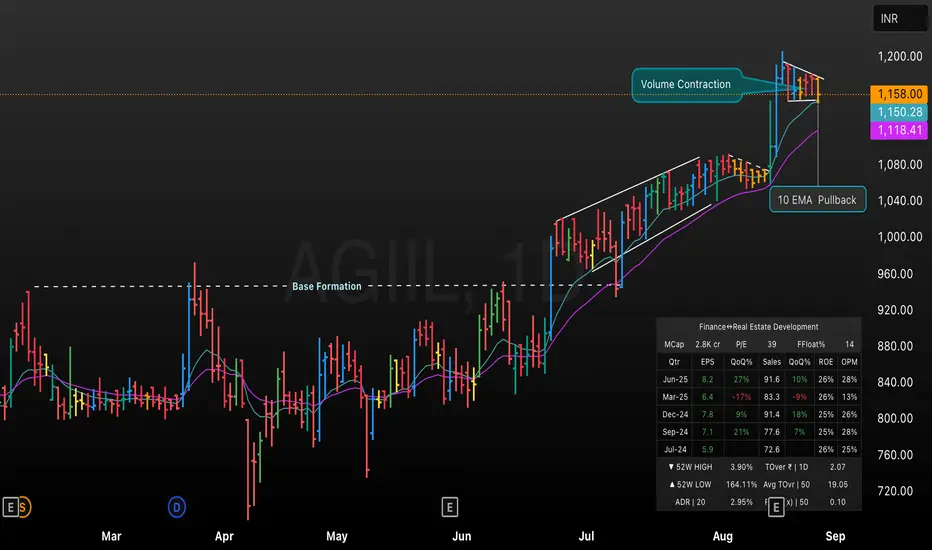
This TradingView chart showcases AGIIL’s technical progression from a prolonged base formation to a strong breakout phase, supported by notable volume contraction and a textbook 10 EMA pullback. Key chart highlights include identification of base formation, a rising price channel, and consolidation with EMA support. The volume contraction and recent price pullback to the 10 EMA reflect a healthy setup typically seen before sustained upward movement, making AGIIL a candidate for breakout trade strategies. Core metrics such as market cap, EPS growth, 52-week range, and liquidity are also visually summarized for quick reference.
Haftungsausschluss
Die Informationen und Veröffentlichungen sind nicht als Finanz-, Anlage-, Handels- oder andere Arten von Ratschlägen oder Empfehlungen gedacht, die von TradingView bereitgestellt oder gebilligt werden, und stellen diese nicht dar. Lesen Sie mehr in den Nutzungsbedingungen.
Haftungsausschluss
Die Informationen und Veröffentlichungen sind nicht als Finanz-, Anlage-, Handels- oder andere Arten von Ratschlägen oder Empfehlungen gedacht, die von TradingView bereitgestellt oder gebilligt werden, und stellen diese nicht dar. Lesen Sie mehr in den Nutzungsbedingungen.