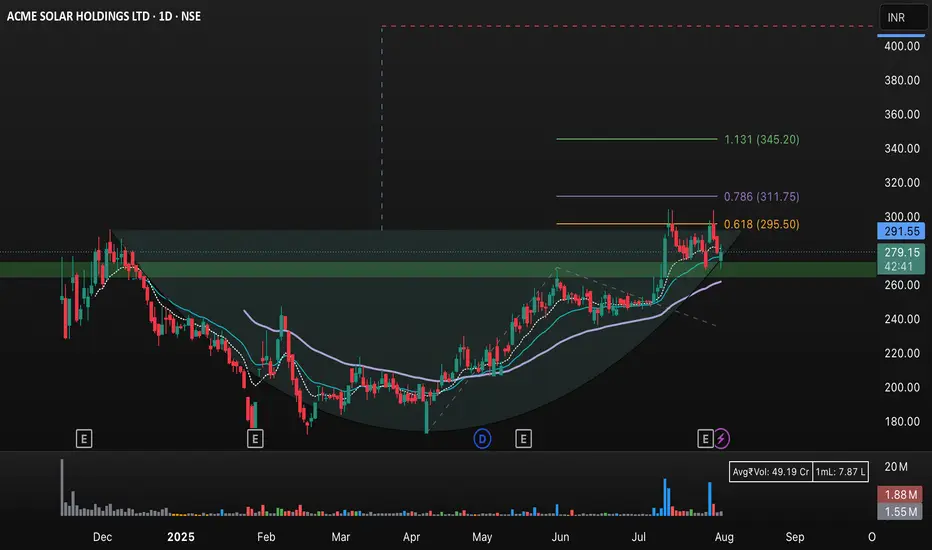
This image displays the daily candlestick chart of ACME Solar Holdings Ltd (NSE: ACMESO) on TradingView. The chart highlights key technical analysis indicators and chart patterns:
• Fibonacci retracement levels at 0.618 (₹295.50), 0.786 (₹311.75), and an extension to 1.131 (₹345.20).
• Support and resistance zones are shaded green, with significant activity around the ₹260–₹300 range.
• A potential cup-and-handle formation is visible, supporting the bullish momentum.
• The current price is ₹279.50, slightly above the 50- and 200-day moving averages (shown as blue lines).
• Volume bars at the bottom indicate substantial trading activity during recent movement.
• The chart suggests a bullish breakout if the price sustains above resistance, with targets at ₹295.50, ₹311.75, and ₹345.20 based on Fibonacci projections, while ₹260 acts as a critical support.
This setup can be used to monitor future price actions, possible breakouts, and key zones for traders and investors.
Haftungsausschluss
Die Informationen und Veröffentlichungen sind nicht als Finanz-, Anlage-, Handels- oder andere Arten von Ratschlägen oder Empfehlungen gedacht, die von TradingView bereitgestellt oder gebilligt werden, und stellen diese nicht dar. Lesen Sie mehr in den Nutzungsbedingungen.
Haftungsausschluss
Die Informationen und Veröffentlichungen sind nicht als Finanz-, Anlage-, Handels- oder andere Arten von Ratschlägen oder Empfehlungen gedacht, die von TradingView bereitgestellt oder gebilligt werden, und stellen diese nicht dar. Lesen Sie mehr in den Nutzungsbedingungen.