ADITYA BIRLA CAPITAL - Bullish Head & Shoulder Pattern formation
Aditya Birla Capital ( ABCAPITAL) has formed an Inverse Head & Shoulder Pattern on the Daily charts.
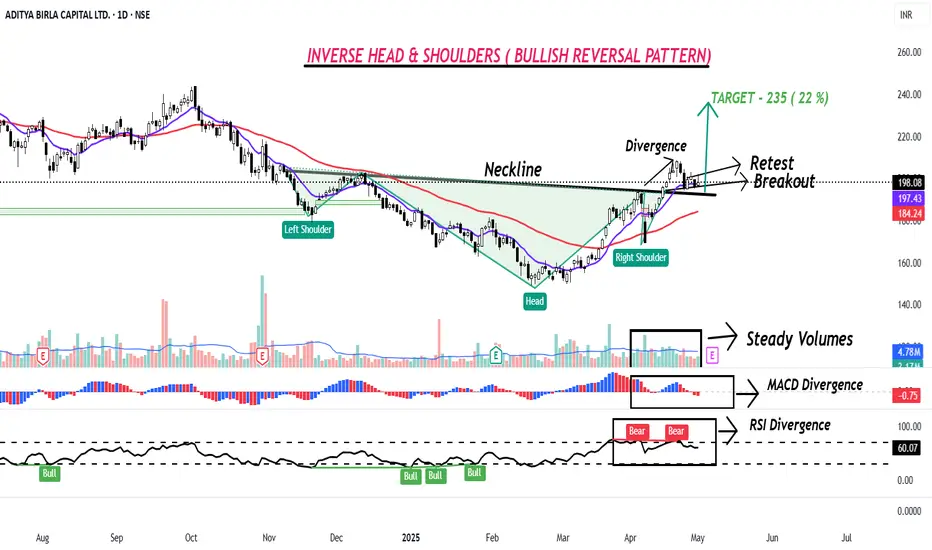
The inverse head and shoulders pattern is a bullish reversal pattern in technical analysis, indicating a potential shift from a downtrend to an uptrend. It's characterized by three consecutive troughs, with the middle trough (the "head") being the lowest, and the other two troughs (the "shoulders") forming higher lows. The neckline is a trendline connecting the highs of the shoulders and the head.
ABCAPITAL broke the neckline of Inverse Head & Shoulder Pattern, after breaking the neckline, bearish divergences were made on MACD AND RSI indicator and the stock fell and took support near the trendline and is probably back on its upward journey.
Divergences - RSI divergence occurs when the price of an asset moves in one direction, while the Relative Strength Index (RSI) moves in the opposite direction, suggesting a potential trend reversal or weakening momentum. Essentially, it's when the price and the RSI are not in sync, hinting at a potential change in the market's direction.
Indicators - On the Daily timeframe,the stock is trading above its 11 day EMA and 22 day EMA,and RSI is at 60 suggesting positive bias.
CMP - Rs. 198.
Target - Rs. 235
SL - Rs. 190
Disclaimer: This is not a Buy/Sell recommendation. For educational purpose only. Kindly consult your financial advisor before entering a trade.
Trade ist aktiv
Gained 9% already since idea published. Performing as expected. Happy investing!!!Haftungsausschluss
Die Informationen und Veröffentlichungen sind nicht als Finanz-, Anlage-, Handels- oder andere Arten von Ratschlägen oder Empfehlungen gedacht, die von TradingView bereitgestellt oder gebilligt werden, und stellen diese nicht dar. Lesen Sie mehr in den Nutzungsbedingungen.
Haftungsausschluss
Die Informationen und Veröffentlichungen sind nicht als Finanz-, Anlage-, Handels- oder andere Arten von Ratschlägen oder Empfehlungen gedacht, die von TradingView bereitgestellt oder gebilligt werden, und stellen diese nicht dar. Lesen Sie mehr in den Nutzungsbedingungen.