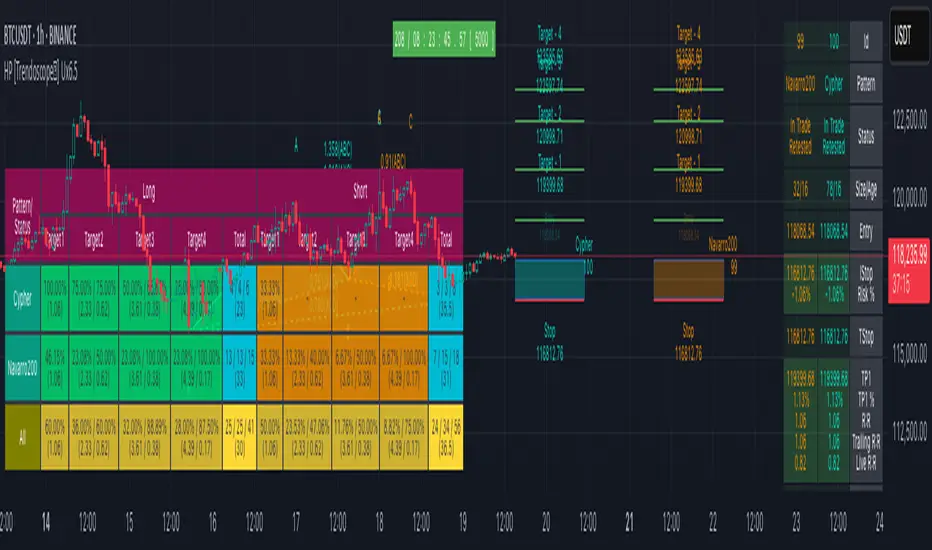
Band-Zigzag - TrendFollower Strategy [Trendoscope]Strategy Time!!!
Have built this on my earlier published indicator Band-Zigzag-Trend-Follower . This is just one possible implementation of strategy on Band-Based-Zigzag .
🎲 Notes
Experimental prototype. Not financial advise and strategy not guaranteed to make money despite backtest results
Not created or tested for any specific instrument or timeframe
Test and adopt with own risk
🎲 Strategy
This is trend following strategy built based on Bands and Zigzag. Traits of trend following strategies are
Lower win rate (Yes, thats right)
High risk reward (Compensates low win rate)
Higher drawdown
If market is choppy, trend following methods suffer.
The script implements few points to overcome the negatives such as lower win rate and higher drawdown by actively assessing pivots on the direction of trend along. This helps us take regular profits and exit on time during the end of trend. Most of the other concepts are defined and explained in indicator - Band-Zigzag-Trend-Follower and Band-Based-Zigzag
Defining a trend following method is simple. Basic rule of trend following is Buy High and Sell Low (Yes, you heard it right). To explain further - methodology involve finding an established trend which is flying high and join the trend with proper risk and optimal stop. Once you get into the trade, you will not exit unless there is change in the trend. Or in other words, the parameters which you used to define trend has reversed and the trend is not valid anymore.
🎯 Using bands
When price breaks out of upper bands (example, Bollinger Band , Keltener Channel, or Donchian Channel), with a pre determined length and multiplier, we can consider the trend to be bullish and similarly when price breaks down the lower band, we can consider the trend to be bearish .
🎯 Using Pivots
Simple logic using zigzag or pivot points is that when price starts making higher highs and higher lows, we can consider this as uptrend. And when price starts making lower highs and lower lows, we can consider this as downtrend. There are few supertrend implementations I have published in the past based on zigzags and pivot points .
Drawbacks of both of these methods is that there will be too many fluctuations in both cases unless we increase the reference length. And if we increase the reference length, we will have higher drawdown.
🎯 Band Based Zigzag Method
Here we use bands to define our pivot high and pivot low - this makes sure that we are identifying trend only on breakouts as pivots are only formed on breakouts
Our method also includes pivot ratio to cross over 1.0 to be able to consider it as trend. This means, we are waiting for price also to make new high high or lower low before making the decision on trend. But, this helps us ignore smaller pivot movements due to the usage of bands.
I have also implemented few tricks such as sticky bands (Bands will not contract unless there is breakout) and Adaptive Bands (Band will not expand unless price is moving in the direction of band). This makes the trend following method very robust.
To avoid fakeouts, we also use percentB of high/low in comparison with price retracement to define breakout.
🎲 Settings
Settings are fairly simpler and are explained as below. You will find most of the required information in tooltips.
Zig Zag-Indikator

Zig Zag Stochastic (ZZS)The "Zig Zag Stochastic" indicator is an indicator that uses a combination of zigzag pivot points and exponential smoothing to calculate a stochastic-like oscillator.
The indicator starts by identifying pivot high and pivot low points in the price data using the Zigzag indicator. These pivot points are then used to calculate the scale_price, which is a ratio of the current close price to the range between the current pivot high and pivot low.
Next, the scale_price is smoothed using exponential smoothing. The user can input the desired length of the smoothing period, with a default value of 14. If the user sets the smoothing length to 0, the indicator will automatically calculate the optimal smoothing length using the MAMA period calculation from the Dominant Cycle Estimators library.
The smoothed scale_price is then used to calculate two lines: the K-line and the D-line, both of which are also smoothed using exponential smoothing. The K-line is the main oscillator line and is similar to the %K line in a traditional stochastic oscillator. The D-line is a signal line, similar to the %D line in a traditional stochastic oscillator.
The indicator plots the smoothed scale_price, the K-line, and the D-line. Additionally, it includes horizontal lines at the 80 and 20 levels, and fills the area between them to help identify overbought and oversold conditions.

Band-Zigzag Based Trend FollowerWe defined new method to derive zigzag last month - which is called Channel-Based-Zigzag . This script is an example of one of the use case of this method.
🎲 Trend Following
Defining a trend following method is simple. Basic rule of trend following is Buy High and Sell Low (Yes, you heard it right). To explain further - methodology involve finding an established trend which is flying high and join the trend with proper risk and optimal stop. Once you get into the trade, you will not exit unless there is change in the trend. Or in other words, the parameters which you used to define trend has reversed and the trend is not valid anymore.
Few examples are:
🎯 Using bands
When price breaks out of upper bands (example, Bollinger Band, Keltener Channel, or Donchian Channel), with a pre determined length and multiplier, we can consider the trend to be bullish and similarly when price breaks down the lower band, we can consider the trend to be bearish.
Here are few examples where I have used bands for identifying trend
Band-Based-Supertrend
Donchian-Channel-Trend-Filter
🎯 Using Pivots
Simple logic using zigzag or pivot points is that when price starts making higher highs and higher lows, we can consider this as uptrend. And when price starts making lower highs and lower lows, we can consider this as downtrend. There are few supertrend implementations I have published in the past based on zigzags and pivot points.
Adoptive-Supertrend-Pivots
Zigzag-Supertrend
Drawbacks of both of these methods is that there will be too many fluctuations in both cases unless we increase the reference length. And if we increase the reference length, we will have higher drawdown.
🎲 Band Based Zigzag Method
Band Based Zigzag will help overcome these issues by combining both the methods.
Here we use bands to define our pivot high and pivot low - this makes sure that we are identifying trend only on breakouts as pivots are only formed on breakouts.
Our method also includes pivot ratio to cross over 1.0 to be able to consider it as trend. This means, we are waiting for price also to make new high high or lower low before making the decision on trend. But, this helps us ignore smaller pivot movements due to the usage of bands.
I have also implemented few tricks such as sticky bands (Bands will not contract unless there is breakout) and Adaptive Bands (Band will not expand unless price is moving in the direction of band). This makes the trend following method very robust.
To avoid fakeouts, we also use percentB of high/low in comparison with price retracement to define breakout.
🎲 The indicator
The output of indicator is simple and intuitive to understand.
🎯 Trend Criteria
Uptrend when last confirmed pivot is pivot high and has higher retracement ratio than PercentB of High. Else, considered as downtrend.
Downtrend when last confirmed pivot is pivot low and has higher retracement ratio than PercentB of High. Else, considered as uptrend.
🎯 Settings
Settings allow you to select the band type and parameters used for calculating zigzag and then trend. Also has few options to hide the display.

Multi-Timeframe MA Based Zigzag[liwei666]🎲 Overview
🎯 This Zigzag indicator build based on different MA such as EMA/HMA/RMA/SMA, support multi-timeframe setting .
you can get customer zigzag indicator by change short/long ma length and high-timeframe config(5m/15m/30m/1h/2h) in any symbol.
🎲 Indicator design logic
🎯 entired logic is simple and code looks complex, I‘ll explain core logic here, code already equipped with detailed comments.
1. use close-in EMA's highest/lowest value mark as SWING High/Low when EMA crossover/under, not use func ta.pivothigh()/ta.pivotlow()
2. when EMA crossover/under plot a char as signal like ●/❄/▲, crossover get blue char crossunder get red char
3. latest zigzag line is not drawn until EMA is turned (crossover/under), but signal is realtime
4. you can see diff zigzag structure when you open high-timeframe config, then find regular pattern benefit your trading.
🎲 Settings
🎯 there are 3 group properties in script, just focus on 5 properties in 'GRP1' ,
'GRP2' and 'GRP3' are display config.
'GRP1':
MA_Type: MA type you can choose(EMA/RMA/SMA/HMA/WMA), default is EMA
short_ma_len: short MA length of your current timeframe on chart
long_ma_len: long MA length of your current timeframe on chart
htf_ma_len: MA length of high timeframe, MA type same as 'MA_Type' config
htf_ma_tf: high timeframe ma length, 15/30/60/120 minute
'GRP2':
• show_short_zz • show_long_zz • show_htf_zz:
'GRP3':
• show_short_ma_line • show_short_ma_signal
• show_long_ma_line • show_long_ma_signal
• show_htf_ma_line • show_htf_ma_signal
🎲 Usage
🎯 As we know, MA based signal usually worked fine in trend market , low volatility is unprofitable.
🎯 One of pattern as the chart show below.
1. success example : after a blue ▲ signal, entry long when blue ● signal appear, marked with green box.
2. failed example: after a blue ▲ signal, a red ▼ signal appear, marked with white box.
🎯 BoS(Break of Structure) based on ma zigzag is a good idea I'm implementing, it will be published in next script.
Additionally, I plan to publish 20 profitable strategies in 2023; this indicatior not one of them,
let‘s witness it together!
Hope this indicator will be useful for you :)
enjoy! 🚀🚀🚀

Wolfe Strategy [Trendoscope]Hello Everyone,
Wish you all Merry X-Mas and happy new year. Lets start 2023 with fresh new strategy built on Wolfe Indicator. Details of the indicator can be found here
🎲 Wolfe Concept
Wolfe concept is simple. Whenever a wedge is formed, draw a line joining pivot 1 and 4 as shown in the chart below:
For simplicity, we will only consider static value for Target and Stop. But, entry is done based on breaking the triangle. Revised strategy looks something like this:
🎲 Settings
Settings are simple and details of each are provided via tooltips.
Out of these, the most important one is minimum risk reward ratio. If you set lower risk reward threshold then losing few trades may generate more losses than more winning trades. Similarly higher value will filter out most of the trades and may not work efficiently. Default value set to 1 to make sure optimal risk reward is present before placing trade. Also make note that since the entry bar is always moving towards stop, as and when pattern progress, the RR will also increase. Hence, a pattern which is below RR threshold may become good to trade at certain point of time in future.
🎲 Strategy Parameters
Default strategy parameters are initialised via definition. Margins are set to 100 to disable leveraged trades. Appropriate values are chosen for other parameters. These can be altered based on individual strategy and trading plan.
As the strategy concentrates on the single pattern, number of trades generated are comparatively less. But, there is chance to increase the algorithm further to catch more such patterns on larger scale. Will try to work on them in next versions.
🎲 Pine Strategy limitations
Backtest can only be done on one direction as pine strategy cannot have both long and short open trades together. Hence, it is mandatory to chose either long/short trades in settings.
Since pyramiding is limited to 1, there is possibility of a pattern not generating trade even though the entry conditions are met. They are just based on pine limitations and not necessarily mean patterns are not good for placing trades.

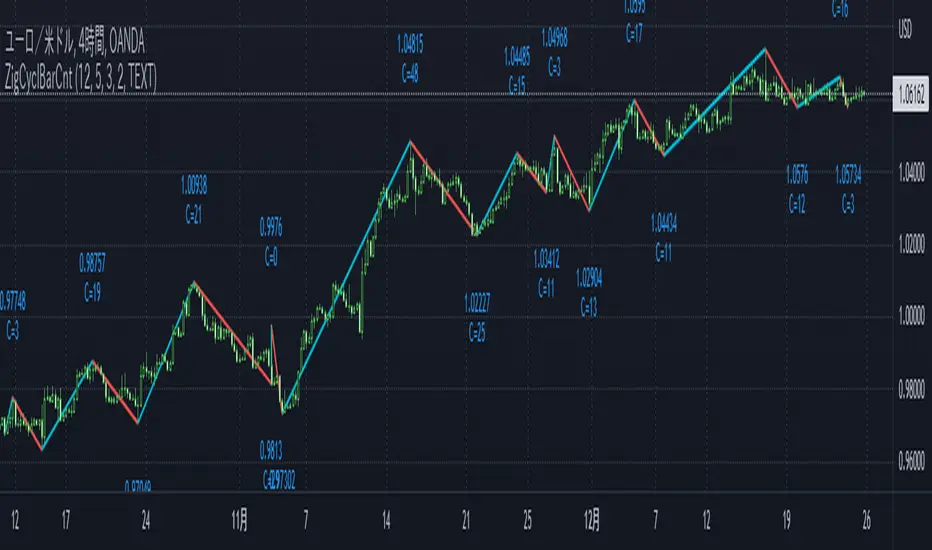
ZigCycleBarCount [MsF]Japanese below / 日本語説明は英文の後にあります。
Based on "ZigZag++" indicator by DevLucem. Thanks for the great indicator.
-------------------------
This indicator that displays the candle count (bar count) at the peaks of Zigzag .
It also displays the price of the peaks.
You can easily count candles (bars) from peak to peak. Helpful for candles (bars) in cycle theory.
This logic of the indicator is based from the mt4 zigzag indicator .
Parameter:
Depth = depth (price range)
Backstep = Period
Deviation = Percentage of how much the price has wrapped around the previous line.
Example:
Depth = 12
Backstep = 3
Deviation = 5
In this case, the price range is updated by 12 pips or more (Depth), and after 3 or more candlesticks line up (Backstep), if the price deviates from the previous line by 5% or more (Deviation), a peak is added.
-------------------------
Zigzagの頂点にローソクカウント(バーカウント)を表示するインジケータです。
頂点の価格も表示します。
頂点から頂点までのローソク(バー)を容易にカウントすることができます。
サイクル理論のローソク(バー)に役立ちます。
Zigzagロジック自体はMT4のzigzagインジケータを流用しています。
<パラメータ>
Depth=深さ(値幅)
Backstep=期間
Deviation=価格がどれだけ直前のラインの折り返したかの割合
例:
Depth=12
Backstep=3
Deviation=5
この場合、値幅を12pips以上更新し(Depth)、ローソク足が3本以上並んだ後(Backstep)、価格が直前のラインの5%以上折り返せば(Deviation)、頂点を付けます。
<表示オプション>
Label_Style = "TEXT"…テキスト表示、"BALLOON"…吹き出し表示
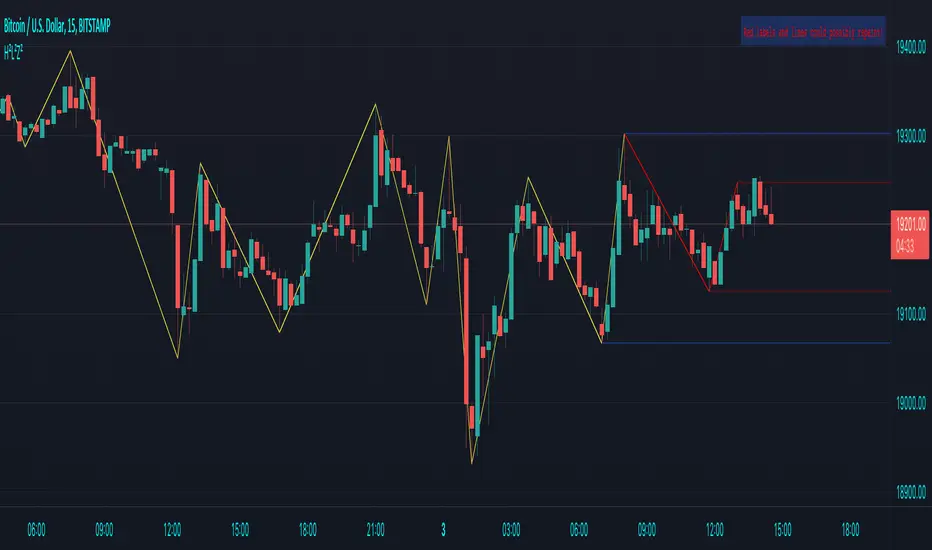
Theory Affinity TrendlinesThis indicator is perfect for traders who want to identify trend lines on a chart. It draws higher low uptrends and lower high downtrends, making it easy to see where the trend is going. You can also customize the settings to fit your needs, making it the perfect tool for your trading arsenal.
With this new tool, you can easily customize your experience to get the most out of your trading and analysis. With options like max lines, strength multiplier, pivot plots/text, and more, you can easily create the perfect trading analysis environment.
So why wait? Try it out today!
Leave feedback and let me know what you think.
// ############################################################################################## Input Descriptions
Pivot Left ----------------- look left n bars
Pivot Right ---------------- look right n bars
Strength ------------------- Pivot multiplier (Higher = Wider Trend lines)
Max Lines ------------------ Number of lines for each Uptrend and Downtrend
Structure Text ------------ Show HH, LL, etc. on chart
Structure Markers -------- Dots at the Pivot Highs and Lows
Plots ------------------------ Draw a line at Pivot Highs and Lows
Last Up Width ------------- Width of the current Uptrend line
Historical Up Width ------ Width of previous Uptrend lines
Last Down Width --------- Width of the current Downtrend lines
Historical Down Width --- Width of previous Downtrend lines
Line Offset ---------------- Shift trend lines right or left
* Lines may or may not "repaint". For use to identify trends that are more than likely already established and to identify trend line breaks.

Custom "ZickZack" for price lines|Tradingview wants a Description|
The Indicator Helps with finding:
- higher highs
- lower highs
- lower lows
- higher lows
- trends
It also shows with a triangle what candle confirmed the Pivot points
And it just looks fancy (my opinion)

Next Pivot Projection [Trendoscope]Still experimental. Extending further on the divergence backtest results - in this script we try to project next 2 pivots (including one unconfirmed pivot)
🎲 Previous experiments
1. Divergence-Backtester
2. Divergence-Backtester-V2
🎲 Additions
Apart from collecting the stats on number of occurrences of HH, HL, LH, LL - this script also keeps track of average ratio for each levels and average bars.
Based on these data, we try to calculate the next pivot projections including possible bar and price.
Cloud covering the candles indicate historical levels of average HH, HL, LH, LL projections.
Hover on projection labels to find more details in tooltips.
🎲 Overall method in a nutshell
🎲 Going bit deeper
🎯 Unconfirmed Pivot and its projection - Last pivot of the zigzag is always unconfirmed. Meaning, it can potentially repaint based on further price movements. But, projection of the unconfirmed pivot will not change as it will be based on previous two pivots - both of which are confirmed.
🎯 Next Pivot Projection - Next pivot is projected based on last two pivots - which include last unconfirmed pivot. Hence, these projections can potentially repaint based on the last pivot repaint.
🎯 Historical projections displayed as cloud - Historical projection values are displayed as cloud around pivots.
A cloud above represents area from average lower high range to average higher high range. Cloud color is green if average ratio of pivot high is more than 1. Red Otherwise.
A cloud below represents area from average higher low range to average lower low range. Cloud color is red if average ratio of pivot high is more than 1. Green otherwise

_D4X_Fractal StructureThis script will show up to three different timeframe structure based on fractal formation (combination of three candles where the middle one is the highest).
You can modify each of the timeframes (called factors in the script). These factors emulate the fractal formations on the timeframe specified (in minutes). I found that at least for me a combination of 1-10-100 works well if you use the 1 minute timeframe, but you can try different combinations to see long term structures o more short term structures.
There are a couple of things I would like to add later on, for example, to select dots instead of lines to show structure or adding orderblocks based on the fractal formations (as this would emulate higher timeframe OBs). As soon as I can, I will add these.
Let me know if you like it!!!

Divergence Backtester - V2Further attempts to study divergence impact on price in shorter terms.
Previous study can be found here:
In this script, we are trying to gather the stats based on last two pivot state together. For example, Individual table of Pivot High Projection is as explained below:
But, by looking at the bigger picture, we can further estimate following things regarding the current unconfirmed pivot and the new pivot which is yet to be formed.

Divergence BacktesterThere is n number of possible ways in which we can backtest divergence and this is just a start :)
In this script, we are trying to count how many times the pivots made HH, HL, LH, LL after a particular divergence state.
An example of using data is as below:
The script keeps track of each pivot sentiment and resulting next pivot state. As mentioned in the chart snapshot, we can look at two of the previous pivot states and collect stats on how each of these state impacted price action.
As mentioned before, this is just tip of iceberg. Further combinations for which we can do backtest are:
1. m X n combinations of last pivot and last to last pivot divergence state
2. divergence combined with double divergence state.
Only issue to explore further is lack of space on the chart as tables can take up huge space.
PS: As you can see based on historical stats, probability of divergence impacting the change of trend is very low in most cases.

HH-LL ZZAnother ZigZag, yes...
I believe though this concerns another angle/principle, therefore I wanted to share
How does it work?
Given:
source for level breach -> close
X breaches -> 3
Let's say this is the latest found 'lower low' (LL - blue dot under bar):
This bar has been triggered because 3 bars closed under low of previous 'trigger bar' (TB )
The high and low of this new TB will act as triggers
(aqua blue lines, seen in image above)
Then there are 2 options:
- again 3 bars closes under the latest TB , in that case the TB moves to that new LL.
- 3 bars closes higher than the high of previous TB
The high and low of this new TB act again as trigger
If a new TB LL/HH is found, the script checks previous LL/HH
and searches the highest/lowest point in between.
If necessary, the temporary highest/lowest will be adjusted:
Another example:
The last 2 points can change (repaint).
Yellow coloured lines/labels are set and won't change anymore.
Concluded:
In case of these settings:
source for level breach -> close
X breaches -> 3
once a new TB is found, the high and low act as trigger lines
- when 3 bars closes under that low , a new LL is found, this will be the new TB
- when 3 bars closes above that high , a new HH is found, this will be the new TB
and so on...
Settings:
source for level breach -> close or high/low - H/L
X breaches -> 1 -> 10
line style -> solid, dotted, dashed
show level breaches -> new found TB (blue/lime coloured)
show Support/Resistance (lines at the right)
repaint warning can be removed
show labels / lines
This ZZ can be used for Harmonic patterns, Trend evaluation, support/resistance,...
In this script, I also used new features
- text_font_family = font.family_monospace -> link
- display=display.pane -> link
Cheers!
Micro ZigzagMicro zigzag is created based on similar concepts as that of zigzag but by using lower timeframe intra-bar data. The lines join candle's high/low points but also depict how the price movement within the candle happened. That is, if the high of the candle is reached first, pivot from previous candle join the high first and then low and vice versa.
The output can also be viewed as advanced line chart.
🎲 Process
🎯 For every bar identify whether high came first or low by using lower timeframe data.
🎯 If high came before low, add high as high pivot first and then low as low pivot. If otherwise, add low as lower pivot first and then high as higher pivot.
🎯 When adding pivot, check if the last pivot is in the same direction as the new one. If yes, replace existing pivot if the new one goes beyond it. Ignore otherwise.
🎯 If the last pivot is of different direction as that one new one, then simple add the new pivot.

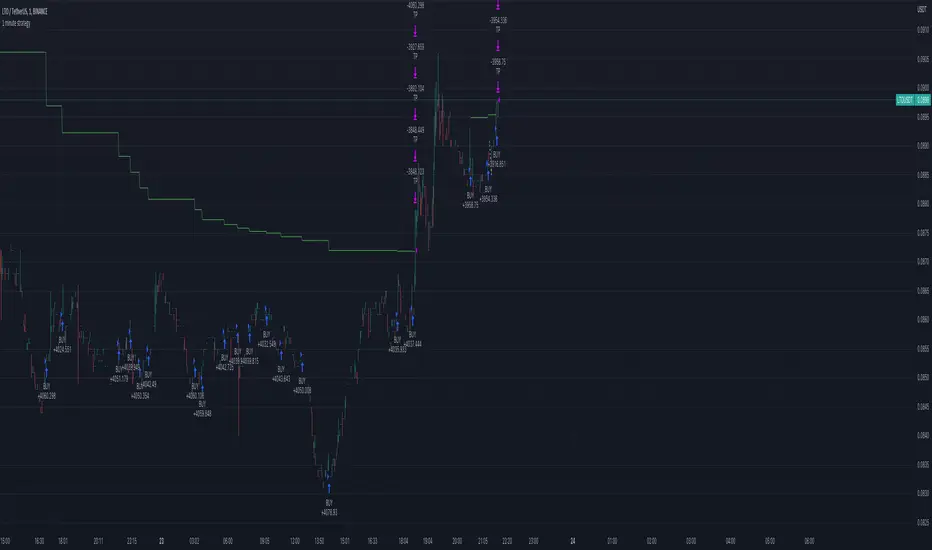
1 minute crypto strategy (MTF ZigZag)Please read the following explanation and notes before using this strategy.
This strategy is based on pyramiding. It uses two trend indicators(zigzag) in two different timeframes. One can be used to identify trend in higher timeframe and the other can be used to identify trend in smaller time frame. You can change them according to your preference. The default timeframes are set the same so the strategy only opens the trades according to one timeframe (20min). You can change the timeframe of the trend indicators to any timeframe in the settings but first you should add that timeframe to your chart timeframe so you can see that timeframe in the settings.
The first timeframe is for lower timeframe trend identification and the second timeframe is for higher timeframe identification in the settings.
IMPORTANT NOTES:
1. This strategy works best with low cap high volatile Cryptos. It is riskier on big cap cryptos in long term since it takes longer for them to recover from a big drop.
2. This strategy works in any timeframe. The lower the TF the higher profit.
3. This strategy is LONG only (spot).
4. It is very important to run a deep backtest (for example 1 year) and change the settings accordingly on the cryptos you want to trade to see how it performs in longterm.
5. The default pyramiding value is 30 and 3.33% of the portfolio (100/30=3.33%) is used for each trade. It means the strategy opens maximum 30 trades before the TP is hit. If you change the pyramiding you should also change order size as well in order for the strategy to show the exact calculation (your portfolio amount percentage/pyramiding value=ordersize percentage). If you increase pyramiding value the strategy performs safer in long term.
6. The default TP is 1% and the default SL is 80%. You can change the settings according to the backtest on the coins you want to trade. But it is better not to increase the TP.
7. The indicators don't repaint.
8. Please make sure to backtest and fully understand the way this strategy works before using it.
Structured zigzag support&resistance [LM]Hello Traders,
I would like to introduce you Structured zigzag support&resistance. It is based on the ZigZag semafor script made by DevLucem so shout out to him
The indicator is used to spot future multi-level Supports and Resistance zones. It is also useful to spot HL or LL or HH or LH zones
I's the same zigzag indicator as my other zigzag indicator with highlight on diagonal lines(highs and lows are automatically classified and also new types of diagonal lines that connects low or highs and extends to right are drawn )
It has two settings:
Fist is to control horizontal lines and zigzag setting
Second is to control diagonal lines
I hope you will enjoy it as I enjoyed to write it.
Lukas

RSI Divergence Scanner by zdmreDivergence is when the price of an asset is moving in the opposite direction of a technical indicator, such as an oscillator, or is moving contrary to other data. Divergence warns that the current price trend may be weakening, and in some cases may lead to the price changing direction.
If the stock is rising and making new highs, ideally the RSI is reaching new highs as well. If the stock is making new highs, but the RSI starts making lower highs, this warns the price uptrend may be weakening. This is negative divergence.
Positive divergence is the opposite situation. Imagine the price of a stock is making new lows while the RSI makes higher lows with each swing in the stock price. Investors may conclude that the lower lows in the stock price are losing their downward momentum and a trend reversal may soon follow.
Divergence is one of the common uses of many technical indicators, primarily the oscillators.
Use it at your own risk

Support and Resistance Multiperiod (Zig Zag Based)Support and Resistance Multiperiod (Zig Zag Based)
What is the indicator?
• The indicator is a multi period (up to 5 lengths) Support and Resistance indicator calculated based on Zig Zag.
Who can use?
Scalpers to Long term investors
What timeframe to use?
• Any timeframe
What are the lines?
• Green lines are Support levels.
• Orange lines are Resistance levels.
How to use?
• Buy Low and Sell High.
• Brighter zones means strong Support or Resistance.
• Weaker zones appear lighter.
• Brighter zones are formed by overlapping of lines from multiple levels of support or resistance.
Indicator Menu
• The indicator can input 5 different Lengths.
• The default settings uses 13, 21, 52, 100 & 200.
• Every option are customizable.

Recursive ZigzagDO NOT USE THIS FOR TRADING. I am just showing off my new found recipe for pattern recognition ;)
This script generates recursive zigzags till there are only 2 pivots. So, the logic goes like this.
Level1 - Standard zigzag calculated from user input of length and max pivots using OHLC values
Level2 - Multi level zigzag calculated on the basis of level1 pivots.
Level3 - Multi level zigzag calculated on the basis of level2 pivots
..
..
..
Level(n) - Multi level zigzag calculated on the basis of level(n-1) pivots and number of derived pivots is 3 or less.
Ability to generate multi level zigzags were explored earlier in many scripts. But, they were just single level up from base and not fully recursive as this. This can be powerful piece of code for pattern recognition algorithms - will be exploring how useful these are going forward.

NhaDuHanhFX - Gann SwingsThe swings indicator follows the smallest movements of price action. Can monitor and analyze the context of the market, trying to find bias of each timeframe.
If there is a candlestick completely above the previous swinghigh. It shows a good bullish momentum. The market is favoring the upward direction. If the candlestick is still in the previous swinghigh range, it shows a weak bullish momentum. The market is reluctant to go up.
If there is a candlestick completely below the previous swinglow. It presents a good bearish momentum. The market is favoring the downward direction. If the candlestick is still in the previous swinglow range, it shows a weak bearish momentum. The market is reluctant to go down.

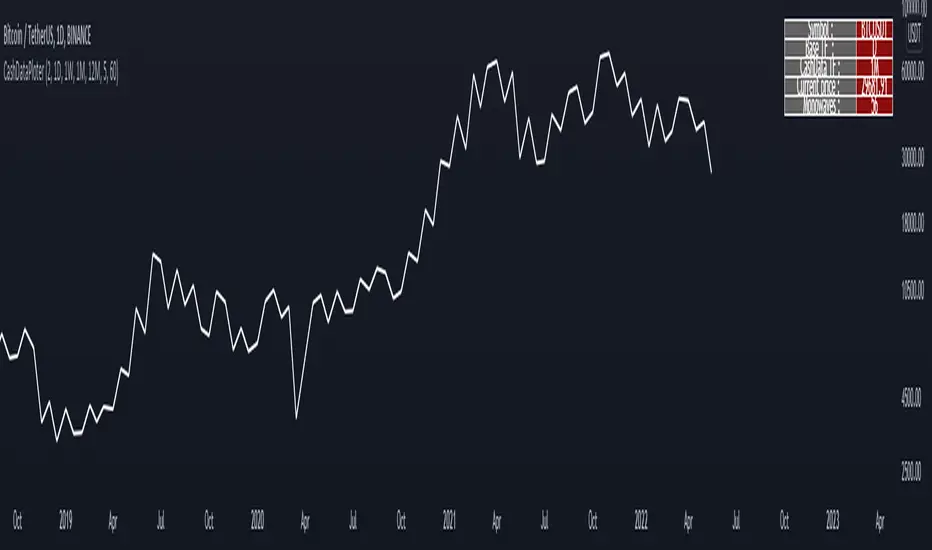
CashDataPloter Tihs indicator is able to draw cash data for :
• Annual timeframe
• Monthly, 3month, 6 month timeframe
• weekly, 2 week timeframe
• daily, 2 day, 3 day timeframe
• 6 hour, 12 hour timeframe
• 4 hour, 8 hour timeframe
• 1 hour, 2 hour, 3 hour timeframe
• 5 minute, 10 minute, 15 minute, 30 minute timeframe
other options :
• displaying information table of cash data
• choosing of cash data thickness
• choosing of bulish Monowaves color
• choosing of bearish Monowaves color
• choosing of connecting Monowaves color
[_ParkF]ZIGZAGThis is to find MDRP by overlaying the low and high prices of the current trend on the chart.
ZIGZAG labels near supports and resistances of 1, 2, 3 and 4 can increase the reliability of the MDRP.
The default value of live in the input menu is true, but if it is false, the closing price is checked and drawn.
Reduce false signals.
현재 트렌드의 저가와 고가를 차트에 표시하여 MDRP를 찾기 위한 것으로
1, 2, 3, 4의 지지와 저항 부근에서의 ZIGZAG 라벨은 MDRP의 신뢰도를 높혀줄 수 있습니다.
input 메뉴에서의 live 기본값은 체크되어 있지만 체크를 해제하면 종가를 확인하고 그려지기에
거짓 신호를 줄일 수 있습니다.

Auto Harmonic Pattern - UltimateX [Trendoscope]IMPORTANT NOTE: (Read this before looking at any other thing on this indicator)
This indicator is created to supersede existing Auto-Harmonic-Pattern-Ultimate-Trendoscope invite only script. The script deviates a lot from the original Auto Harmonic Patterns Ultimate script in terms of number of available patterns, trading type and few other things. Hence, instead of updating the existing script, we have just decided to release as new script. Few FAQs in this regard are as below
What it means for users of AHPU and new users?
▶ Subscription of this script is not sold separately, but will be offered along with existing AHPU script. Meaning, there will be single subscription for both scripts together.
▶ All existing subscribers of AHPU will also get access to this script for the duration of their subscription term. Will start adding access to users starting from lifetime subscribers first.
▶ Any new subscriptions to AHPU will also get access to both the scripts together. We will eventually look to phase out existing AHPU once users are accustomed to new script and any possible bugs are resolved.
▶ Any trial requests will also get access to both scripts. You can request trial even if you have recently requested trial for AHPU.
Why did we create new script instead of updating the existing one?
▶ As mentioned before, this script deviates a lot from the original AHPU. Hence, it is released as new version to make sure smoother transition of users. If anyone is not comfortable using the new version, they can continue using the existing AHPU script until things settle down.
▶ Since the script is new implementation, it may also have initial bugs. It will help us resolve it in more streamlined way.
What are the main differences between these scripts?
▶ Uses single zigzag instead of multi as algorithm is further improved to detect almost everything using single zigzag.
▶ More number of patterns added. But, new patterns are disabled by default as some of them have very wide PRZ. Users can enable it via settings.
▶ Trading type with trailing entry - With wide PRZs, we also had to implement different method for calculating entry/stop. This is explained later in the script.
▶ Matrix implementation and enhanced stats - Entire implementation is redesigned to use matrix data structure instead of arrays. This allows lots of possibilities including enhanced closed trade stats.
▶ Support/Resistance widget is removed as it is proving to be bit of overhead. Users can make use of Support Resistance widget script which is a free to use script instead.
Let's get to the details of indicator now.
🎲 Indicator Components
🎯 Patterns Covered
● Classic Patterns
Gartley
Bat
Butterfly
Crab
Deep Crab
Cypher
Shark
Nenstar
● Anti/Alternate Patterns
Anti Nenstar
Anti Shark
Anti Cypher
Anti Crab
Anti Butterfly
Anti Bat
Anti Gartley
Navarro200
● Non-Standard Patterns (Disabled by default)
Five Zero
Three Drives
White Swan
Black Swan
Sea Pony
Leonardo
121
Snorm
Total
Below is a quick snapshot of indicator components.
Now, lets look at some of the individual components:
🎯 Open trade stats helps recognise trades in motion.
Apart from regular stats, it also contain different types of risk reward ratios.
Regular RR : RR calculated from entry to reach target with initial stop for risk consideration
Trailing RR : This is RR calculated for price to reach from one target to next target considering trailing stop for calculating risk
Live RR : This is calculated based on current price as entry and with given targets and stop levels. Live RR will be blank for targets which are already reached.
Targets are calculated only when entry is made. Hence, target details are not shown for patterns where it is still awaiting entry.
🎯 Closed trade stats helps understand historical performance of patterns.
By default closed stats are displayed in Compact mode. Which means, only total stats are shown. But, users can change this to show detailed stats via settings. Detailed stats take up entire screen most of the time. So, keep them only if it is required.
Closed stats present average Risk Reward, Trailing Risk Reward, Average Win Rate, and Average Trailing Win Rate for all the possible levels. As discussed before.
Regular RR : RR calculated from entry to reach target with initial stop for risk consideration
Trailing RR : This is RR calculated for price to reach from one target to next target considering trailing stop for calculating risk
Win Rate : Simple win rate calculation based on number of patterns reached target and number of valid patterns.
Trailing Win Rate : This is win rate calculated based on previous target to current target.
For example, if there are 48 valid patterns and out of which 24 patterns reach target1 and 12 patterns out of 24 reach target 2
Target1 WR : 50% (24/48)
Target1 TWR : Not applicable as there is no target before Target1
Target2 WR : 25% (12/48)
Target2 TWR : 50% (12/24)
🎲 Settings
Tooltips are provided to help with each and every settings. And they are as below.
🎲 Fully Customisable Alerts - Placeholders
Alerts are created via alert() method of pine. Hence, users will not see message box for alert template on alert widget.
Instead alerts widget look something like this:
To overcome this issue, script provides alert template placeholders as part of settings. In settings, you can already see Alert section where you can enable/disable alerts for different events.
▶ New Pattern Detection
▶ Entry Reached
▶ Target1-4 Reached
▶ Stop price reached
▶ Trade Complete - either by stop or reaching target 4
You can use following placeholders in the given text boxes to create your own alert template.
🎯 Common placeholders which are applicable for all alerts
{type} - Alert Type
- New Harmonic Pattern
- Harmonic Pattern Status Update
- Harmonic Pattern Trade Closure
{id} - Pattern Id. This is not fully unique id. But, this will be unique for all open trades. Once trade is closed, Ids are reused whenever feasible.
{ticker} - Ticker information
{timeframe} - Timeframe information
{price} - Current close price
{patterns} - Possible patterns for the projections or PRZ.
{direction} - Trade direction - Bullish or bearish
{entry} - Calculated entry for pattern
{stop} - Calculated stop for pattern
{tstop} - Trailing stop for the pattern in trade
{target1} - Target1 for pattern in trade
{target2} - Target2 for pattern in trade
{target3} - Target3 for pattern in trade
{target4} - Target4 for pattern in trade
🎯 There are few specific placeholders, which are applicable for some alert types.
Harmonic Pattern Status Update
{status} - Status of the Pattern in trade
{laststatus} - Previous status of the Pattern in trade
Harmonic Pattern Trade Closure
{result} - Trade result upon closure
Bezahltes Script