Absolute ZigZagThis ZigZag Indicator is a bit unique in it's kind.
It uses my own Absolute ZigZag Lib to calculate the pivots:
Instead of using percentages or looking more than 1 bar left or right, this Zigzag library calculates pivots by just looking at the current bar highs and lows and the ones of one bar earlier. This is a very fast and accurate way of calculating pivots.
The library also features a solution for bars that have both a higher high and a higher low like seen below.
You can also use your own colors for the labels and the lines:
You can also quickly select a one-colored theme without changing all colors at once:
Zig Zag-Indikator

Dow Theory based Strategy (Markttechnik)What makes this script unique?
calculates two trends at the same time: a big one for the overall strong trend - and a small one to trigger a trade after a small correction within the big trend
only if both trends (the small and the big trend) are in an uptrend, a buy signal is created: this prevents a buy signal from being generated in a falling market just because an upward movement begins in a small trend
the exit strategy can be configured very flexibly and individually: use the last low as stop loss and automatically switch to a trialing stop loss as soon as the take profit is reached (instead of finishing the trade)
the take profit strategy can also be configured - e.g. use the last high, a fixed percentage or a combination of it
plots each trade in detail on the chart - e.g. inner candles or the exact progression of the stop loss over the entire duration of the trade to allow you to analyze each trade precisely
What does the script do and how?
In this strategy an intact upward trend is characterized by higher highs and lower lows only if the big trend and the small trend are in an upward trend at the same time.
The following describes how the script calculates a buy signal. Every step is drawn to the chart immediately - see example chart above:
1. the stock rises in the big trend - i.e. in a longer time frame
2. a correction takes place (the share price falls) - but does not create a new low
3. the stock rises again in the big trend and creates a new high
From now on, the big trend is in an intact upward trend (until it falls below its last low).
This is drawn to the chart as 3 bold green zigzag lines.
But we do not buy right now! Instead, we want to wait for a correction in the big trend and for the start of a small upward trend.
4. a correction takes place (not below the low from 2.)
Now, the script also starts to calculate the small trend:
5. the stock rises in the small trend - i.e. in a shorter time frame
6. a small correction takes place (not below the low from 4.)
7. the stock rises above the high from 5.: a new high in the shorter time frame
Now, both trends are in an intact upward trend.
A buy signal is created and both the minor and major trend are colored green on the chart.
Now, the trade is active and:
the stop loss is calculated and drawn for each candle
the take profit is calculated and drawn to the chart
as soon as the price reaches the take profit or the stop loss, the trade is closed
Features and functionalities
Uptrend : An intact upward trend is characterized by higher highs and lower lows. Uptrends are shown in green on the chart.
The beginning of an uptrend is numbered 1, each subsequent high is numbered 2, and each low is numbered 3.
Downtrend: An intact downtrend is characterized by lower highs and lower lows. Downtrends are displayed in red on the chart.
Note that our indicator does not show the numbering of the points of the downtrend.
Trendless phases: If there is no intact trend, we are in a trendless phase. Trendless phases are shown in blue on the chart.
This occurs after an uptrend, when a lower low or a lower high is formed. Or after a downtrend, when a higher low or a higher high is formed.
Buy signals
A buy signal is generated as soon as a new upward trend has been formed or a new high has been established in an intact upward trend.
But even before a buy signal is generated, this strategy anticipates a possible emerging trend and draws the next possible trading opportunity to the chart.
In addition to the (not yet reached) buy price, the risk-reward ratio, the StopLoss and the TakeProfit price is shown.
With this information, you can already enter a StopBuy order, which is thus triggered directly with the then created buy signal.
You can configure, if a buy signal shall be created while the big trend is an uptrend, a downtrend and/or trendless.
Exit strategy
With this strategy, you have multiple possibilities to close your position. All of them can be configured within the settings. In general, you can combine a take profit strategy with a stop loss strategy.
The take profit price will be calculated once for each trade. It will be drawn to the chart for active trade.
Depending on your configuration, this can be the last high (which is often a resistance level), a fixed percentage added to the buy price or the maximum of both.
You can also configure that a trailing stop loss is used as soon as the take profit price is reached once.
The stop loss gets recalculated with each candle and is displayed and plotted for each active and finished trade. With this, you can easily check how the stop loss changed during your trades.
The stop loss can be configured flexibly:
Use the classic "trailing stop loss" that follows the price from below.
Set the stop loss to the last low and tighten it every time the small trend marks a new local low.
Confiure that the stop loss is tightened as soon as the break even is reached. Nothing is more annoying than a trade turning from a win to a loss.
Ignore inside candles (see description below) and relax the stop loss to use the outside candle for its calculation.
Inner candles
Inner candles are created when the candle body is within the maximum values of a previous candle (the outer candle). There can be any number of consecutive inner candles. As soon as you have activated the "Check inner candles" setting, all consecutive inner candles will be highlighted in yellow on the chart.
Prices during an inner candle scenario might be irrelevant for trading and can be interpreted as fluctuations within the outside candle. For this reason, the trailing stop loss should not be aligned with inner candles. Therefore, as soon as an inner candle occurs, the stop loss is reset and the low at the time of the outside candle is used as the calculation for the trailing stop loss. This will all be plotted for you on the chart.
Display of the trades:
All active and closed trades of the last 5 years are displayed in the chart with buy signal, sell, stop loss history, inside candles and statistics.
Backtesting:
The strategy can be simulated for each stock over the period of the last 5 years. Each individual trade is recorded and can be traced and analyzed in the chart including stop loss history. Detailed evaluations and statistics are available to evaluate the performance of the strategy.
Additional Statistics
This strategy immediately displays a statistic table to the chart area giving you an overview of its performance over the last years for the given chart.
This includes:
The total win/loss in $ and %
The win/loss per year in %
The active investment time in days and % (e.g. invested 10 of 100 trading days -> 10%)
The total win/loss in %, extrapolated to 100% equity usage: Only with this value can strategies really be compared. Because you are not invested between the trades and could invest in other stocks during this time. This value indicates how much profit you would have made if you had been invested 100% of the time - or to put it another way - if you had been invested 100% of the time in stocks with exactly the same performance. Let's say you had only one trade in the last 5 years that lasted, say, only one month and made 5% profit. This would be significantly better than a strategy with which you were invested for, say, 5 years and made 10% profit.
The total profit/loss per year in %, extrapolated to 100% equity usage
Notifications (alerts):
Get alerted before a new buy signal emerges to create an order if necessary and not miss a trade. You can also be notified when the stop loss needs to be adjusted. The notification can be done in different ways, e.g. by Mail, PopUp or App-Notification. This saves them the annoying, time-consuming and error-prone "click through" all the charts.
Settings: Display Settings
With these settings, you have the possibility to:
Show the small or the big trend as a background color
Configure if the numbers (1-2-3-2-3) shall be shown at all or only for the small, the big trend or both
Settings: Trend calculation - fine tuning
Drawing trend lines on a chart is not an exact science. Some highs and lows are not very clear or significant. And so it will always happen that 2 different people would draw different trendlines for the same chart. Unfortunately, there is no exact "right" or "wrong" here.
With the options under "Trend Calculation - Fine Tuning" you have the possibility to influence the drawing in of trends and to adapt it to your personal taste.
Small Trend, Big Trend : With these settings you can influence how significant a high or low has to be to recognize them as an independent high or low. The larger the values, the more significant a high or low must be to be recognized as such.
High and low recognition : With this setting you can influence when two adjacent, almost identical highs or lows should be recognized as independent highs or lows. The higher the value, the more different "similar" highs or lows must be in order to be recognized as such.
Which default settings were selected and why
Show Trades: true - its often useful to see all recent trades in the chart
Time Frame: 1 day - most common time frame (except for day traders)
Take Profit: combined 10% - the last high is taken as take profit because the trend often changes there, but only if there is at least 10% profit to ensure we do not risk money for a tiny profit
Stop Loss: combined - the last low is used as stop loss because the trend would break there and switch to a trailing stop loss as soon as our take profit is reached to let our profits run without risking them anymore
Stop Loss distance: 3% - we are giving the price 3% air (below the last low) to avoid being stopped out due to a short price drop
Trailing Stop Loss: 2% - we have to give the stop loss some room to avoid being stopped out prematurely; this is a value that is well balanced between a certain downside distance and the profit-taking ratio
Set Stop Loss to break even: true, 2% - once we reached the break even, it is a common practice to not risk our money anymore, the value is set to the same value as the trailing stop loss
Trade Filter: Uptrend - we only start trades if the big trend is an uptrend in the expectation that it will continue after a small correction
Display settings: those will not influence the trades, feel free to change them to your needs
Trend calculation - Fine Tuning: 1/1,5/0,05; influences the internal calculation for highs and lows and how significant they need to be to be considered a new high or low; the default values will provide you nicely calculated trends in the daily time frame; if there are too many or too few lows and highs according to your taste, feel free to play around and immediately see the result drawn to the chart; read the manual for a detailed description of this values
Note that you can (and should) configure the general trading properties like your initial capital, order size, slippage and commission.

ABCD Projection [Trendoscope®]Over the years, we have extensively explored and published numerous scripts centered around various chart patterns, including Harmonic Patterns, Reversal Patterns, Elliott Waves, and more. Our expertise in these areas has led to frequent requests for an indicator based on the ABCD pattern. Although we didn't include it as part of our Harmonic Patterns collection, the development of a dedicated ABCD Projection Indicator has always been a priority for us.
🎲 Overview of the ABCD Projection Indicator
The ABCD Projection Indicator is designed to identify and project ABCD patterns using a Zigzag-based approach. This pattern, characterized by alternating pivot highs and lows labeled as A, B, C, and D, is particularly significant in trending markets where it signifies trend continuation following deep pullbacks.
The indicator works by confirming the ABC pivots and projecting the D pivot based on the established price swings. Since ABCD patterns are most effective in trending environments, the indicator focuses on filtering patterns where the retracement from the C pivot has not compromised the trade's potential. Specifically, it ensures that the starting point (S)—where the pattern is detected—has not retraced beyond a defined threshold, preserving the opportunity to execute a trade with the goal of reaching the projected D pivot.
Additionally, the ABCD Projection Indicator considers the retracement ratio from the C pivot, which plays a crucial role in risk management. A higher retracement ratio reduces the stop distance (from pivot A to the entry point S) while increasing the distance to the target (pivot D), thereby enhancing the reward/risk ratio for trades.
🎲 Components of the ABCD Projection Indicator
The ABCD Projection Indicator comprises several key components:
A, B, C Pivots and Zigzag Wave : These elements form the foundational structure of the ABCD pattern.
S Point : This is the location where the pattern is identified, positioned a few bars away from the confirmed C pivot.
Estimated D Pivot : The D pivot is projected based on the A, B, and C price levels. The time or distance to the D pivot is influenced by the starting point S.
Mini Stats Table : Located in the top right corner, this table displays win/loss ratios and risk/reward data for both bullish and bearish scenarios.
Fibonacci Levels : Calculated from the C to D pivots, these levels are provided as a reference for additional analysis.
🎲 Indicator Settings
The settings for the ABCD Projection Indicator are minimal and intuitive, with tooltips provided to guide users through the configuration process.

MTF Candle Multi HubMTF Candle Multi Hub Indicator - Guide 日本語解説は下記
Introduction
The "MTF Candle Multi Hub" indicator is a versatile and comprehensive tool designed to visualize multiple timeframes' candlestick data, Heikin Ashi candles, and moving averages on a single chart. This indicator also includes a Zigzag feature with the ability to draw horizontal lines at significant swing points, making it a powerful tool for technical analysis.
Key Features
Multi-Timeframe Candlestick Display:
The indicator allows you to display candlesticks from different timeframes, including 5-minute, 15-minute, 1-hour, 4-hour, daily, and weekly timeframes.
Each timeframe's candlestick can be toggled on or off using the settings panel.
Candlesticks are color-coded based on whether the close is higher or lower than the open, with customizable colors for bullish and bearish candles.
Heikin Ashi Candlesticks:
Heikin Ashi candlesticks are also available for 5-minute, 15-minute, 1-hour, 4-hour, daily, and weekly timeframes.
Like the standard candlesticks, these can be toggled on or off, and their colors are customizable.
Moving Averages (MA):
The indicator supports up to four different moving averages, which can be either Simple Moving Average (SMA) or Exponential Moving Average (EMA).
The user can toggle each moving average on or off and adjust the period and type from the settings panel.
An additional feature allows the space between two moving averages to be filled with a color, indicating the relative position of the MAs.
Zigzag Indicator with Horizontal Lines:
The Zigzag feature plots lines between significant swing highs and lows, helping identify trends and potential reversal points.
Two Zigzag lines can be configured, each with customizable swing length, line color, style, and width.
The indicator also offers the ability to draw horizontal lines at the start and end of each Zigzag swing. These horizontal lines can be customized in terms of color, style, width, and length.
The number of horizontal lines to be drawn can be set, allowing for focused analysis of the most recent swings.
Label and Comment Display:
The indicator provides the option to display custom labels and comments on the chart.
You can enter up to ten different comments, which will be displayed in a label at the last candlestick of the chart.
The label's position, background color, text color, and text size are fully customizable.
Trading Strategy
Trend Following with Multi-Timeframe Analysis:
Use the multi-timeframe candlestick and Heikin Ashi features to assess the trend across different timeframes. For example, if both the daily and 4-hour Heikin Ashi candles are bullish, it may indicate a strong uptrend.
Entry and Exit Signals:
Use the Zigzag indicator to identify potential entry points by looking for a new swing high or low.
Horizontal lines from the Zigzag can be used as support and resistance levels, helping to determine potential entry and exit points.
Moving Average Crossovers:
Monitor the crossovers of the moving averages. For example, when a shorter-term MA crosses above a longer-term MA, it may signal a potential buy opportunity.
Confluence of Signals:
The best trading opportunities may arise when multiple signals align. For example, a bullish Zigzag swing, supported by bullish Heikin Ashi candles and a moving average crossover, could provide a strong buy signal.
Disclaimer
For Educational Purposes Only: This indicator is provided for educational purposes and should not be used as the sole basis for any trading decisions.
No Guarantees: The indicator is provided "as is" without any guarantees of accuracy or completeness. Market conditions can change rapidly, and this indicator may not always reflect the most accurate market state.
Test Thoroughly: Bugs may exist in the script. It is highly recommended to test this script on a demo account before using it in live trading.
Use with Caution: Always use this indicator in conjunction with other analysis tools. Do not rely solely on this indicator for making trading decisions.
Sudden Changes or Removal: The indicator may be subject to sudden changes or removal without prior notice. The developer is not responsible for any issues this may cause.
By using this indicator, you agree to these terms.
MTF Candle Multi Hub インジケーター - ガイド
はじめに
「MTF Candle Multi Hub」インジケーターは、複数の時間枠のローソク足データ、平均足、移動平均線を1つのチャート上で視覚化するために設計された多用途かつ包括的なツールです。このインジケーターには、水平線を描画する機能を備えたジグザグ機能も含まれており、テクニカル分析において強力なツールとなります。
主な機能
マルチタイムフレームのローソク足表示:
5分足、15分足、1時間足、4時間足、日足、週足のローソク足を表示することができます。
各時間枠のローソク足は設定パネルでオンまたはオフに切り替えることができます。
ローソク足は、終値が始値より高いか低いかに基づいて色分けされており、強気と弱気のローソク足の色をカスタマイズできます。
平均足ローソク足:
5分足、15分足、1時間足、4時間足、日足、週足の平均足ローソク足を表示することができます。
標準のローソク足と同様に、これらをオンまたはオフに切り替え、色をカスタマイズすることが可能です。
移動平均線(MA):
このインジケーターは、単純移動平均線(SMA)または指数移動平均線(EMA)のいずれかを選択できる4つの移動平均線をサポートしています。
各移動平均線をオンまたはオフに切り替え、期間やタイプを設定パネルから調整できます。
また、2本の移動平均線の間に色を塗ることで、MAの相対的な位置を視覚的に表示する機能もあります。
ジグザグインジケーターと水平線:
ジグザグ機能は、重要なスイングの高値と安値の間に線を引き、トレンドや潜在的な反転ポイントを識別するのに役立ちます。
2本のジグザグラインを設定することができ、それぞれのスイングの長さ、線の色、スタイル、幅をカスタマイズできます。
また、ジグザグのスイングの始点と終点に水平線を描画する機能も提供されています。これらの水平線は、色、スタイル、幅、長さをカスタマイズできます。
描画する水平線の本数を設定でき、最新のスイングに焦点を当てた分析が可能です。
ラベルとコメントの表示:
インジケーターは、チャート上にカスタムラベルとコメントを表示するオプションを提供します。
最大10個の異なるコメントを入力することができ、これらはチャートの最新のローソク足にラベルとして表示されます。
ラベルの位置、背景色、テキストの色、テキストのサイズは完全にカスタマイズ可能です。
トレード戦略
マルチタイムフレーム分析を使用したトレンドフォロー:
マルチタイムフレームのローソク足や平均足の機能を使用して、異なる時間枠でのトレンドを評価します。例えば、日足と4時間足の平均足が共に強気であれば、強い上昇トレンドを示している可能性があります。
エントリーとエグジットシグナル:
ジグザグインジケーターを使用して、新たなスイング高値または安値を確認し、エントリーポイントを見極めます。
ジグザグの水平線をサポートおよびレジスタンスレベルとして使用し、エントリーやエグジットのタイミングを判断します。
移動平均線のクロスオーバー:
移動平均線のクロスオーバーを監視します。例えば、短期の移動平均線が長期の移動平均線を上抜けた場合、買いのシグナルとなる可能性があります。
シグナルのコンフルエンス:
複数のシグナルが一致する場合、最も良いトレード機会が生まれるかもしれません。例えば、強気のジグザグスイング、強気の平均足、移動平均線のクロスオーバーが揃うと、強力な買いシグナルとなる可能性があります。
免責事項
教育目的のみ: このインジケーターは教育目的で提供されており、トレードの決定を行う際の唯一の基準として使用すべきではありません。
保証なし: インジケーターは「現状のまま」提供されており、その正確性や完全性についての保証はありません。市場の状況は急速に変化する可能性があり、このインジケーターが常に最も正確な市場状況を反映するとは限りません。
十分なテストを: このスクリプトにはバグが存在する可能性があります。実際のトレードで使用する前に、デモ口座で十分にテストすることを強くお勧めします。
慎重に使用: このインジケーターを他の分析ツールと併用して使用してください。このインジケーターだけに頼ってトレードの決定を行うべきではありません。
突然の変更や削除の可能性: このインジケーターは予告なく変更や削除が行われる場合があります。そのため、利用者に不利益が生じる可能性がありますが、開発者はその責任を負いません。
このインジケーターを使用することで、これらの条件に同意したものとみなされます。

Sylvain Zig-Zag [MyTradingCoder]This Pine Script version of ZigZagHighLow is a faithful port of Sylvain Vervoort's original study, initially implemented in NinjaScript and later added to the thinkorswim standard library. This indicator identifies and connects swing points in price data, offering a clear visualization of market moves that exceed a specified threshold. Additionally, it now includes features for detecting and plotting support and resistance levels, enhancing its utility for technical analysis.
Overview
The Sylvain Zig-Zag study excels at highlighting significant price swings by plotting points where the price change, combined with volatility adjustments via the Average True Range (ATR), exceeds a user-defined percentage. It effectively smooths out minor fluctuations, allowing traders to focus on the primary market trends. This tool is particularly useful in identifying potential turning points, trends in price movements, and key support and resistance levels, making it a valuable addition to your technical analysis arsenal.
How It Works
The Sylvain Zig-Zag indicator works by detecting swing points in the price data and connecting them to form a zigzag pattern. A swing point is identified when the price moves a certain distance, defined by a combination of percentage change and ATR. This distance must be exceeded for a swing point to be plotted.
When the price moves upwards and exceeds the previous high by a specified percentage plus a factor of the ATR, a new high swing point is plotted. Conversely, a low swing point is plotted when the price moves downwards and exceeds the previous low by the same criteria. This ensures that only significant price moves are considered, filtering out minor fluctuations and providing a clear view of the overall market trend.
In addition to plotting zigzag lines, the indicator can now identify and draw support and resistance levels based on the detected swing points. These levels are crucial for identifying potential reversal areas and market structure.
Key Features
Swing Point Detection: Accurately identifies significant price swings by considering both percentage price change and volatility (via Average True Range).
Dynamic Support/Resistance: Automatically generates support and resistance lines based on the identified swing points, providing potential areas of price reversals.
Customizable Parameters: Tailor the indicator's sensitivity to your preferred trading style and market conditions. Adjust parameters like percentage reversal, ATR settings, and absolute/tick reversals.
Visual Clarity: Choose to display the ZigZag line, support/resistance levels, new trend icons, continuation icons, and even customize bar colors for easy visual analysis.
Trading Applications
Trend Identification: Easily visualize the prevailing market trend using the direction of the ZigZag line and support/resistance levels.
Entry/Exit Signals: Potential entry points can be identified when the price interacts with the dynamic support/resistance levels.
Stop-Loss Placement: Use recent swing points as logical places for setting stop-loss orders.
Profit Targets: Project potential price targets based on the distance between previous swing points.
Input Parameters
Several input parameters can be adjusted to customize the behavior of the Sylvain Zig-Zag indicator. These parameters allow traders to fine-tune the detection of swing points and support/resistance levels to better suit their trading strategy and the specific market conditions they are analyzing.
High Source and Low Source:
These inputs define the price points used for detecting high and low swing points, respectively. You can choose between high, low, open, or close prices for these calculations.
Percentage Reversal:
This input sets the minimum percentage change in price required for a swing to be detected. A higher percentage value will result in fewer but more significant swing points, while a lower value will detect more frequent, smaller swings.
Absolute Reversal:
This parameter allows for an additional fixed value to be added to the minimum price change and ATR change. This can be useful for increasing the distance between swing points in volatile markets.
ATR Length:
This input defines the period used for calculating the ATR, which is a measure of market volatility. A longer ATR period will smooth out the ATR calculation, while a shorter period will make it more sensitive to recent price changes.
ATR Multiplier:
This factor is applied to the ATR value to adjust the sensitivity of the swing point detection. A higher multiplier will increase the required price movement for a swing point to be plotted, reducing the number of detected swings.
Tick Reversal:
This input allows for an additional value in ticks to be added to the minimum price change and ATR change, providing further customization in the swing point detection process.
Support and Resistance:
Show S/R: Enable or disable the plotting of support and resistance levels.
Max S/R Levels: Set the maximum number of support and resistance levels to display.
S/R Line Width: Adjust the width of the support and resistance lines.
Visual Settings
The Sylvain Zig-Zag indicator also includes visual settings to enhance the clarity of the plotted swing points and trends. You can customize the color and width of the zigzag line, and enable icons to indicate new trends and continuation patterns. Additionally, the bars can be colored based on the detected trend, aiding in quick visual analysis.
Conclusion
This port of the ZigZagHighLow study from NinjaScript to Pine Script preserves the essence of Sylvain Vervoort’s methodology while adding new features for support and resistance. It provides traders with a powerful tool for technical analysis. The combination of price changes and ATR ensures that you have a robust and adaptable tool for identifying key market movements and structural levels. Customize the settings to match your trading style and gain a clearer picture of market trends, turning points, and support/resistance areas. Enjoy improved market analysis and more informed trading decisions with the Sylvain Zig-Zag indicator.

Crab Harmonic Pattern [TradingFinder] Harmonic Chart patterns🔵 Introduction
The Crab pattern is recognized as a reversal pattern in technical analysis, utilizing Fibonacci numbers and percentages for chart analysis. This pattern can predict suitable price reversal areas on charts using Fibonacci ratios.
The structure of the Crab pattern can manifest in both bullish and bearish forms on the chart. By analyzing this structure, traders can identify points where the price direction changes, which are essential for making informed trading decisions.
The pattern's structure is visually represented on charts as shown below. To gain a deeper understanding of the Crab pattern's functionality, it is beneficial to become familiar with its various harmonic forms.
🟣 Types of Crab Patterns
The Crab pattern is categorized into two types based on its structure: bullish and bearish. The bullish Crab is denoted by the letter M, while the bearish Crab is indicated by the letter W in technical analysis.
Typically, a bullish Crab pattern signals a potential price increase, whereas a bearish Crab pattern suggests a potential price decrease on the chart.
The direction of price movement depends significantly on the price's position within the chart. By identifying whether the pattern is bullish or bearish, traders can determine the likely direction of the price reversal.
Bullish Crab :
Bearish Crab :
🔵 How to Use
When trading using the Crab pattern, crucial parameters include the end time of the correction and the point at which the chart reaches its peak. Generally, the best time to buy is when the chart nears the end of its correction, and the best time to sell is when it approaches the peak price.
As we discussed, the end of the price correction and the time to reach the peak are measured using Fibonacci ratios. By analyzing these levels, traders can estimate the end of the correction in the chart waves and select a buying position for their stock or asset upon reaching that ratio.
🟣 Bullish Crab Pattern
In this pattern, the stock price is expected to rise at the pattern's completion, transitioning into an upward trend. The bullish Crab pattern usually begins with an upward trend, followed by a price correction, after which the stock resumes its upward movement.
If a deeper correction occurs, the price will change direction at some point on the chart and rise again towards its target price. Price corrections play a critical role in this pattern, as it aims to identify entry and exit points using Fibonacci ratios, allowing traders to make purchases at the end of the corrections.
When the price movement lines are connected on the chart, the bullish Crab pattern resembles the letter M.
🟣 Bearish Crab Pattern
In this pattern, the stock price is expected to decline at the pattern's completion, leading to a strong downward trend. The bearish Crab pattern typically starts with a price correction in a downward trend and, after several fluctuations, reaches a peak where the direction changes downward, resulting in a significant price drop.
This pattern uses Fibonacci ratios to identify points where the price movement is likely to change direction, enabling traders to exit their positions at the chart's peak. When the price movement lines are connected on the chart, the bearish Crab pattern resembles the letter W.
🔵 Setting
🟣 Logical Setting
ZigZag Pivot Period : You can adjust the period so that the harmonic patterns are adjusted according to the pivot period you want. This factor is the most important parameter in pattern recognition.
Show Valid Format : If this parameter is on "On" mode, only patterns will be displayed that they have exact format and no noise can be seen in them. If "Off" is, the patterns displayed that maybe are noisy and do not exactly correspond to the original pattern.
Show Formation Last Pivot Confirm : if Turned on, you can see this ability of patterns when their last pivot is formed. If this feature is off, it will see the patterns as soon as they are formed. The advantage of this option being clear is less formation of fielded patterns, and it is accompanied by the latest pattern seeing and a sharp reduction in reward to risk.
Period of Formation Last Pivot : Using this parameter you can determine that the last pivot is based on Pivot period.
🟣 Genaral Setting
Show : Enter "On" to display the template and "Off" to not display the template.
Color : Enter the desired color to draw the pattern in this parameter.
LineWidth : You can enter the number 1 or numbers higher than one to adjust the thickness of the drawing lines. This number must be an integer and increases with increasing thickness.
LabelSize : You can adjust the size of the labels by using the "size.auto", "size.tiny", "size.smal", "size.normal", "size.large" or "size.huge" entries.
🟣 Alert Setting
Alert : On / Off
Message Frequency : This string parameter defines the announcement frequency. Choices include: "All" (activates the alert every time the function is called), "Once Per Bar" (activates the alert only on the first call within the bar), and "Once Per Bar Close" (the alert is activated only by a call at the last script execution of the real-time bar upon closing). The default setting is "Once per Bar".
Show Alert Time by Time Zone : The date, hour, and minute you receive in alert messages can be based on any time zone you choose. For example, if you want New York time, you should enter "UTC-4". This input is set to the time zone "UTC" by default.

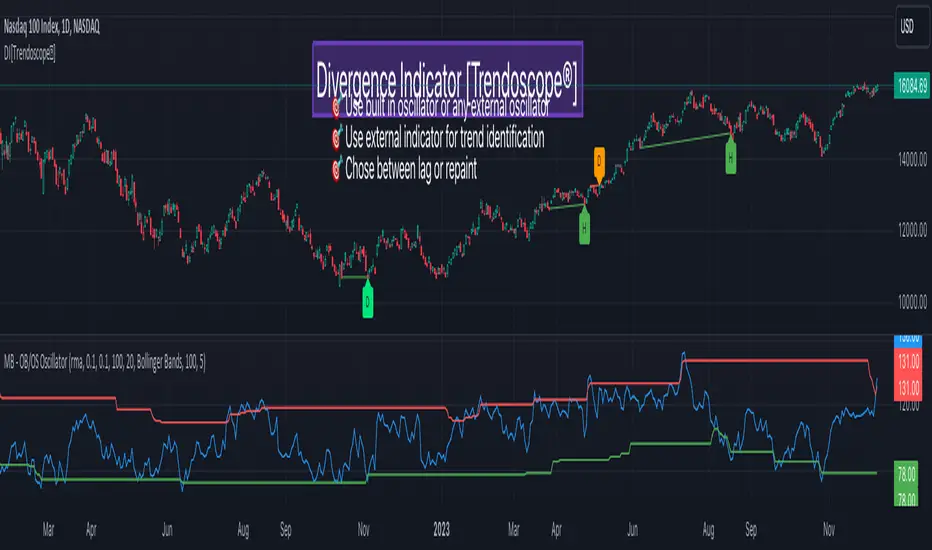
Diverging Chart Patterns - Ultimate [Trendoscope®]🎲 Presenting the Diverging Chart Patterns Ultimate Indicator
Much like its counterpart, the Converging Chart Patterns Ultimate indicator, this tool is an offshoot of our premium Auto Chart Patterns - Ultimate offering. However, it is exclusively designed to focus on diverging patterns.
🎲 Built on Extensive Research and Open-Source Foundations
Our journey toward creating this indicator has been guided by thorough research and insights gleaned from our previous works on Chart Patterns, which include:
Algorithmic Identification of Chart Patterns
Flag and Pennant Chart Patterns
Trading Diverging Chart Patterns
Drawing from the groundwork established by our publicly available indicators - Auto Chart Patterns and Flags and Pennants - this tool represents the culmination of our efforts to furnish traders with a refined approach to navigating diverging patterns. It not only facilitates the formulation of technical trading strategies but also aids in assessing their efficacy through historical performance analysis. The specific patterns addressed by this indicator encompass:
Rising Wedge (Diverging Type)
Falling Wedge (Diverging Type)
Diverging Triangle
Rising Triangle (Diverging Type)
Falling Triangle (Diverging Type)
🎲 Chart Pattern Scanning Methodology
Identifying diverging chart patterns follows a structured approach comprising several key steps:
Zigzag Examination : Start by analyzing each zigzag, focusing on the last 5 or 6 pivot points to pinpoint potential trend line pairs.
Divergence Verification : Project these trend lines backward and scrutinize for intersections within a specified number of bars prior. This step confirms the presence of divergence.
Pattern Categorization : Once divergence is confirmed, categorize each pattern based on the directional orientation of its trend lines. Refer to our article - Algorithmic Identification of Chart Patterns for detailed categorization guidelines.
🎲 Methodology or Trading for Chart Patterns
While traditional perspectives often prescribe specific trading biases to diverging patterns—for instance, labeling Rising Wedges as bearish and Falling Wedges as bullish, while acknowledging Triangles' versatility—there's limited empirical evidence to fully support these assumptions. Our indicator is crafted to empower users to explore and validate a wide range of trading hypotheses, including unconventional ones. This approach liberates trading strategies from being confined to historical market behaviors.
We offer extensive customization options to facilitate testing of diverse strategies. The initial setup accommodates both long and short trading scenarios for each identified pattern. Users retain the freedom to adjust trading directions and other parameters within the indicator's settings to align with their analytical preferences.
This open approach is grounded in the methodology detailed in - Trading Diverging Chart Patterns . It is exemplified by the following process, which users can customize and enhance using our indicator.
🎲 Insight into Indicator Components
The chart below provides an illustration of the components comprising our indicator:
Pattern Visualization : This functionality dynamically showcases patterns on the chart, emphasizing presently active ones. Historical patterns are omitted to uphold clarity and optimize performance, considering limitations in drawing object capacity.
Trading Annotations : The indicator conveniently denotes open trades directly on the chart, accommodating both long and short positions based on user preferences and the ongoing status of associated trades for each pattern.
Performance Metrics Table : A comprehensive table meticulously presents backtesting outcomes for individual patterns alongside aggregated results. It encompasses vital metrics such as win rates and the profit factor, calculated in alignment with the designated risk-reward ratio. These insights provide users with valuable assessments of potential profitability and trade strategy effectiveness.
🎲 Delving into the Indicator's Customization Features
Our indicator boasts a wealth of settings, empowering users to customize criteria and refine their trading strategies. Each setting comes with detailed tooltips, offering valuable insights into its functionality. Let's explore each category methodically.
🎯 Zigzag Configuration Options
These settings provide users with the flexibility to fine-tune their pattern analysis by adjusting the length and depth of the zigzag:
Length Adjustment : Altering this parameter modifies the scale of detected patterns. Higher values highlight larger formations, while lower ones focus on more compact patterns.
Depth Enhancement : This parameter adjusts the complexity of the recursive zigzag analysis, potentially revealing larger patterns across multiple levels. Users should exercise caution, as excessive depth may strain the indicator's processing capacity.
🎯 Pattern Scanning Settings
This collection of settings refines the pattern scanning process, typically adjusted to achieve precise geometric alignment of detected patterns. While many settings can be left at their default values for regular use, users are encouraged to customize them, particularly the "Last Pivot Direction," to explore different theoretical approaches to pattern trading.
🎯 Trade Configuration Settings
Arguably the most vital for users, these settings provide full control in shaping trading strategies based on diverging chart patterns. This encompasses the freedom to establish entry, stop, and target prices, fine-tune risk-reward ratios, choose historical depth for backtesting, and integrate filters to guide trade direction.
🎯 Pattern Specific Settings
Here, users have the flexibility to customize settings for individual patterns or groups, thereby refining the precision of their strategies. Alongside the option to enable/disable specific patterns and pattern groups, users can also choose pattern-specific settings such as Last Pivot Direction, Trade Direction Filter, and external filters.
🎯 Fully Customizable Alerts
Utilizing the alert() function, these notifications circumvent the usual template within the alert widget. To address this, we've integrated placeholders in the settings for creating comprehensive alert templates.
Available Categories Include
New - Alerts when a new pattern is identified
Entry - Alerts when an entry condition for a configured pattern based trade is met.
Stop - Alerts when a trade that has reached entry gets stopped out without reaching target
Target - Alerts when a trade reaches its target
Invalidation - Alerts when a trade reaches an invalidation point before reaching the entry.
Each alert type can possess its unique template. Tailorable templates are crucial for effectively utilizing alerts within broker or exchange integration.
Here are some of the placeholders that are defined in the indicator.
{type} - Alert type - new/entry/stop/target/invalid
{pid} - Pattern ID of the pattern belonging to trade. Multiple trades can have same pattern id since a pattern can be traded in both long and short directions.
{tid} - Unique Trade ID for the given trade.
{ticker} - Ticker ID on which the indicator is run
{timeframe} - Chart timeframe on which the indicator is run
{basecurrency} - Base currency of the symbol
{quotecurrency} - Quote currency of the symbol
{pivots} - Pivot values of the pattern
{price} - Current price when the alert is triggered.
{pattern} - Name of the pattern on which the alert is triggered.
{direction} - Direction of the trade.
{entrydirection} - Direction of the entry signal. Used for specific bot integration.
{exitdirection} - Direction of the exit signal. Used for specific bot integration.
{entry} - Entry price of the trade
{stop} - Stop price of the trade
{target} - Target price of the trade
{invalidation} - Invalidation price of the trade
🎯 Display and Stats
These settings regulate the display options on the chart. Closed trade statistics are showcased in a table and appear in the bottom-left corner of the chart. These can be tailored using the display settings.
Bezahltes Script

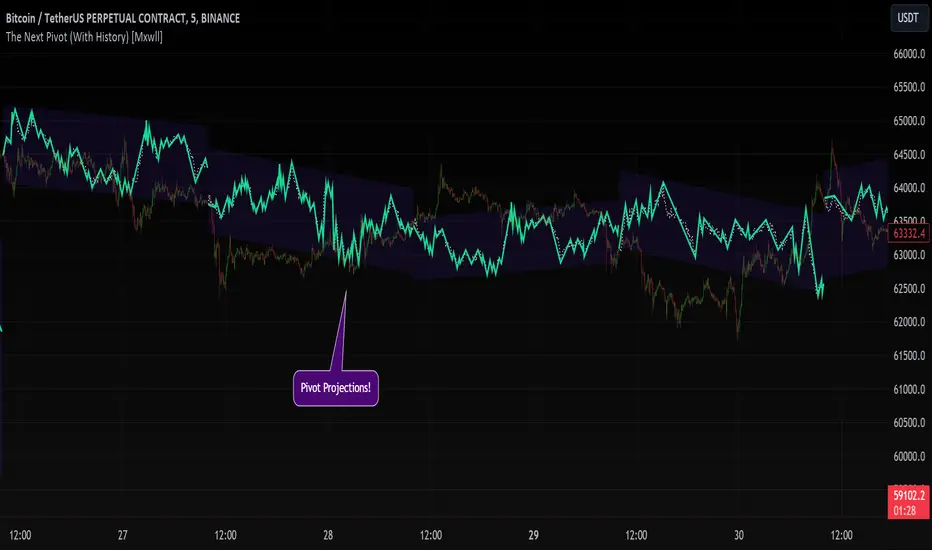
The Next Pivot (With History) [Mxwll]Introducing "The Next Pivot (With History)"!
With permission from the author @KioseffTrading
The script "The Next Pivot" has been restructured to show historical projections!
Features
Find the most similar price sequence per time frame change.
Forecast almost any public indicator! Not just price!
Forecast any session i.e. 4Hr, 1Hr, 15m, 1D, 1W
Forecast ZigZag for any session
Spearmen
Pearson
Absolute Difference
Cosine Similarity
Mean Squared Error
Kendall
Forecasted linear regression channel
The image above shows/explains some of the indicator's capabilities!
Additionally, you can project almost any indicator!
Should load times permit it, the script can search all bar history for a correlating sequence. This won't always be possible, contingent on the forecast length, correlation length, and the number of bars on the chart.
If a load time error occurs, simple reduce the "Bars Back To Search" parameter!
The script can only draw 500 bars into the future. For whatever time frame you are on and the session you wish to project, ensure it will not exceeded a 500-bar forecast!
Reasonable Assessment
The script uses various similarity measures to find the "most similar" price sequence to what's currently happening. Once found, the subsequent price move (to the most similar sequence) is recorded and projected forward.
So,
1: Script finds most similar price sequence
2: Script takes what happened after and projects forward
While this may be useful, the projection is simply the reaction to a possible one-off "similarity" to what's currently happening. Random fluctuations are likely and, if occurring, similarities between the current price sequence and the "most similar" sequence are plausibly coincidental.
Thanks!
Swing Suite (SMT/Divergences + Gann Swings)Hello Traders!
TRN Swing Suite (SMT/Divergences + Gann Swings) is an indicator which identifies, and highlights pivot points (swings) and prints a lot of information about the swings in the chart (e.g. length, duration, cumulative Delta, ...). Furthermore, it detects divergences in connection with any given indicator, even custom ones. In addition to this, you can choose the algorithm to compute the swings. The famous Gann-Swing algorithm and the extremely precise TRN Swing algorithm (called Standard) are available for selection, as well as two other variants. Compared to other swing or zig-zag indicators it works in real-time, does not need a look-a-head to find swings and is not repainting. Moreover, equal (double) highs and lows are detected and displayed. The TRN Swing Suite helps traders to visualize the pure price action and identify key turning points or trends. The indicator comes with the following features:
Precise real-time swing detection without repainting
Divergence detecting for any given (custom) indicator - with 11 different preset indicators
SMT (Smart Money Technique)/Divergence detecting in relation to other instruments
Swing Performance Statistics
Swing support and resistance levels
Swing trend for multiple swing sizes
Equal/double high and low detection
4 different swing computation styles
Displaying of swing labels, values and information
Customizable settings as well as look and feel
It's important to note that the TRN Swing Suite is a visual tool and does not provide specific buy or sell signals. It serves as a guide for traders to analyze market structure in depth and make well-informed trading decisions based on their trading strategy and additional technical analysis.
Divergence Detection for any given (Custom) Indicator
The divergence detector finds with unrivaled precision bullish and bearish as well as regular and hidden divergences. The main difference compared to other divergences indicators is that this indicator finds rigorously the extreme peaks of each swing, both in price and in the corresponding indicator. This precision is unmatched and therefore this is one of the best divergences detectors.
The build in divergence detector works with any given indicator, even custom ones. In addition, there are 11 built-in indicators. Most noticeable is the cumulative delta indicator, which works astonishingly well as a divergence indicator. Full list:
External Indicator (see next section for the setup)
Awesome Oscillator (AO)
Commodity Channel Index (CCI)
Cumulative Delta Volume (CDV)
Chaikin Money Flow (CMF)
Moving Average Convergence Divergence (MACD)
Money Flow Index (MFI)
Momentum
On Balance Volume (OBV)
Relative Strength Index (RSI)
Stochastic
Williams Percentage Range (W%R)
The divergences are colored with vivid lines and labels. Bullish divergences are distinguished with luminous blue lines, while bearish divergences are denoted by striking red lines. Upon detecting a divergence, the colored lines act as a visual indicator for traders, signaling an imminent possibility of a trend reversal. In response, traders can leverage this valuable insight to make informed decisions in their trading activities.
Choose Your Custom Divergence Indicator
Handpick your custom indicator, and the TRN Swing Suite will hunt for divergences on your preferred market and timeframe. Importantly, you must add the indicator to your chart. Afterwards, simply go to the “Divergence Detection” section in the TRN Swing Suite indicator settings and choose "External Indicator". If the custom indicator has one reference value, then choose this value in the “External Indicator (High)” field. If there are high and low values (e.g. candles), then you also must set the “External Indicator Low” field.
In the provided graphic, we've chosen the stochastic RSI as our example, and as you can see, the TRN Swing Suite instantly identifies and plots bullish and bearish divergences on your chart.
Smart Money Technique (SMT)/Divergence detecting in Relation to other Instruments
Smart Money Technique/Tool (SMT) means the divergence detection between two related instruments. The TRN Swing Suite finds divergence in relation to other instruments, e.g. NQ vs ES or BTCUSDT vs ETHUSDT. Just add another instrument to the chart. As representation style you can choose lines or candles/bars. Afterwards, simply go to the “Divergence Detection” section in the TRN Swing Suite indicator settings and choose "External Indicator". If the second instrument is represented as line, then choose this value in the “External Indicator (High)” field. If there are high and low values (e.g. candles/bars), then you also must set the “External Indicator Low” field.
The detection of SMTs can help traders to decide whether the trend continues, or a reversal is imminent. E.g. if the NQ makes a new higher high but the ES fails to do so and makes a new lower high, then the TRN Swing Suite shows a divergence. As a result, the probability is high that the trend will not continue, and the trader can make an informed decision about what to do next.
How to Set Parameters for Divergence Indicators
To begin, access the indicator settings and find the “Divergence Detection”. Look for the "Parameters" sections where you can fine-tune Parameters 1-3. The default settings are already optimized for the oscillators AO, RSI, CDV, W%R, MFI and Stochastic. For other divergence indicators, you might want to adjust the settings to your liking. The parameter order is the same as in the corresponding divergence indicator.
TRN Swing Suite Statistics
Unveil the untapped potential of advanced Swing Statistics! Gain invaluable insights into historical swings and turning points. Elevate your expertise by harnessing this treasure trove of data to supercharge signal reliability, while masterfully planning stop loss and take profit strategies with unrivaled accuracy. Within the TRN Swing Suite lie two powerful statistics, each offering distinct insights to empower your trading prowess.
Swing Statistic
The Swing Statistic comprises of two series, one for up swings (Up) and one for down swings (Down), with values given in points. The columns have the following meaning:
Up or down
# - total number of analyzed swings
Overall ∅ Length - average length of all swings in points
Overall ∅ Duration - average duration of swings in bars
∅ Length - average lengths for custom-defined swing counts
∅ Duration - average durations for custom-defined swing counts
The custom-defined swing count is used to determine the swing length/duration for the last x swings. Note, in the case of well-established assets like Microsoft or Nvidia, which have undergone one or more stock splits, the overall average in column three may deviate significantly from those in column five. That is why column 5 is useful.
Relation Statistic
The Relation Statistic highlights percentages representing the historical occurrence of specific high and low sequences. In the first column (in %), various types of highs and lows are listed as reference points.
For example, the first row corresponds to "HH followed by", where the second column (#) displays the total count of higher highs (HH) considered. The subsequent columns showcase the percentages of how often certain patterns follow the initial HH.
Fields marked in blue represent sequences that occurred in over 50% of cases. The darker the shade of blue in each field, the higher the percentage.
Use Swing Statistics to Validate Stop-Loss and Take-Profit Levels
No matter which signals you choose to trade, consulting Swing Statistics can significantly enhance the reliability of these signals.
For example, when looking for a long entry after a lower low (LL), you can examine the likelihood of a subsequent lower high (LH) or even a higher high (HH). Combining this valuable information with your predetermined Take Profit level allows you to better assess whether your target can be achieved successfully. Additionally, you can add the average up swing length to the lower low for an alternative Take Profit level. Similarly, you can verify the probability of the next low being a higher low (HL) or another lower low (LL) to determine the likelihood of your Stop Loss being triggered. Align the length of the last down swing with the average down swing length for an alternative Stop Loss.
Swing Support and Resistance Levels
Swing support and resistance levels are horizontal lines starting from a swing high or swing low and representing natural support and resistance levels. Price tends to respect this levels one way or another. In most cases, old swing highs and swing lows provide a lot of liquidity to the market. For example, for a swing high there are at least three different market players at work:
Traders put there stop loss above the swing high
Breakout traders go long above the swing high
Turtle soup (reverse) trader go short above the swing high
Swing Trend (Multiple Sizes)
The TRN Swing Suite can display either at the top or at the bottom the prevailing swing trends for the main trend seen in the chart and for two additional swing sizes. This is useful to see the swing trend for medium and bigger swings to get a clear picture of the market.
Getting an Edge with the TRN Swing Suite
The indicator clearly displays up trends, defined as a sequence of higher highs (HH) and higher lows (HL), with green labels and down trends, defined as a sequence of lower lows (LL) and lower highs (LH), with red labels. Equal highs/double tops (DT) and equal lows/ double bottoms (DB) are highlighted in gold.
In addition, the labels show a full stack of valuable information about the swings to maximize your accuracy.
Length
Length percentage in relation to the last swing length
Duration
Time
Volume
Cumulative Delta
In an uptrend the up swings should have higher volume und higher cumulative delta than the down swings. The duration and time for down swings in an uptrend should be shorter than for the up swings.
Use Cases for Swing Detection
Trend Identification
By connecting the swing highs and lows, traders can identify and analyze the prevailing trend in the market. An uptrend is characterized by higher swing highs and lows, while a downtrend is characterized by lower highs and lower lows. The indicator helps traders visually assess the strength and continuity of the trend.
Support And Resistance Levels
The swing highs and lows can act as support and resistance levels. Swing highs may act as resistance levels where selling pressure increases, while swing lows may act as support levels where buying pressure increases. Traders often pay attention to these levels as potential areas for trade entries, exits, or placing stop-loss orders.
Pattern Recognition
The swings identified by the indicator can help traders recognize chart patterns, such as equal high/lows, consolidations, wedges, triangles or more complex patterns like Gartley or Head and Shoulders. These patterns can provide insights into potential trend continuation or reversal.
Trade Entry and Exit
Traders may use TRN Swing to determine potential trade entry and exit points. For example, in an uptrend, traders may look for opportunities to enter long positions near swing lows or on pullbacks to support levels. Conversely, in a downtrend, traders may consider short positions near swing highs or on retracements to resistance levels.
Swing Styles
In addition to the standard swings, you have the flexibility to choose between various swing styles, including ticks, percent, or even the famous Gann swings.
Standard
Gann
Ticks
Percent
Conclusion
While signals from TRN Swings can be informative, it is important to recognize that their reliability may vary. Various external factors can impact market prices, and it is essential to consider your risk tolerance and investment goals when executing trades.
Risk Disclaimer
The content, tools, scripts, articles, and educational resources offered by TRN Trading are intended solely for informational and educational purposes. Remember, past performance does not ensure future outcomes.

Advanced Trend Strategy [BITsPIP]The BITsPIP team is super excited to share our latest trading gem with you all. We're all about diving deep and ensuring our strategies can stand the test of time. So, we invite you to join us in exploring the awesome potential of this new strategy and really put it through its pace with some deep backtesting. This isn't just another strategy; it boasts a profit factor hovering around 1.5 across over 1000 trades, which is quite an achievement. Consider integrating it with your trading bots to further enhance your trading efficiency and profit generation. Curious? Ask for trial access or drop by our website for more details.
I. Deep Backtesting
We're all in on transparency and solid results, which is why we didn't stop at 100... or even 500 trades. We went over 1000, making sure this strategy is as robust as they come. No flimsy forecasts or sneaky repainting here. Just good, solid strategy that's ready for the real deal. Curious about the details? Check out our detailed backtesting screenshot for the BINANCE:BTCUSDT in a 5-minute timeframe. It's all about giving you the clear picture.
#No Overfitting
#No Repainting
Backtesting Screenshot
II. Algorithmic Trading
Thinking of trading as a manual game? Think again! Manual trading is a bit like rolling the dice - fun, but kind of risky if you're aiming for consistent wins. Instead, why not lean into the future with algorithmic trading? It's all about trusting the market's rhythm over the long term. By integrating your strategy with a trading bot, you can enjoy peace of mind, rest easy, and keep those emotional trades at bay.
III) Applications
Dive into the Advanced Trend Strategy, your versatile tool for navigating the market's waters. This strategy shines in under an hour timeframes, offering adaptability across stocks, commodities, forex, and cryptocurrencies. Initially fine-tuned for low-volatility cryptos like BINANCE:BTCUSDT , its default settings are a solid starting point.
But here's where your expertise comes into play. Each market beats to its own drum, necessitating nuanced adjustments to stop loss and take profit settings. This customization is key to maximizing the strategy's effectiveness in your chosen arena.
IV) Strategy's Logic
The Advanced Trend Strategy is a powerhouse, blending the precision of Hull Suite, RSI, and our unique trend detector technique. At its core, it’s designed for savvy risk management, aiming to lock in substantial profits while steering clear of minor market ripples. It utilizes stop-loss and take-profit thresholds to form a profit channel, providing a safety net for each trade. This is a trend-following strategy at heart, where these profit channels play a critical role in maximizing returns by securing positions within these "warranty channels."
1. Trend-Following
The market's complexity, influenced by countless factors, makes small movements seem almost chaotic. Yet, the principle of #Trend-Following shines in less volatile markets in long term. The strategy excels by pinpointing the ideal moments to enter the market, coupled with refined risk management to secure profits. It’s tailored for you, the individual trader, enabling you to ride the waves of market trends upwards or downwards.
2. Risk Management
A key facet of the strategy is its emphasis on pragmatic risk management. Traders are empowered to establish practical stop-loss and take-profit levels, tailoring these crucial parameters to the specific market they are engaging in. This customization is instrumental in optimizing long-term profitability, ensuring that the strategy adapts fluidly to the unique characteristics and volatility patterns of different trading environments.
V) Strategy's Input Settings and Default Values
1. Alerts
The strategy comes equipped with a flexible alert system designed to keep you informed and ready to act. Within the settings, you’ll find options to configure order/exit and comment/alert messages to your preference. This feature is particularly useful for staying on top of the strategy’s activities without constant manual oversight.
2. Hull Suite
i. Hull Suite Length: Designed for capturing long-term trends, the Hull Suite Length is configured at 1000. Functioning comparably to moving averages, the Hull Suite features upper and lower bands. Currently, it is set to 1000.
ii. Length Multiplier: It's advisable to maintain a minimal value for the Length Multiplier, prioritizing the optimization of the Hull Suite Length. Presently, it is set to 1.
3. RSI Indicator
i. The RSI is a widely recognized tool in trading. Adapt the oversold and overbought thresholds to better match the specifics of your market for optimal results.
4. StopLoss and TakeProfit
i. StopLoss and TakeProfit Settings: Two distinct approaches are available. Semi-Automatic StopLoss/TakeProfit Setting and Manual StopLoss/TakeProfit Setting. The Semi-Automatic mode streamlines the process by allowing you to input values for a 5-minute timeframe, subsequently auto-adjusting these values across various timeframes, both lower and higher. Conversely, the Manual mode offers full control, enabling you to meticulously define TakeProfit values for each individual timeframe.
ii. TakeProfit Threshold # and TakeProfit Value #: Imagine this mechanism as an ascending staircase. Each step represents a range, with the lower boundary (TakeProfit Value) designed to close the trade upon being reached, and the upper boundary (TakeProfit Threshold) upon being hit, propelling the trade to the next level, and forming a new range. This stair-stepping approach enhances risk management and increases profitability. The pre-set configurations are tailored for $BINANCE:BTCUSDT. It's advisable to devote time to tailoring these settings to your specific market, aiming to achieve optimal results based on backtesting.
iii. StopLoss Value: In line with its name, this value marks the limit of loss you're prepared to accept should the market trend go against your expectations. It's crucial to note that once your asset reaches the first TakeProfit range, the initial StopLoss value becomes obsolete, supplanted by the first TakeProfit Value. The default StopLoss value is pegged at 1.6(%), a figure worth considering in your trading strategy.
VI) Entry Conditions
The primary signal for entry is generated by our custom trend detection mechanism and hull suite values (ascending/descending). This is supported by additional indicators acting as confirmation.
VII) Exit Conditions
The strategy stipulates exit conditions primarily governed by stop loss and take profit parameters. On infrequent occasions, if the trend lacks confirmation post-entry, the strategy mandates an exit upon the issuance of a reverse signal (whether confirmed or unconfirmed) by the strategy itself.
BITsPIP

ZigZag With ATR Filter [vnhilton](OVERVIEW)
The typical ZigZag indicator, which connects pivot points (see TradingView's Help Center regarding their indicator Pivot Points High Low, for an in depth explanation on how they are calculated) with lines, except instead of a percentage threshold, it uses ATR which adjusts for volatility of the ticker you are viewing. The ZigZag indicator can therefore be used to help visualise price legs and trends on a usually noisy looking chart.
(FEATURES)
- Toggles for pivot point label contents such as the value, the trend, or nothing at all.
- ATR and pivot point periods.
- ATR multiplier minimum threshold to plot pivots and draw lines only when this threshold is met (helps eliminate small, perhaps insignificant price movements, to have a better focus on the overall trend).
- Show the last 2 to 499 ZigZag lines.
- Uptrend, downtrend and range colors for high and low pivot labels, text labels and lines, for both confirmed and real-time plots.
- Label size, and label styles for the high and low pivots.
- Customisable width and styles (Arrow Right, Dashed, Dotted, Solid) for the ZigZag line.
In the main chart picture, labels show both the pivot point value and the trend at that point. In the picture above, on the left shows only the pivot point value, the right shows only the trend.
Picture above shows just the label with 0 contents. Also notice the last recent line being blue instead of green. This is because the current bar hasn't finished so this line is currently live and not confirmed, so is subject to change. Keep in mind even if a pivot point is confirmed, it can be updated by a subsequent higher high/lower low.
Left chart shows a minimum ATR threshold multiplier of 1x; Right chart has 2x ATR minimum threshold. Notice the left chart highlights more price legs as more price legs satisfy a less strict threshold.

TASC 2024.03 Rate of Directional Change█ OVERVIEW
This script implements the Rate of Directional Change (RODC) indicator introduced by Richard Poster in the "Taming The Effects Of Whipsaw" article featured in the March 2024 edition of TASC's Traders' Tips .
█ CONCEPTS
In his article, Richard Poster discusses an approach to potentially reduce false trend-following strategy entry signals due to whipsaws in forex data. The RODC indicator is central to this approach. The idea behind RODC is that one can characterize market whipsaw as alternating up and down ZigZag segments. By counting the number of up and down segments within a lookback window, the RODC indicator aims to identify if the window contains a significant whipsaw pattern:
RODC = 100 * Segments / Window Size (bars)
Larger RODC values suggest elevated whipsaw in the calculation window, while smaller values signify trending price activity.
█ CALCULATIONS
• For each price bar, the script iterates through the lookback window to identify up and down segments.
• If the price change between subsequent bars within the window is in the direction opposite to the current segment and exceeds the specified threshold , the calculation interprets the condition as a reversal point and the start of a new segment.
• The script uses the number of segments within the window to calculate RODC according to the above formula.
• Finally, the script applies a simple moving average to smoothen the RODC data.
Users can change the length of the lookback window , the threshold value, and the smoothing length in the "Inputs" tab of the script's settings.

Zigzag Fibonacci Golden Zone [UAlgo]🔶 Description:
The "Zigzag Fibonacci Golden Zone" aims to identify potential trend pullback points by utilizing a combination of zigzag patterns and Fibonacci "Golden Zone (0.618 - 0.786)" retracement levels. It plots zigzag lines on the price chart, highlighting significant swing highs and swing lows, and overlays Fibonacci retracement levels to indicate potential support and resistance zones. Additionally, it provides options to display buy and sell signals based on specific criteria.
🔶 Key Features:
Zigzag Lines: The indicator plots zigzag lines on the price chart, marking significant swing highs and swing lows. These lines help traders visualize the direction and magnitude of price swings.
Fibonacci Retracement Levels: The indicator overlays Fibonacci retracement levels on the chart, indicating potential support and resistance levels. These levels are derived from the Fibonacci sequence and are commonly used by traders to identify reversal points.
Fibonacci occurs again when a new zigzag low or high is created :
Before new zigzag low pivot appears,
After new Zigzag low pivot appears,
As you see new fibonacci created after new pivot found also price bounced from retracement zone.
Customization Options: Traders can customize various parameters of the indicator, such as the length of the zigzag pattern, color preferences for different elements, and visibility of price labels and buy/sell signals.
Buy/Sell Signals: The indicator generates buy and sell signals based on predefined criteria, such as price movements relative to Fibonacci levels and other market conditions. These signals can help traders identify potential entry and exit points in the market.
Example :
Disclaimer :
Please note that trading involves significant risk, and past performance is not indicative of future results. The "Zigzag Fibonacci Golden Zone" indicator is provided for informational purposes only and should not be considered financial advice. Traders should conduct their own research and analysis before making any investment decisions. Additionally, the indicator's performance may vary depending on market conditions and other factors. Users are encouraged to use the indicator as part of a comprehensive trading strategy and to exercise caution when trading in the financial markets.

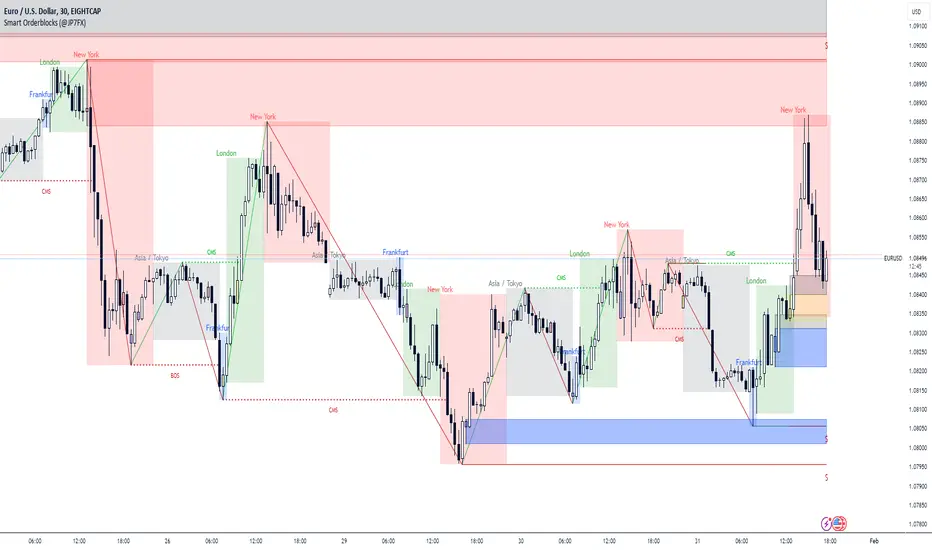
Smart Orderblocks / Supply and Demand (@JP7FX)
"Smart" Order Block Supply and Demand Indicator – a tool inspired by Smart Money Concepts and designed to complement your trading style.
It's not about perfection, but rather about enhancing your trading insights and catching things you might have missed.
Keep in mind that the structural representation here is subjective, just like many other indicators. It's more of a guide to help you navigate the market.
While it doesn't explicitly include Imbalance / FVG, you have the flexibility to use additional Imbalance /FVG indicators, including my own, to complement the insights drawn from Supply and Demand zones.
This indicator offers customisation options like trading ranges, allowing you to mark Killzones and tailor it to your preferences. Explore liquidity levels, 50% retracement lines, and personalize the colors and lines to match your unique chart setup.
Guide below on how the "Hidden" Zones are created!
Trade Safe :)
Converging Chart Patterns - Ultimate [Trendoscope®]🎲 Introducing the Converging Chart Patterns Ultimate Indicator
Derived from the comprehensive capabilities of our premium offering, the Auto Chart Patterns - Ultimate , this new indicator focuses exclusively on converging chart patterns. It marks the beginning of a series that, over time, will encompass the full spectrum of chart pattern analysis, ultimately enhancing and expanding beyond the scope of Auto Chart Patterns.
This strategic separation into more focused indicators is designed to cater to traders seeking precision in specific chart pattern categories.
🎲 Leveraging Research and Open-Source Foundations
Our journey to this indicator has been paved by extensive research and the insights gained from our prior works on Chart Patterns, including:
Algorithmic Identification of Chart Patterns
Flag and Pennant Chart Patterns
Trading Converging Chart Patterns
Drawing upon the foundation laid by our publicly shared indicators - Auto Chart Patterns and Flags and Pennants - this tool is the culmination of our efforts to provide traders with a refined method for strategizing around converging patterns. It not only facilitates the development of technical trading strategies but also aids in evaluating their effectiveness through historical performance analysis. The specific patterns addressed by this indicator include:
Rising Wedge (Converging Type)
Falling Wedge (Converging Type)
Converging Triangle
Rising Triangle (Converging Type)
Falling Triangle (Converging Type)
🎲 Chart Pattern Scanning Methodology
The process of identifying converging chart patterns involves several key steps:
Begin by examining each zigzag for the last 5 or 6 pivot points to identify potential trend line pairs.
Determine if these trend lines are converging by projecting them forwards and checking for an intersection within a specified number of bars ahead.
Upon confirming convergence, categorize each pattern based on the directional orientation of its trend lines, as detailed in our article - Algorithmic Identification of Chart Patterns
🎲 Methodology or Trading for Chart Patterns
While traditional views assign specific trading biases to converging patterns (e.g., Rising Wedges as bearish and Falling Wedges as bullish, with Triangles being more versatile), empirical support for these assumptions is limited. Our indicator is designed to empower users to explore and validate various trading hypotheses, including unconventional ones, thereby not confining trading strategies to past market behaviors.
We enable extensive customization for testing different strategies, with the initial setup allowing for both long and short trading scenarios for each identified pattern. Users have the liberty to adjust trading directions and other parameters within the indicator's settings to suit their analytical needs.
This open approach is rooted in the methodology outlined in - Trading Converging Chart Patterns , exemplified by the following process, which users can adapt and refine through our indicator.
🎲 Overview of Indicator Components
The components of our indicator are illustrated in the chart below
Pattern Visualization : This feature dynamically displays the patterns on the chart, focusing on currently active patterns. To maintain clarity and performance, historical patterns are not shown due to the constraints of drawing objects.
Trading Annotations : The indicator marks open trades directly on the chart, accommodating both long and short positions depending on the user's settings and the current status of trades associated with each pattern.
Performance Metrics Table : A comprehensive table presents the back testing results for individual patterns as well as aggregated outcomes. It includes crucial metrics such as win rates and the profit factor based on the set risk-reward ratio, offering users valuable insights into the potential profitability of their configurations and trade strategies.
🎲 Exploring the Indicator's Customization Options
This indicator is rich in settings, offering users the capability to tailor criteria and adapt their trading rules. Each setting is accompanied by detailed tooltips, providing insights into their use. Let's examine each category systematically.
🎯 Zigzag Configuration Options
These settings enable users to adjust the scope of their pattern analysis by varying the zigzag's length and depth.
Length Adjustment : Modifying this parameter changes the scale of detected patterns, with higher values spotting larger formations and lower ones focusing on more compact patterns.
Depth Enhancement : This alters the intricacy of the recursive zigzag analysis, potentially unveiling larger patterns across several levels. Caution is advised, as excessive depth may lead to the indicator exceeding its processing capacity.
🎯 Pattern Scanning Settings
This suite of settings fine-tunes the pattern scanning process, generally calibrated for precise geometric alignment of identified patterns. While most settings may remain as default for routine use, users are encouraged to tweak them, especially the "Last Pivot Direction," to explore various theoretical approaches to pattern trading.
🎯 Trade Configuration Settings
Arguably the most crucial for users, these settings offer complete autonomy in defining trading strategies around converging chart patterns. This includes the flexibility to set entry, stop, and target prices, adjust risk-reward ratios, select the historical depth for back testing, and incorporate filters to steer trade direction.
🎯 Pattern Specific Settings
Here, users can personalize settings for individual patterns or groups, enhancing the specificity of their strategy. Apart from enabling/disabling individual patterns and pattern groups, users can also select pattern specific Last Pivot Direction, Trade Direction Filter and external filters for each pattern.
🎯 Fully Customizable Alerts
Implemented through the alert() function, these alerts bypass the standard template in the alert widget. To counteract this, we've introduced placeholders within the settings to craft detailed alert templates.
Available Categories Include
New - Alerts when a new pattern is identified
Entry - Alerts when an entry condition for configured pattern based trade is met.
Stop - Alerts when a trade that has reached entry gets stopped out without reaching target
Target - Alerts when a trade reaches its target
Invalidation - Alerts when a trade reaches invalidation point before reaching the entry.
Each alert types can have its own template. Customizable templates are very important in using alerts for broker or exchange integration.
Here are some of the placeholders that are defined in the indicator.
{type} - Alert type - new/entry/stop/target/invalid
{pid} - Pattern ID of the pattern belonging to trade. Multiple trades can have same pattern id since a pattern can be traded in both long and short directions.
{tid} - Unique Trade ID for the given trade.
{ticker} - Ticker ID on which the indicator is run
{timeframe} - Chart timeframe on which the indicator is run
{basecurrency} - Base currency of the symbol
{quotecurrency} - Quote currency of the symbol
{pivots} - Pivot values of the pattern
{price} - Current price when the alert is triggered.
{pattern} - Name of the pattern on which the alert is triggered.
{direction} - Direction of the trade.
{entrydirection} - Direction of the entry signal. Used for specific bot integration.
{exitdirection} - Direction of the exit signal. Used for specific bot integration.
{entry} - Entry price of the trade
{stop} - Stop price of the trade
{target} - Target price of the trade
{invalidation} - Invalidation price of the trade
🎯 Display and Stats
These settings are used to control the display options on the chart. Closed trade stats is displayed in a table and printed in the bottom left corner of the chart. This can be customized by using display settings.
Bezahltes Script

Flags and Pennants [Trendoscope®]🎲 An extension to Chart Patterns based on Trend Line Pairs - Flags and Pennants
After exploring Algorithmic Identification and Classification of Chart Patterns and developing Auto Chart Patterns Indicator , we now delve into extensions of these patterns, focusing on Flag and Pennant Chart Patterns. These patterns evolve from basic trend line pair-based structures, often influenced by preceding market impulses.
🎲 Identification rules for the Extension Patterns
🎯 Identify the existence of Base Chart Patterns
Before identifying the flag and pennant patterns, we first need to identify the existence of following base trend line pair based converging or parallel patterns.
Ascending Channel
Descending Channel
Rising Wedge (Contracting)
Falling Wedge (Contracting)
Converging Triangle
Descending Triangle (Contracting)
Ascending Triangle (Contracting)
🎯 Identifying Extension Patterns.
The key to pinpointing these patterns lies in spotting a strong impulsive wave – akin to a flagpole – preceding a base pattern. This setup suggests potential for an extension pattern:
A Bullish Flag emerges from a positive impulse followed by a descending channel or a falling wedge
A Bearish Flag appears after a negative impulse leading to an ascending channel or a rising wedge.
A Bullish Pennant is indicated by a positive thrust preceding a converging triangle or ascending triangle.
A Bearish Pennant follows a negative impulse and a converging or descending triangle.
🎲 Pattern Classifications and Characteristics
🎯 Bullish Flag Pattern
Characteristics of Bullish Flag Pattern are as follows
Starts with a positive impulse wave
Immediately followed by either a short descending channel or a falling wedge
Here is an example of Bullish Flag Pattern
🎯 Bearish Flag Pattern
Characteristics of Bearish Flag Pattern are as follows
Starts with a negative impulse wave
Immediately followed by either a short ascending channel or a rising wedge
Here is an example of Bearish Flag Pattern
🎯 Bullish Pennant Pattern
Characteristics of Bullish Pennant Pattern are as follows
Starts with a positive impulse wave
Immediately followed by either a converging triangle or ascending triangle pattern.
Here is an example of Bullish Pennant Pattern
🎯 Bearish Pennant Pattern
Characteristics of Bearish Pennant Pattern are as follows
Starts with a negative impulse wave
Immediately followed by either a converging triangle or a descending converging triangle pattern.
Here is an example of Bearish Pennant Pattern
🎲 Trading Extension Patterns
In a strong market trend, it's common to see temporary periods of consolidation, forming patterns that either converge or range, often counter to the ongoing trend direction. Such pauses may lay the groundwork for the continuation of the trend post-breakout. The assumption that the trend will resume shapes the underlying bias of Flag and Pennant patterns
It's important, however, not to base decisions solely on past trends. Conducting personal back testing is crucial to ascertain the most effective entry and exit strategies for these patterns. Remember, the behavior of these patterns can vary significantly with the volatility of the asset and the specific timeframe being analyzed.
Approach the interpretation of these patterns with prudence, considering that market dynamics are subject to a wide array of influencing factors that might deviate from expected outcomes. For investors and traders, it's essential to engage in thorough back testing, establishing entry points, stop-loss orders, and target goals that align with your individual trading style and risk appetite. This step is key to assessing the viability of these patterns in line with your personal trading strategies and goals.
It's fairly common to witness a breakout followed by a swift price reversal after these patterns have formed. Additionally, there's room for innovation in trading by going against the bias if the breakout occurs in the opposite direction, specially when the trend before the formation of the pattern is in against the pattern bias.
🎲 Cheat Sheet
🎲 Indicator Settings
Custom Source : Enables users to set custom OHLC - this means, the indicator can also be applied on oscillators and other indicators having OHLC values.
Zigzag Settings : Allows users to enable different zigzag base and set length and depth for each zigzag.
Scanning Settings : Pattern scanning settings set some parameters that define the pattern recognition process.
Display Settings : Determine the display of indicators including colors, lines, labels etc.
Backtest Settings : Allows users to set a predetermined back test bars so that the indicator will not time out while trying to run for all available bars.

Auto Chart Patterns [Trendoscope®]🎲 Introducing our most comprehensive automatic chart pattern recognition indicator.
Last week, we published an idea on how to algorithmically identify and classify chart patterns.
This indicator is nothing but the initial implementation of the idea. Whatever we explained in that publication that users can do manually to identify and classify the pattern, this indicator will do it for them.
🎲 Process of identifying the patterns.
The bulk of the logic is implemented as part of the library - chartpatterns . The indicator is a shell that captures the user inputs and makes use of the library to deliver the outcome.
🎯 Here is the list of steps executed to identify the patterns on the chart.
Derive multi level recursive zigzag for multiple base zigzag length and depth combinations.
For each zigzag and level, check the last 5 pivots or 6 pivots (based on the input setting) for possibility of valid trend line pairs.
If there is a valid trend line pair, then there is pattern.
🎯 Rules for identifying the valid trend line pairs
There should be at least two trend lines that does not intersect between the starting and ending pivots.
The upper trend line should touch all the pivot highs of the last 5 or 6 pivots considered for scanning the patterns
The lower trend line should touch all the pivot lows of the last 5 or 6 pivots considered for scanning the patterns.
None of the candles from starting pivot to ending pivot should fall outside the trend lines (above upper trend line and below lower trend line)
The existence of a valid trend line pair signifies the existence of pattern. What type of pattern it is, to identify that we need to go through the classification rules.
🎲 Process of classification of the patterns.
We need to gather the following information before we classify the pattern.
Direction of upper trend line - rising, falling or flat
Direction of lower trend line - rising, falling or flat
Characteristics of trend line pair - converging, expanding, parallel
🎯 Broader Classifications
Broader classification would include the following types.
🚩 Classification Based on Geometrical Shapes
This includes
Wedges - both trend lines are moving in the same direction. But, the trend lines are either converging or diverging and not parallel to each other.
Triangles - trend lines are moving in different directions. Naturally, they are either converging or diverging.
Channels - Both trend lines are moving in the same direction, and they are parallel to each other within the limits of error.
🚩 Classification Based on Pattern Direction
This includes
Ascending/Rising Patterns - No trend line is moving in the downward direction and at least one trend line is moving upwards
Descending/Falling Patterns - No trend line is moving in the upward direction, and at least one trend line is moving downwards.
Flat - Both Trend Lines are Flat
Bi-Directional - Both trend lines are moving in opposite direction and none of them is flat.
🚩 Classification Based on Formation Dynamics
This includes
Converging Patterns - Trend Lines are converging towards each other
Diverging Patterns - Trend Lines are diverging from each other
Parallel Patterns - Trend Lines are parallel to each others
🎯 Individual Pattern Types
Now we have broader classifications. Let's go through in detail to find out fine-grained classification of each individual patterns.
🚩 Ascending/Uptrend Channel
This pattern belongs to the broader classifications - Ascending Patterns, Parallel Patterns and Channels. The rules for the Ascending/Uptrend Channel pattern are as below
Both trend lines are rising
Trend lines are parallel to each other
🚩 Descending/Downtrend Channel
This pattern belongs to the broader classifications - Descending Patterns, Parallel Patterns and Channels. The rules for the Descending/Downtrend Channel pattern are as below
Both trend lines are falling
Trend lines are parallel to each other
🚩 Ranging Channel
This pattern belongs to the broader classifications - Flat Patterns, Parallel Patterns and Channels. The rules for the Ranging Channel pattern are as below
Both trend lines are flat
Trend lines are parallel to each other
🚩 Rising Wedge - Expanding
This pattern belongs to the broader classifications - Rising Patterns, Diverging Patterns and Wedges. The rules for the Expanding Rising Wedge pattern are as below
Both trend lines are rising
Trend Lines are diverging.
🚩 Rising Wedge - Contracting
This pattern belongs to the broader classifications - Rising Patterns, Converging Patterns and Wedges. The rules for the Contracting Rising Wedge pattern are as below
Both trend lines are rising
Trend Lines are converging.
🚩 Falling Wedge - Expanding
This pattern belongs to the broader classifications - Falling Patterns, Diverging Patterns and Wedges. The rules for the Expanding Falling Wedge pattern are as below
Both trend lines are falling
Trend Lines are diverging.
🚩 Falling Wedge - Contracting
This pattern belongs to the broader classifications - Falling Patterns, Converging Patterns and Wedges. The rules for the Converging Falling Wedge are as below
Both trend lines are falling
Trend Lines are converging.
🚩 Rising/Ascending Triangle - Expanding
This pattern belongs to the broader classifications - Rising Patterns, Diverging Patterns and Triangles. The rules for the Expanding Ascending Triangle pattern are as below
The upper trend line is rising
The lower trend line is flat
Naturally, the trend lines are diverging from each other
🚩 Rising/Ascending Triangle - Contracting
This pattern belongs to the broader classifications - Rising Patterns, Converging Patterns and Triangles. The rules for the Contracting Ascending Triangle pattern are as below
The upper trend line is flat
The lower trend line is rising
Naturally, the trend lines are converging.
🚩 Falling/Descending Triangle - Expanding
This pattern belongs to the broader classifications - Falling Patterns, Diverging Patterns and Triangles. The rules for the Expanding Descending Triangle pattern are as below
The upper trend line is flat
The lower trend line is falling
Naturally, the trend lines are diverging from each other
🚩 Falling/Descending Triangle - Contracting
This pattern belongs to the broader classifications - Falling Patterns, Converging Patterns and Triangles. The rules for the Contracting Descending Triangle pattern are as below
The upper trend line is falling
The lower trend line is flat
Naturally, the trend lines are converging.
🚩 Converging Triangle
This pattern belongs to the broader classifications - Bi-Directional Patterns, Converging Patterns and Triangles. The rules for the Converging Triangle pattern are as below
The upper trend line is falling
The lower trend line is rising
Naturally, the trend lines are converging.
🚩 Diverging Triangle
This pattern belongs to the broader classifications - Bi-Directional Patterns, Diverging Patterns and Triangles. The rules for the Diverging Triangle pattern are as below
The upper trend line is rising
The lower trend line is falling
Naturally, the trend lines are diverging from each other.
🎲 Indicator Settings - Auto Chart Patterns
🎯 Zigzag Settings
Zigzag settings allow users to select the number of zigzag combinations to be used for pattern scanning, and also allows users to set zigzag length and depth combinations.
🎯 Scanning Settings
Number of Pivots - This can be either 5 or 6. Represents the number of pivots used for identification of patterns.
Error Threshold - Error threshold used for initial trend line validation.
Flat Threshold - Flat angle threshold is used to identify the slope and direction of trend lines.
Last Pivot Direction - Filters patterns based on the last pivot direction. The values can be up, down, both, or custom. When custom is selected, then the individual pattern specific last pivot direction setting is used instead of the generic one.
Verify Bar Ratio - Provides option to ignore extreme patterns where the ratios of zigzag lines are not proportionate to each other.
Avoid Overlap - When selected, the patterns that overlap with existing patterns will be ignored while scanning. Meaning, if the new pattern starting point falls between the start and end of an existing pattern, it will be ignored.
🎯 Group Classification Filters
Allows users to enable disable patterns based on group classifications.
🚩 Geometric Shapes Based Classifications
Wedges - Rising Wedge Expanding, Falling Wedge Expanding, Rising Wedge Contracting, Falling Wedge Contracting.
Channels - Ascending Channel, Descending Channel, Ranging Channel
Triangles - Converging Triangle, Diverging Triangle, Ascending Triangle Expanding, Descending Triangle Expanding, Ascending Triangle Contrcting and Descending Triangle Contracting
🚩 Direction Based Classifications
Rising - Rising Wedge Contracting, Rising Wedge Expanding, Ascending Triangle Contracting, Ascending Triangle Expanding and Ascending Channel
Falling - Falling Wedge Contracting, Falling Wedge Expanding, Descending Triangle Contracting, Descending Triangle Expanding and Descending Channel
Flat/Bi-directional - Ranging Channel, Converging Triangle, Diverging Triangle
🚩 Formation Dynamics Based Classifications
Expanding - Rising Wedge Expanding, Falling Wedge Expanding, Ascending Triangle Expanding, Descending Triangle Expanding, Diverging Triangle
Contracting - Rising Wedge Contracting, Falling Wedge Contracting, Ascending Triangle Contracting, Descending Triangle Contracting, Converging Triangle
Parallel - Ascending Channel, Descending Channgel and Ranging Channel
🎯 Individual Pattern Filters
These settings allow users to enable/disable individual patterns and also set last pivot direction filter individually for each pattern. Individual Last Pivot direction filters are only considered if the main "Last Pivot Direction" filter is set to "custom"
🎯 Display Settings
These are the settings that determine the indicator display. The details are provided in the tooltips and are self explanatory.
🎯 Alerts
A basic alert message is enabled upon detection of new pattern on the chart.

Trended CVD [Mxwll]Hey!
This indicator "Trended CVD" categorizes price movement by trend (using zig zag) and calculates cumulative volume delta for the entirety of the price move.
Features
CVD calculated for the trend
CVD divergences are distinguished (uptrend and falling CVD / downtrend and rising CVD)
CVD output normalized to scale with chart, and is plotted alongside the trend
Can be used for trend confirmation (CVD trend correlating with price trend)
All regular zig-zag features available
What constitutes a trend is customizable. Can locate small, medium, large price trends with detailed user-input settings.
How-To Use Trended CVD
The image above shows one of two primary uses for the indicator.
In the left-half of the image, price is downtrending simultaneously with CVD; thereby, CVD is confirming the downtrend.
The right-half of the image shows price uptrending simultaneously with CVD; CVD is confirming the uptrend.
This information can be used to classify the "strength" of the price move, and decide to trade with it or against it.
The image above shows the second primary use for the indicator.
A slight price decrease transpires while CVD increases - CVD diverging upwards from the price trend.
This information can be used to classify the strength of the downtrend, and decide to trade against it, or abstain from trading with it.
The image above shows, subsequent to divergence, price failed to sustain "meaningful" downwards movement.
Labels oriented at the final pivot of a trend show the cumulative volume delta for the entirety of the price move (distinguishable by the superimposed zig zag line).
That's really it! A more complex concept integrated with a simple output.
Thank you!

Multi-Timeframe Recursive Zigzag [Trendoscope®]🎲 Welcome to the Advanced World of Zigzag Analysis
Embark on a journey through the most comprehensive and feature-rich Zigzag implementation you’ll ever encounter. Our Multi-Timeframe Recursive Zigzag Indicator is not just another tool; it's a groundbreaking advancement in technical analysis.
🎯 Key Features
Multi Time-Frame Support - One of the rare open-source Zigzag indicators with robust multi-timeframe capabilities, this feature sets our tool apart, enabling a broader and more dynamic market analysis.
Innovative Recursive Zigzag Algorithm - At its core is our unique Recursive Zigzag Algorithm, a pioneering development that powers multiple Zigzag levels, offering an intricate view of market movements. This proprietary algorithm is the backbone of our advanced pattern recognition indicators.
Sub-Waves and Micro-Waves Analysis - Dive deeper into market trends with our Sub-Waves and Micro-Waves feature. Sub-Waves reveal the interconnectedness of various Zigzag levels, while Micro-Waves offer insight into the fundamental waves at the base level.
Enhanced Indicator Tracking - Integrate and track your custom indicators or oscillators with the zigzag, capturing their values at each Zigzag level, complete with retracement ratios. This offers a comprehensive view of market dynamics.
Curved Zigzag Visualization - Experience a new way of visualizing market movements with our Curved Zigzag Display, employing Pine Script’s polyline feature for a more intuitive and visually appealing representation.
Built-in Customizable Alerts - Stay ahead with built-in alerts that can be customized via user input settings.
🎯 Practical Applications
Our Zigzag Indicator is designed with an understanding of its inherent nature - the last unconfirmed pivot that consistently repaints. This characteristic, while by design, directs its usage more towards pattern recognition rather than direct identification of market tops and bottoms. Here's how you can leverage the Zigzag Indicator:
Harmonic Patterns - Ideal for those familiar with harmonic patterns, this tool simplifies the manual spotting of complex XABCD, ABC, and ABCD patterns on charts.
Chart Patterns - Effortlessly identify patterns like Double/Triple Taps, Head and Shoulders, Inverse Head and Shoulders, and Cup and Handle patterns with enhanced clarity. Navigate through challenging patterns such as Triangles, Wedges, Flags, and Price Channels, where the Zigzag Indicator adds a layer of precision to your breakout strategy.
Elliott Wave Components - The indicator's detailed pivot highlighting aids in identifying key Elliott Wave components, enhancing your wave analysis and decision-making process.
🎲 Deep Dive into Indicator Features
Join us as we explore the intricate features of our indicator in more detail.
🎯 Multi-Timeframe Capability
Our indicator comes equipped with an input option for selecting the desired resolution. This unique feature allows users to view higher timeframe Zigzag patterns directly on their lower timeframe charts.
🎯 Recursive Multi Level Zigzag
Our advanced recursive approach creates multi-level Zigzags from lower-level data. For instance, the level 0 Zigzag forms the base, calculated from specified length and depth parameters, while level 1 Zigzag is derived using level 0 as its foundation, and so forth.
The indicator not only displays multiple Zigzag levels but also offers settings to emphasize specific levels for more detailed analysis.
🎯 Sub-Components and Micro-Components of Zigzag Wave
Sub-components within a Zigzag wave consist of the previous level's Zigzag pivots. Meanwhile, the micro-components are composed of the base level (Level 0) Zigzag pivots encapsulated within the wave.
🎯 Curved Zigzag
Experience a new perspective with our curved Zigzag display. This innovative feature utilizes the polyline curved option to automatically generate sinusoidal waves based on multiple points.
🎯 Indicator Tracking
Default indicators such as RSI, MFI, and OBV are included, alongside the ability to track one external indicator at each Zigzag pivot.
🎯 Customizable Alerts
Our indicator employs the `alert()` function for alert creation. While this means the absence of a customization text box in the alert settings, we've included a custom text area for users to create their own alert templates.
Template placeholders include:
{alertType} - type of alert. Either Confirmed Pivot Update or Last Pivot Update. Depends on the alert type selected in the inputs.
When Last Pivot Update type is selected, the alerts are triggered whenever there is a new Zigzag Pivot. This may also be a repaint of last unconfirmed pivot.
When Confirmed Pivot Update type is selected, the alerts are triggered only when a pivot becomes a confirmed pivot.
{level} - Zigzag level on which the alert is triggered.
{pivot} - Details of the last pivot or confirmed pivot including price, ratio, indicator values and ratios, subcomponent and micro-component pivots.
🎲 User Settings Overview
🎯 Zigzag and Generic Settings
This involves some generic zigzag calculation settings such as length, depth, and timeframe. And few display options such as theme, Highlight Level and Curved Zigzag. By default, zigzag calculation is done based on the latest real time bar. An option is provided to disable this and use only confirmed bars for the calculation.
Indicator Settings
Allows users to track one or more oscillators or volume indicators. Option to add any indicator via external input is provided.
🎯 Alert Settings
Has input fields required to select and customize alerts.

Elliott's Quadratic Momentum - Strategy [presentTrading]█ Introduction and How It Is Different
The "Elliott's Quadratic Momentum - Strategy" is a unique and innovative approach in the realm of technical trading. This strategy is a fusion of multiple SuperTrend indicators combined with an Elliott Wave-like pattern analysis, offering a comprehensive and dynamic trading tool. It stands apart from conventional strategies by incorporating multiple layers of trend analysis, thereby providing a more robust and nuanced view of market movements.
*Although the script doesn't explicitly analyze Elliott Wave patterns, it employs a wave-like approach by considering multiple SuperTrend indicators. Elliott Wave theory is based on the premise that markets move in predictable wave patterns. While this script doesn't identify specific Elliott Wave structures like impulsive and corrective waves, the sequential checking of trend conditions across multiple SuperTrend indicators mimics a wave-like progression.
BTC 8hr Long/Short Performance
Local Detail
█ Strategy, How It Works: Detailed Explanation
The core of this strategy lies in its multi-tiered approach:
1. Multiple SuperTrend Indicators:
The strategy employs four different SuperTrend indicators, each with unique ATR lengths and multipliers. These indicators offer various perspectives on market trends, ranging from short to long-term views.
By analyzing the convergence of these indicators, the strategy can pinpoint robust entry signals for both long and short positions.
2. Elliott Wave-like Pattern Recognition:
While not directly applying Elliott Wave theory, the strategy takes inspiration from its pattern recognition approach. It looks for alignments in market movements that resemble the characteristic waves of Elliott's theory.
This pattern recognition aids in confirming the signals provided by the SuperTrend indicators, adding an extra layer of validation to the trading signals.
3. Comprehensive Market Analysis:
By combining multiple indicators and pattern analysis, the strategy offers a holistic view of the market. This allows for capturing potential trend reversals and significant market moves early.
█ Trade Direction
The strategy is designed with flexibility in mind, allowing traders to select their preferred trading direction – Long, Short, or Both. This adaptability is key for traders looking to tailor their approach to different market conditions or personal trading styles. The strategy automatically adjusts its logic based on the chosen direction, ensuring that traders are always aligned with their strategic objectives.
█ Usage
To utilize the "Elliott's Quadratic Momentum - Strategy" effectively:
Traders should first determine their trading direction and adjust the SuperTrend settings according to their market analysis and risk appetite.
The strategy is versatile and can be applied across various time frames and asset classes, making it suitable for a wide range of trading scenarios.
It's particularly effective in trending markets, where the alignment of multiple SuperTrend indicators can provide strong trade signals.
█ Default Settings
Trading Direction: Configurable (Long, Short, Both)
SuperTrend Settings:
SuperTrend 1: ATR Length 7, Multiplier 4.0
SuperTrend 2: ATR Length 14, Multiplier 3.618
SuperTrend 3: ATR Length 21, Multiplier 3.5
SuperTrend 4: ATR Length 28, Multiplier 3.382
Additional Settings: Gradient effect for trend visualization, customizable color schemes for upward and downward trends.

Zigzag Tails [Trendoscope®] 🎲 Introducing Zigzag Tails Indicator by Trendoscope.
The Zigzag Tails Indicator, a groundbreaking tool from Trendoscope, redefines technical analysis by seamlessly integrating anchored VWAPs (Volume Weighted Average Prices) and Average Price calculations with Zigzag pivot points. This advanced indicator recalculates Average Price or VWAP from one Zigzag pivot to the next, offering unparalleled insights into market movements.
🎯 Innovative Design
Each Zigzag pivot can feature up to three distinct tails, corresponding to the high, low, and close prices of each candle. Users have the flexibility to select between Average Price and VWAP for display on their charts. By default, the indicator plots all three tails, but individual tail visibility is customizable via the settings panel.
Average Price Mode: When selected, tails depict the average price across a specified number of bars.
VWAP Mode: In this mode, tails represent the VWAP, calculated for a given price over a set number of bars.
🎯 Dynamic Dotted Tail
The Zigzag Tails Indicator features dotted tails that extend from the last Zigzag pivot to the current bar. These dotted tails dynamically adapt to market changes and are subject to repainting with the emergence of new Zigzag pivots.
When repainting is enabled, the dotted tails originate from the last unconfirmed Zigzag pivot, extending to the current bar. This setting offers a more immediate, albeit tentative, visual representation of market trends.
With repainting disabled, the dotted tails will be anchored from the last confirmed Zigzag pivot to the current bar, providing a more stable but slightly delayed market analysis.
Irrespective of the repaint option, the dotted dynamic tails is always expected to repaint.
🎯 Practical Applications
The Zigzag Tails Indicator provides more accurate support and resistance levels than traditional VWAP, rolling VWAP, or moving averages. Its precision makes it an invaluable tool for identifying trends, as well as potential trend continuations or reversals.
🛠 Indicator Settings
Zigzag Configuration:
Zigzag Length determines the loopback length for the foundational Zigzag calculation.
Number of Bars represent the calculation distance. This limitation is added to avoid runtime errors on lower timeframes. The calculations run through lots of loops. Hence, if it is run across too many bars, we may get timeout issues.
Repaint: Activating this will also display the last, unconfirmed Zigzag pivot. Since the last pivot is inherently tentative, it may repaint with the arrival of new bars. A pivot is confirmed only when a subsequent unconfirmed pivot emerges on the chart.
Tail Configuration
Tail Type: Choose between average and VWAP for the tail calculation. The average option plots a simple average, while the VWAP option calculates an anchored VWAP from pivot to pivot.
Display Options: Tailored display options for High, Low, Close prices, with customizable colors for each tail type.
Inspired by the ideas of @KioseffTrading's implementation of Zigzag Anchored VWAP

Volatility ZigZagIt calculates and plots zigzag lines based on volatility and price movements. It has various inputs for customization, allowing you to adjust parameters like source data, length, deviation, line styling, and labeling options.
The indicator identifies pivot points in the price movement, drawing lines between these pivots based on the deviation from certain price levels or volatility measures.
The script labels various data points at the ZigZag pivot points on the chart. These labels provide information about different aspects of the price movement and volume around these pivot points. Here's a breakdown of what gets labeled:
Price Change: Indicates the absolute and average percentage change between the two pivot points. It displays the absolute or relative change in price as a percentage. Additionally, the average absolute price increase or the average rate of increase can also be labeled.
Volume: Shows the total volume and average volume between the two pivot points.
Number of Bars: Indicates the number of bars between the current and the last pivot point.
Reversal Price: Displays the price of the reversal point (the previous pivot).
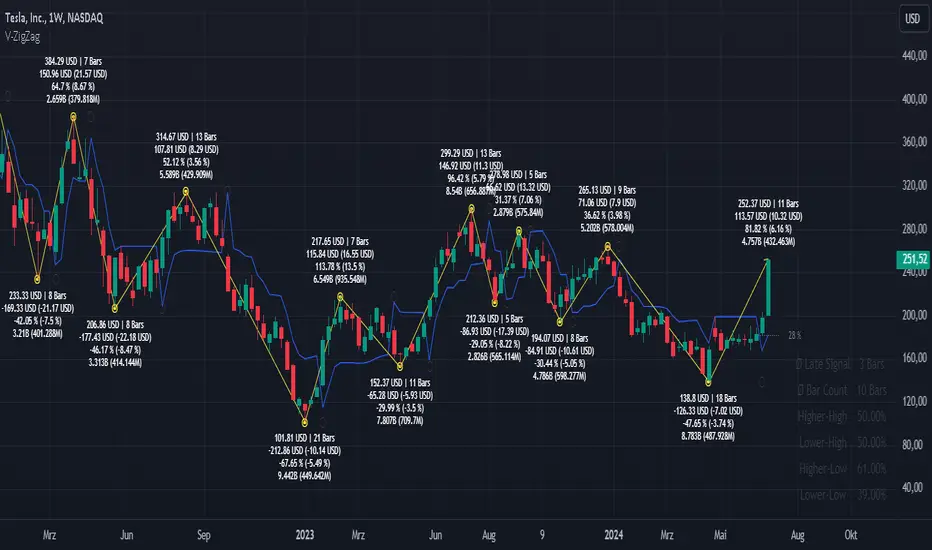
Divergence Indicator [Trendoscope®]🎲 New Divergence Indicator by Trendoscope
Our latest Divergence Indicator revolutionizes the way traders identify market trends and potential reversals. Built upon the robust foundation of the Zigzag Trend Divergence Detector and inline with our recent implementation of the Divergence Goggles indicator, this tool is designed to be intuitive yet powerful, making it an essential addition to any trader's toolkit.
We received several queries on extending the Divergence Goggles to last N bars instead of using an interactive widget. Though it is possible, we thought the better approach is to enable the indicator to use any oscillator and trend indicator in order to define the divergence.
🎯 Key Features
Flexible Oscillator Integration : Choose from a wide range of built-in oscillators or import your own, including options like the innovative Multiband Oscillator. This versatility extends to using volume indicators like OBV for divergence calculations, broadening the scope of analysis.
Trend Identification Versatility : Utilize built-in methods like Zigzag and MA Difference, or integrate external trend indicators. Our system adapts to various methods, ensuring you have the right tools for precise trend identification.
Customizable Zigzag Sensitivity : Adjust the Zigzag based on your chosen oscillator's sensitivity to ensure divergence lines are accurate and visually coherent.
Repainting vs. Delayed Signals : Tailor the indicator to your strategy by choosing between immediate repainting signals and slightly delayed but more stable signals.
🎯 Understanding Divergence: Key Rules
Bullish Divergence
Happens only in downtrend
Observed on Pivot Lows
Price makes lower low whereas oscillator makes higher low, indicating weakness and possible reversal
Bearish Divergence
Happens only in uptrend
Observed on Pivot Highs
Price makes higher high whereas oscillator makes lower high, indicating weakness and possible reversal
Bullish Hidden Divergence
Happens only in uptrend
Observed on Pivot Lows
Price makes higher low, whereas indicator makes lower low due to price consolidation. In bullish trend, this is considered as bullish as the price gets a breather and get ready to surge further.
Bearish Hidden Divergence
Happens only in downtrend
Observed on Pivot Highs
Price makes lower high whereas oscillator makes higher high due to price consolidation. In bearish trend, this is considered as bearish as the price gets a breather and get ready to fall further.
🎯 Visual Insights: Divergence and Hidden Divergence
For a clearer understanding, refer to our visual guides:
🎲 Using the Divergence Indicator: A Step-by-Step Guide
🎯 Step 1 - Selecting the Oscillator
Customize your analysis by choosing from a variety of oscillators or importing your preferred one. Options are available to select a range of built-in oscillators and the loopback length. However, if the oscillator that user want to use is not in the list, they can simply load the oscillator from the indicator library and use it as an external signal.
In our current example, we are using a custom oscillator called - Multiband Oscillator
This also means, the indicator option is not limited to oscillators. Users can even make use of volume indicators such as OBV for the calculation of divergence.
🎯 Step 2 - Choosing the Trend Identification Method
Select from our built-in methods or integrate an external indicator to accurately identify market trends. Trend is one of the key parameters of divergence type identification. Trend can be identified mathematically by various methods. Some of them are as simple as above or below 200 moving average and some can follow trend based indicators such as supertrend and others can be very complex.
To cater for a wider audience, here too we have provided the option to use an external trend indicator. The simple condition for the external trend indicator is that it should return positive value for uptrend and negative value for downtrend.
Other than that, we also have 2 built in trend identification methods.
Zigzag - The trend is defined by the starting pivot of divergence line. If the starting pivot is Higher High or Higher Low, then it is considered uptrend. And if the starting pivot is either Lower Low or Lower High, then we consider it as downtrend.
MA Difference - In this case, the difference between the moving average of pivots joining the divergence line will determine the trend. It is considered uptrend if the moving average increased from starting pivot to ending pivot of the divergence line, and it is considered downtrend if the moving average decreased from starting pivot to the ending pivot of the divergence line.
🎯 Step 3 - Adjusting Zigzag Sensitivity
Fine-tune the Zigzag to match the oscillator's sensitivity, ensuring divergence lines are accurate and visually coherent.
🎯 Step 4 - Managing Repainting
Understand the implications of repainting in the last pivot of the Zigzag and choose between immediate or delayed signals based on your trading strategy. The last pivot of the zigzag repaint by design. This is not necessarily a bad thing. Users can just choose not to use the last pivot, but instead use the last but one for all the calculations. But, this also means, the signals will be delayed.
Indicator provides option to use repainting signal vs delayed signal. If you select the repaint option, the signals are shown immediately as and when they occur. But, there is a possibility that these signals change when the new price candles change zigzag pivot.
If you chose not to select the repaint option, then the divergence signals may lag by a few bars.