Power Peaks & Valleys (Williams Fractals)This indicator uses Williams Fractals (standard indicator on TradingView) as a base to identify Peaks and Valleys (Pivot Points) that usually act as Resistance and Support levels. What this indicator brings is powerful options to filter those Fractals out based on:
Candle Type : calculated based on candle Open and Close (All / Bullish / Bearish)
Minimum Candle Size : calculated based on a lookback of past range of candles and measuring their sizes (None / Average of Candles Range / Max of Candles Range)
With these features, you can decide whether you want all Fractals or specific ones that could be considered major due to their candle type and size where the Fractal appears. Usually, drawing a horizontal level for the inner side of the candle (the High of the Bearish candle Fractal or the Low of the Bullish candle Fractal could see nice reactions for entries.
All features are configurable from the indicator's settings.
Please leave a comment for improvements or suggestions. Alerts and more Candle Types or Minimum Candle Size might be added in the future, as well as the ability to auto draw the levels as soon as they appear or removing them if they get invalidated.
Williams Fractal

[VDB]TrendScalp-FractalBox-3EMAThere are many indicators with William’s Fractal and Alligator. As many use EMA’s it may be useful to define a 3-EMA ribbon and combining Fractal Levels/Box (filling background between top and bottom fractals) for trend scalping. I searched for this kind of indicator in community – some show fractals, some just levels, some with alligator etc. but couldn't find the one needed. Hence thought of this indicator which may be of interest to other users too.
Key Points:
EMA ribbon is created using 3 EMA’s 35/70/105. Users can change these as per their preference. This is used for trend identification – 1. Bullish bias if Price > EMA1 > EMA2 > EMA3. 2. Bearish bias if Price < EMA1 < EMA2 < EMA3.
Background is marked during crossing of EMA1 and EMA2 to alert possible trend change.
5-bar fractals are used to mark the Fractal levels and background between top and bottom fractals are filled to create a Fractal Box.
Fractal levels are marked only when the fractal formation is complete. Given offset is used this is lagging.
How to Use:
Sloping EMA ribbon is used for identifying the trend.
Fractal box break-out/ break-downs are used to trigger the trade with fractal high/low for entry/SL. Waiting for price contraction towards EMA ribbon resulting in smaller boxes is key to initiate trade. Avoid bigger boxes as SL’s will be big and price may move within. To draw the vertical lines of FractalBox change fractal level0 style to step-line.
This indicator combined with the cycle high/low (overbought/oversold) indicators such as CCI/Stochastic/RSI etc. can make it a good trend scalping setup while trading in the direction of momentum in higher timeframe.
This setup could be used for any timeframes. Do your back-testing before using it in live market.
This indicator was achieved by combing some fractal ideas from “Fractal and Alligator Alerts by JustUncleL”
DISCLAIMER : This indicator has been created for educational reference only and do not constitute investment advice. This indicator should not be relied upon as a substitute for extensive independent market research before making your actual trading decisions. Market data or any other content is subject to change at any time without notice. Liability for any loss or damage, including without limitation any loss of profit, which may arise directly or indirectly from use of this indicator is accountability of user using it.

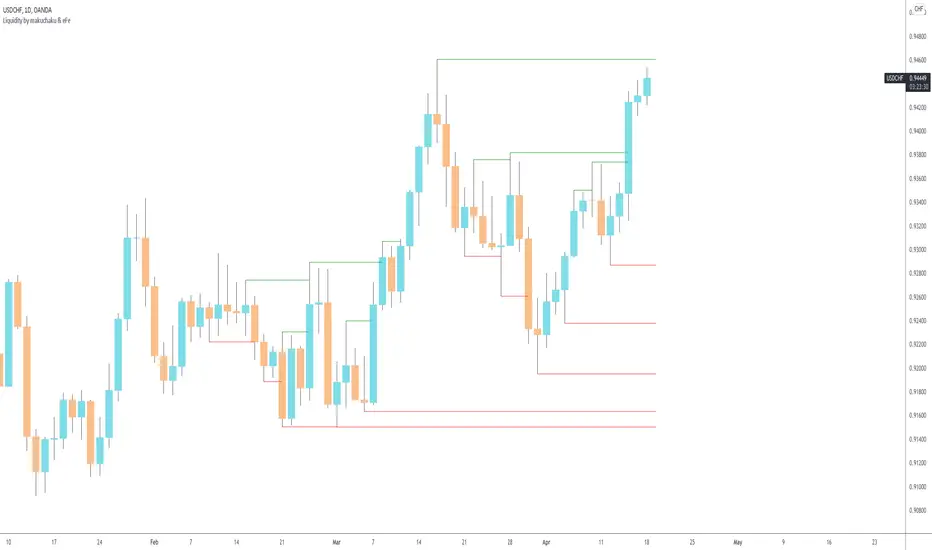
Makuchaku's trading tools - Liquidity visualizerThis indicator plots those pivots/fractals which have not been taken out by price, whereby showing where are the clusters of highs/lows where stop orders (or liquidity) could be hiding.
This is a fantastic tool for taking reversal trades.
Liquidity RaidThe market always seeks liquidity. Liquidity rests above previous highs and below previous lows.
The script highlights the breach of a market structure high or low (W/D/4H/1H), and will alert you on the first fractal break in the opposite direction.
The idea is that the raid happens, and you are only alerted once a candle breaks a fractal and closes in the opposite direction.
When a signal is printed, it does not mean to enter immediately. It just means that there is a fractal break in the opposite direction, and that you will need to assess current price action and market structure for a potential trade on pullback.
You still need to take HTF directional bias, market structure, order blocks and imbalances into consideration.
The script is for trading on on smaller time frames (1/2/3/5m).
Fractal periods, lines and colours are all customizable

5min Williams Fractals scalping (3commas)Another strategy I'm learning Pine Script on. It is inspired by a MoneyZG youtube strategy called "Easy 5 Minute Scalping Strategy (Simple to Follow Scalping Trading Strategy)".
Again this is a one order per trade strategy compatible with the 3commas bot (works also with the free 3commas subscription). This strategy is based on the signals from Williams Fractals, taking the signals in reverse - red triangle indicates a bottom and hence we go long. The green triangle indicates a top so we go short. By default these signals are only accepted if they occur between the two Emas. However, you can also turn this off and when a WF signal comes in, only the current price has to be between the Emas. Stop loss is set to the current Ema slow and the take profit is a multiple of the distance to the slow ema.
Like previously I have added different filters as well as the ability to view essential things like the WF signal and Emas. I hope the script will help you to be more successful and if so it would be great if you could share here your setups, or tips on what would be good to refine to make it an even a more profitable strategy. Kind of a community approach so that we help each other out :).
Instructions for the 3commas connector:
1. First, you need to prepare 3commas Long/Short bots that will only listen to custom TV signals.
2. Inputs for the 3commas bot can be found at the end of the user inputs.
3. Once you have entered the required details into the inputs, turn on 3commas comments. They should appear on the chart (looks messy).
4. Now you can add the alert where you should paste the 3commas Webhook URL: 3commas.io
5. For the alert message text insert the placeholder {{strategy.order.comment}} and delete the rest.
6. Once the alert is saved, you can turn off those 3commas comments to have a clearer chart.
7. With a new alert, the bot and trade should launch.
In the near future I would like to publish more scripts that will carry similar elements as the first two, incl. compatibility with 3commas (I don't have access to another bot system). I will choose some strategies myself, but I will also be glad for some tips on what strategy would be good to do and is still missing here on Tradingview (short youtube videos or brief strategy manuals would be great).
Thanks and keep it up
PS: My screen values starting at Long Target Profit and ending at Pullback NOT greater than: 1.5; 1.5; 0; ON; 1; 2; OFF; 17; 36; ON; 0.05; ON; Chart; 14; 46; 50; 48.5; 51; OFF; 1; ON; 4; 2.

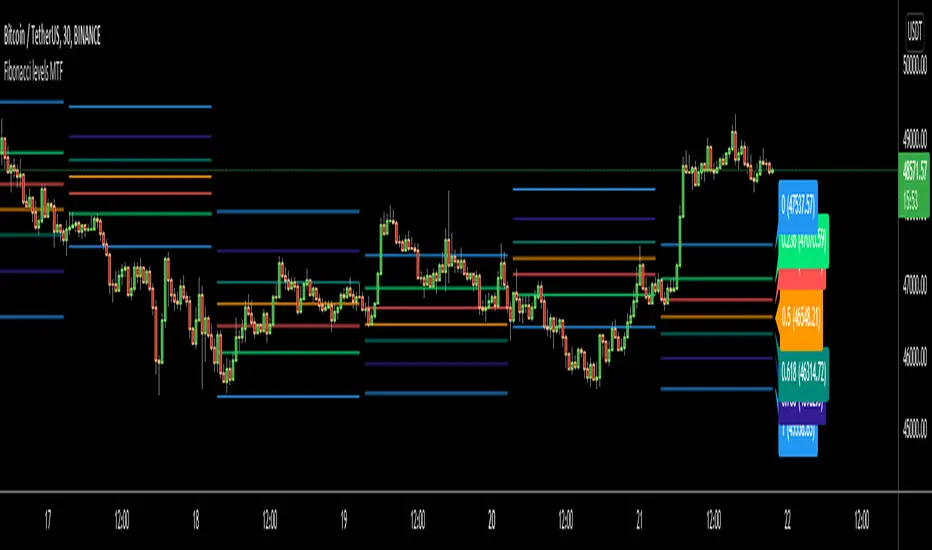
Fibonacci levels MTFHello All,
I got some requests for a script that shows Fibonacci Levels of Higher Time Frame Candles. so I made/published this script. I hope it would be useful for you.
Options:
You can set Higher Time Frame, by default it's 1 Day.
Optionally it can use Current or Last Candle of higher time frame to calculate/show its Fibonacci Levels.
It can show higher time frame candles at the background optionally. You can change its colors.
You can enable/disable/change each Fibonacci levels and their colors.
You can enable/disable Fibonacci Labels that is shown at the right ride and see only Fibonacci lines/levels
example, Fibonacci levels with higher time frame candles:
P.S. if you have ideas to improve this script, drop a comment under the script please
Enjoy!
[JL] How Many Signals last N barsGot this idea after I found Multiple Indicators Screener from QuantNomad.
This script learnt some codes from QuantNomad's great script. Thanks to him.
------------------------------------------------------------------------------------------------------------------------------------------------------------------------
This table show how many signals happened during the last N bars.
I only take care Forex, so this table only has 28 symbols. Feel free to change it.
Calculate the following signals:
RSI cross over/under 50
Short Moving average cross over/under long moving average
Stochastic k cross over/under d
MACD hist cross over/under 0
Williams Fractals: Up and Down fractals happened.
The concept is simple: Range period will always happen more cross signals than the trend period.
When the counter is less than median of all symbols, will be set green color. So more green mean more chance to be trend.

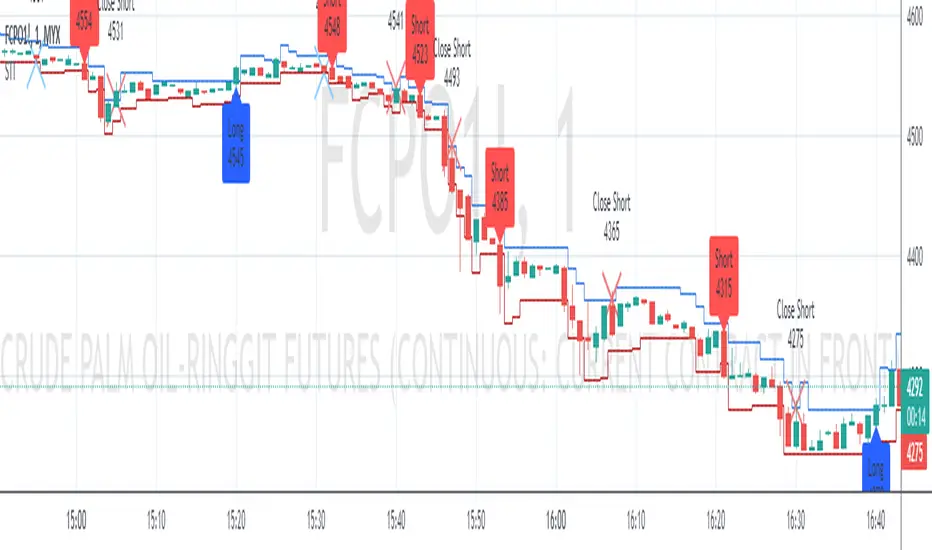
Swing Indicator (Tune for FCPO)Special indicator for FCPO (Crude Palm Oil Futures - Bursa Malaysia Derivative) traders but you can try another instrument.
Trend determination and buy/sell signals are using the Alligator system from Bill Williams.
To get maximum profit, the system uses the trailing stop technique using Average True Range (ATR) with 4 moving average options (RMA, SMA, EMA, WMA).
Please leave comments if any opinions.
Disclaimer
The content is in any event provided with the intention of being for general circulation and availability only. As such it is not intended to and does not form part of any offer or recommendation directed at you specifically, or have any regard to your investment objectives, financial situation, or needs of yourself or any other specific person. Before committing to a trade or investment, please seek advice from financial or other professional advisers regarding the suitability of the trade for you. If you do not wish to seek such financial advice, please consider carefully whether the product is suitable for you as you alone remain responsible for your trading gains and losses.
Fractal Breakout Strategy [KL]Fractal Breakout Strategy
This strategy will enter into a Long position when (a) bullish fractal is formed, combined with (b) ATR is relatively low. Trailing stop loss is set based on ATR.
Bullish fractal pattern :
A bullish fractal pattern looks like this:
It is formed when lower-low has reached a local minimum followed by higher-lows.
By default, this script plots the pivot point (the local minimum) using green crosses. This line will extend to the right until the next bullish fractal is formed. The local minimum pivot point is considered as key level of support. For long position entry, entry price must be higher or equal to it.
On the other hand, a bearish fractal pattern looks like the exact opposite. Reversing the logic, it is a local maximum indicated by higher-highs followed by lower-highs. This is shown by red crosses.
Why use ATR to confirm entry :
Two reasons to enter when ATR is low:
1) Since trailing stop loss is based on ATR, entering the market when ATR is low means risking less for potentially high reward.
2) Low ATR often signals price consolidation. There are two favorable scenarios, either: (i) period of accumulation, or (ii) bull flag, ideally followed by breakout.
Determining whether ATR is low :
Relative lows are quantified out by using the method in my other script: Modified ATR Indicator
The method involves applying two-tailed hypothesis testing to assess whether ATR (ie. by default lookback period of 5) has greatly deviated from a larger sample size (ie. lookback period of 50). Assuming ATR is normally distributed and variance is known, then test statistic (z) can be used to determine whether ATR5 is within the critical area under Null Hypothesis: ATR5 == ATR50. If z falls below/above the left/right critical values (ie. 1.645 for a 90% confidence interval), then ATR is determined to the relatively low/high respectively. For the purpose of assessing whether ATR is low, the left-tail is the main focus.
Profit taking :
Profits by default are taken over 3 levels based on risk to reward ratio (ie. 1R, 2R, 3R). When a target is met at each level, strategy will close out one third of current position size. Remainders (ie. already taken once at 1R, but not yet reaching 2R or 3R) will eventually be closed at the trailing stop loss price.

EneX SignalEneX is signal that give recommendation signals for entry and exit on spot market. This indicators not suitable for leverage trading in futures market.
EneX signal consider several indicators and has entry and exit rules.
EneX signal is suitable for investors who believe in trend following strategy (disclaimer on).
This script composed by Yohan Naftali for educational purpose only. Reader who will use this signal must do own research.
Indicator and Plot Involved
1. Williams Fractals with default periods = 2
2. William Alligator Indicators with default simple moving average 8, 13, and 21
3. Exponential Moving Averages with default value EMA 50, 100, and 200
4. Relative Strength Index with default overbought level = 80 and oversold level = 20
5. Williams Fractals are joined to create support and resistance line and fill area between support and resistance lines.
Entry signal conditions
1. Entry on Weakness when bullish fractal appear on n/2 period
2. Entry when price break resistance line
All entry condition must above EMA and alligator signal and not in overbought RSI
Exit signal conditions
1. Lowest price is below Exponential Moving Average
2. Lowest price is below William alligator lines
You can easily find entry and exit points by using Entry (E), Exit(X) signals
How to use
1. Monitor chart and wait until E or X signals
2. Entry if Entry Signal (E) appear (green colored label)
3. Exit if Exit Signal (X) appear (red colored label)
4. Change indicators setting when necessary
Best Practice
1. Entry only when entry signal (E) appear
2. Never entry when price below William alligator signal
3. Exit when exit signal (X) appear
4. Not exit when exit signal appear when you believe or you have information that price will be rebound
5. Exit if you believe that current price meet your target price
6. Always wise when use EneX signals
Disclaimer
Do your own research and consider fundamental price of asset.
The indicators provided on this script is for educational purposes only.
Author does not offer advisory or brokerage services, nor does it recommend or advise users to buy or sell particular stocks or securities.
Please examined script and give feedback for further improvement.

Forex Fractal EMA ScalperThis is a forex scalper designed for very short timeframes 1-5 min max.
At the same time due to the short timeframe, is recommend to re optimize it weekly .
Its components are
Fractals
Triple EMA with different lengths
Rules for entry:
For long : we have an up fractal and all 3 ema are in ascending order
For short: we have a down fractal and all 3 ema are in descending order.
Rules for exit
We exit when we either get a reverse order or when we hit the take profit or stop loss calculated in fixed pips.

Williams Fractals BUY/SELL signals indicatorThis indicator made with using Williams Fractals, 20 50 100 Moving Averages and Relative Strength Index. You can easily find entry points by using Long (L), Short (S) signals.
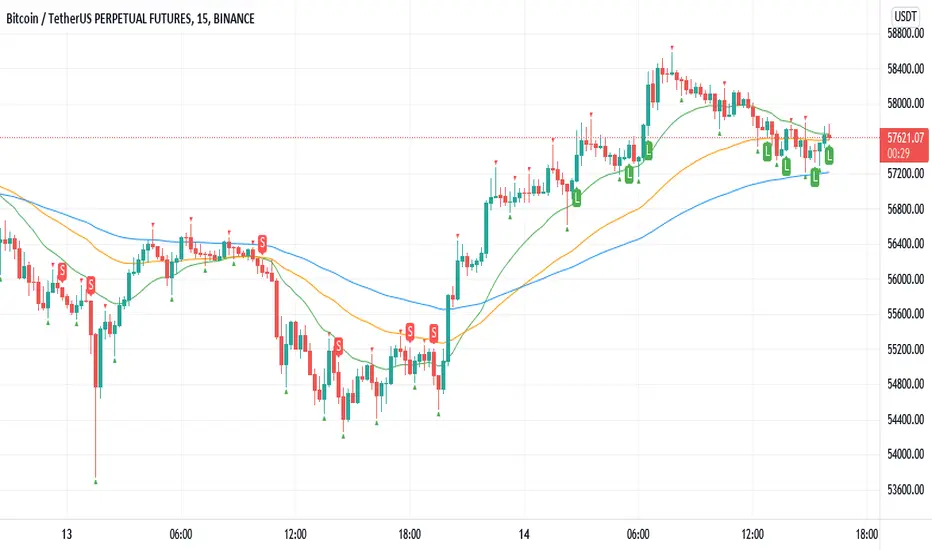
This is a 15min scalping strategy for BTC:USDT Perpetual pair. For use different pairs or TFs you may need to change settings.
How to use
****************
When flashing Long (L) or Short (S) signal you should wait until the candle closing for the confirmation.
After that candle closed with the signal, you can enter a trade in next candle opening.
Your SL should be 3.1% from etnry and TP should be 0.5% from entry for best results. (You can use Long Position / Short Position tool in Prediction and Measurement Tools in drawing pannel to calculate this. This settings only for BTC:USDT Perp 15 min TF. For other TFs or Pairs settings may vary. You can easily change these settings and backtest your own.)
After entering a trade you can be ignored next signals until close the trade.
To learn more about this strategy, please try the "Williams Fractals Strategy" I coded. Thank you!
Williams Fractals StrategyThis indicator made with using Williams Fractals, 20 50 100 Moving Averages and Relative Strength Index. You can easily find entry points by using Long (L), Short (S) signals.
Note : Settings are optimized for BTC:USDT Perpetual 15min TF. For use different pairs or TFs you may need to change settings.

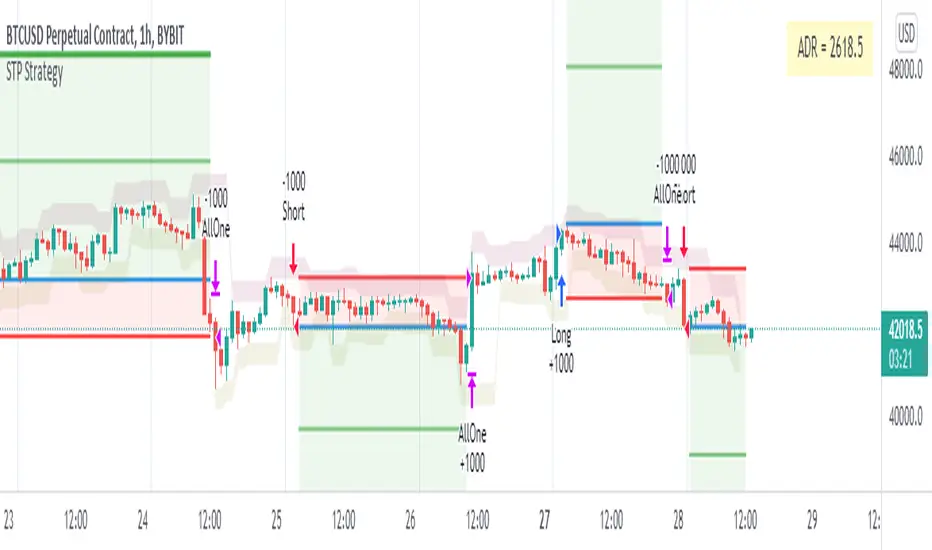
Fractal Corridors BacktestFractal Corridors is a strategy developed a used by Vladimir Poltoratskiy. You can learn about this in his books from the series Trading Code Is Open which I recommend reading.
The strategy allegedly works best in a high-liquidity environment with little to no impactful events. The author likes to trade EURUSD, Copper, and USDCAD, I think, was another pair.
Logic is based on his 3-bar fractals and their fractures as they come. Basically, if the fractal level gets broken by a certain number of ticks (usually 6 - 14% Average Daily Range), a corridor is built and stop-market entry will be filled.
There are other rules you will find in the book. Most importantly - avoid trading during events and extremely choppy symbols which seem to follow no logic.
Lastly, the script includes 5 different definitions of Fractal Corridor. I think Mode 5 is the correct one but I was unable to confirm that exactly as it gets a little tricky. I am willing to disclose this part of the code to other Pinecoders, but it will not be available for everyone, because that could discourage people from getting the book.
Thanks to @mincho1010 for help with testing different versions as I worked on the script.
Have a good day!
Fx Crusher Scalping Indicator V1█ OVERVIEW
Scalping Indicator with Buy and Sell Signals for the 15 min and 5 min Chart. Works on all assets (Crypto, Forex, Stocks, Indices, Commodities and Metals)
Only use in trending markets. Signals in a ranging market are useless.
This Scalping Indicator is different from others because most of the Buy/ Sell signals actually make sense. No counter trend trading and most signals can be very profitable when used right.The single most important goal was to have an indicator that shows signals with a big possible risk reward ratio. Most false signals are filtered out. The Fx Crusher Scalping Indicator is not perfect but it is amazing. You can customize the indicator to get the highest signal quality.
█ HOW DOES IT WORK?
The indicator determines the trend direction by using 3 different smoothed moving averages. A green background shows an uptrend and a red background shows a downtrend.
The strength of the trend is determined by the slope of the individual SMMAs. You can set the slope of every single SMMA for buys and sells individually.
The indicator only shows signals when there is a clear trend on the current timeframe.
Entry signals are generated by a combination of Williams fractals, SMMA crossover, trend angle and RSI condition.
█ HOW TO USE?
Draw Support & Resistance lines on the 4H Chart
Determine the overall trend on the 1H Timeframe
Go to the 15 min or 5 min Time Frame and have a look at the signals
Adjust the slope of every single SMMA in 0.01 steps until the signals look good
Adjust the RSI settings for overbought and oversold condition if necessary
Only enter a trade after the candle that prints a signal is closed.
Only take buy positions when all SMMAs are going up and don’t touch each other
Only take sell positions when all SMMAs are going down and don’t touch each other
Only use this Scalping Indicator with proper Risk management and a risk reward ratio of around 1:2.
Trail your stop to get the most pips out of the signals. Very often the indicator shows signals right before major moves.
█ ADDITIONAL INFO
Be careful with buy signals when the market on the higher timeframe (4H and 1H) is in a downtrend and vice versa.
You can make the most profit out of this Indicator when you enter with 2 positions. A quick scalp and a runner. Because there's a lot of signals with huge risk reward ratios but also some unprofitable signals . Therefore make sure you make the best out of the good signals and apply proper risk management to limit losses with bad signals. Stop loss placement according to market structure.
Multiple Signals in a row can show a high probability of a very strong upcoming move. Monitor your trades and secure partials to make the best out of it.
You can select how many signals it is going to show once trend conditions are met. Please be aware that the longer a trend goes, the higher is the probability of a reversal. Therefore the first few signals after all conditions are met are most likely the most profitable.
By setting the slope of the slow SMMA correctly you can filter out most signals in a ranging market.
█ DISCLAIMER
This is not financial advice. I do everything I can to provide the most accurate buy and sell signals for scalping but past results are no guarantee for future performance.

HPH's FractalTradesThis indicator is based on some dark fractal magic.
Not really, it's inspired by Vladimir Poltoratskiy and basically just waits for the price to go higher or lower than a previous fractal. If that's the case and all the additional settings allow the trade to take place, it is entered with the stop loss at the last opposite fractal of were it was entered (so if we enter a trade because the price went higher than the last up fractal, the sl is at the last down fractal).
The trades are visualised with a stop loss and 3 take profits levels (at a 1:1, 2,1:1 and 4:1 risk/reward ratio). The stop loss will trail once a certain take profit level is reached. Enjoy!
The settings:
LiveVersion : If ticked it will use close for stop losses and take profits. If unticked high and low will be used. Neither is accurate when backtesting as there is no intrabar data...
CancelEarly : Swings trade in the opposite direction when an opposite signal is received. If unticked the trade will continue until a tp or sl is hit.
ShowStats : Show a table in the top right displaying how many times the stop losses or take profits got hit.
FractalPeriods : Number of bars that are required for a fractal. E.g. if it's 2, 2 bars need to be lower on the left and right of a candle for it to print an up fractal.
MinFractalDiv : If this is bigger than 0, it will not allow new fractals to print unless they are at least a percentage based amount bigger than the last one. So this can be used to filter out fractals that are in the same range. Bigger value = more aggressive filtering!
TicksOnFractal : Tick based offset to add onto the fractals to enter trades. E.g. if it's 5 and the price goes above an up fractal, it needs to go up 5 more ticks to enter a trade.
UseFilter, FilterMultMin and FilterMultMax : If ticked, trades are limited to the once in the specified range (distance of the stop loss). E.g. if FilterMultMax is 0.05, the stop loss can not be bigger than 5% of the assets price for the trade to take place.

RSI Centered PivotsJust a simple RSI central pivot strategy I made for a friend.
Backtested on BYBIT:BTCUSD, 155m.
DISCLAIMER : Please do your own research into anything you use before using it to trade.

Fractal Fire Zones/Wave RiderMulti timeframe confluence reader: This indicator plots fractals on any specific timeframe selected, multi time frame ema cross that changes color with the trend, multi timeframe 200ema and a calculation that shows potential turning points with a multi timeframe stochastic oscillator confluence. The fire zones are preferred in a ranging market or for potential scalps while the ema trend is designed to keep you with the main trend in any given session. The accumulation/distribution candles can be used to gauge pull backs for re entry or exits based on time or multiple confirmations.

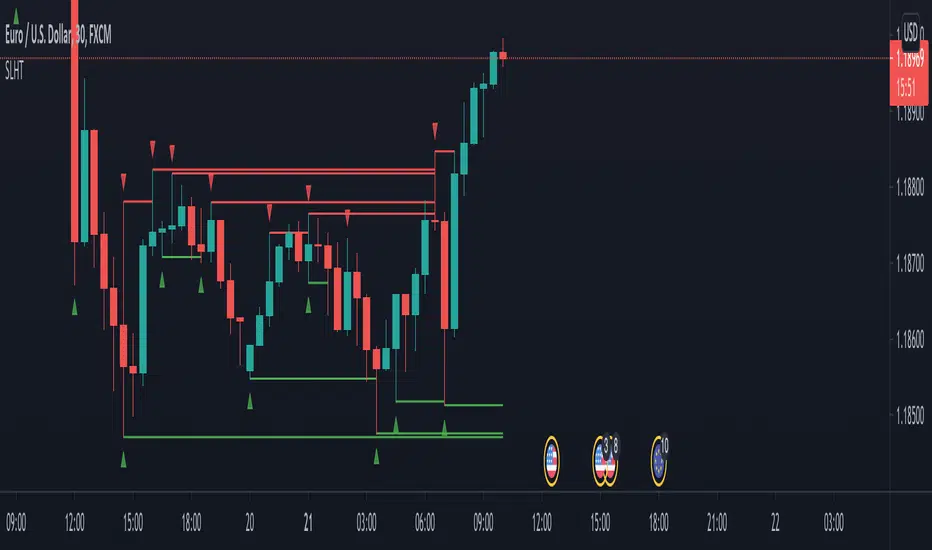
SL Hunter Tracker SL Hunter Tracker
coded by Bogdan Vaida
SL Hunter Tracker is a meticulous hunter that tracks SL hunters.
First it plots the fractals on the chart, then it draws lines from them
to the last wick that touched that height. You can add sweep alerts, once
per bar close, so that you get notified when a wick was touched.
Tested on: EURUSD 30'
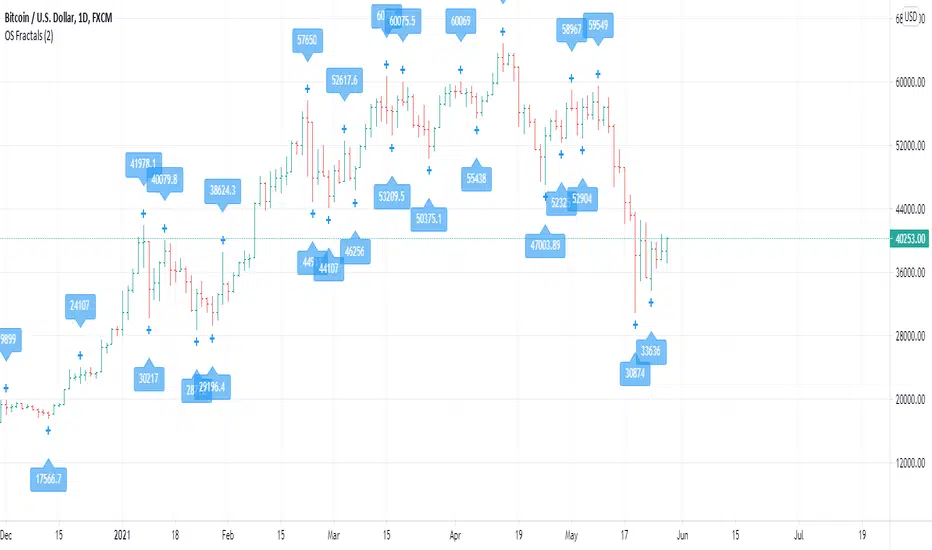
OS FractalsAn up fractal is formed when a high is both preceded and followed by lower highs. A down fractal is formed when a low is both preceded and followed by higher lows.
Bill Williams uses a period of 2 (2 after and 2 before) to define a fractal. This indicator has 2 as default but lets you decide the range you want.
The indicator lets you also select alerts when price crosses an up of down fractal, which would usually mean to entry a position. This indicator works best when used with an alligator, as long signals are valid above the Balance Line and short signals are valid when triggered below the Balance Line.
Any comments for improvement are welcome.
Fractal lines multi time framePlot lines using last two William's fractals to find trends, it supports different resolutions and alerts

Fractals ROC AlertI am playing William's Fractals and got an idea to calculate each fractal's strength by these rules:
- downFractal. FractalROC = (close - lowest(n+1))/(open【2*n】-lowest(n+1))
- upFractal FractalROC = (highest(n+1)-close)/(highest(n+1)-open【2*n】)
And set up a level to filter small fractals.
Bigger FractalROC, Stronger trend

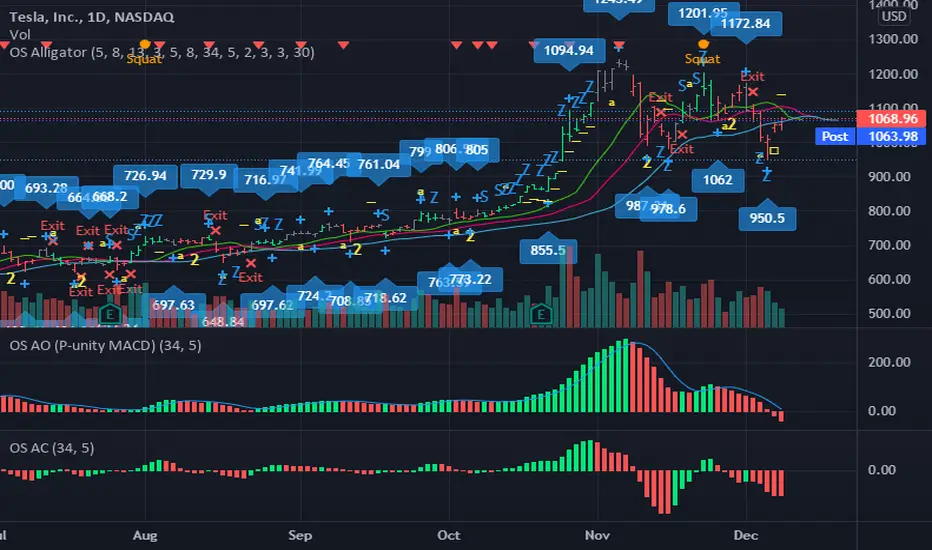
OS AlligatorOS Alligator includes Bill and Justine Williams´ indicators explained both in their "New Trading Dimensions" and "Trading Chaos: Second Edition" books. This script replicates the visual alerts shown on their graphs.
OS Alligator includes:
- Fractals (with labels for easy reading)
- Divergent Bars (signaled by top and bottom triangles)
- Zone bar colors (the bar is green when both AO and AC are green, red when both are red, and black when different)
- Zone buys and sells (subsequent AO of the same color), with letter Z
- Saucer buys and sells, with letter S
- Highest High and Lowest Low tracking (for traling stop setting)
- Balance line (Teeth) crossover alerts
and of course the Alligator's Mouth (Lips, Teeth, Jaw) with SMMA.
All these functions are customizable both in periods and in color. For example if you want to modify the Fractal or HiLo periods you can do so.
You can also add alerts based on any or all indicators.
Thank you for reading. Any comments for improvement are welcome.
-ownsov