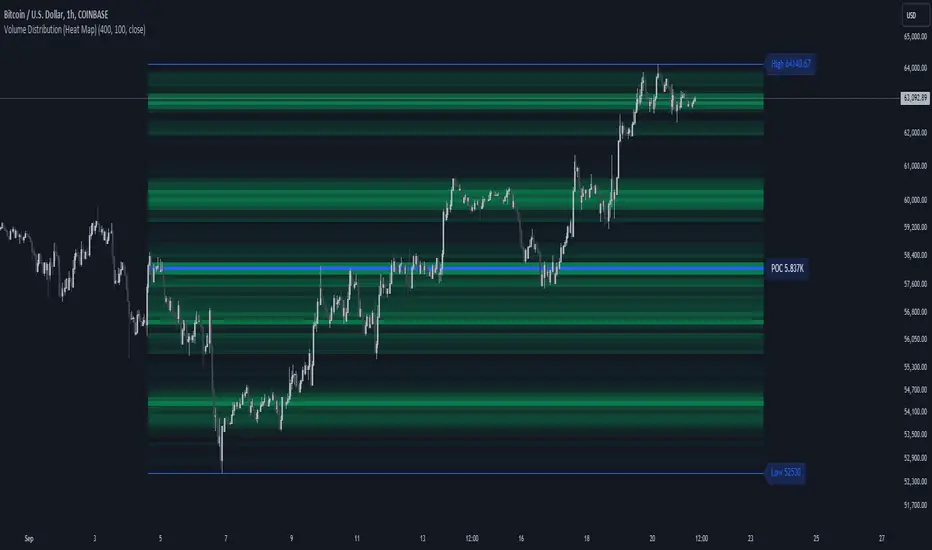
Volume Distribution (Heat Map)This Pine Script indicator, "Volume Distribution (Heat Map)" is designed to visualize the distribution of volume across different price levels over a specified lookback period. Here's a detailed breakdown of its functionality and features:
Indicator Overview
User Inputs
Length: The lookback period for analysis, defaulting to 500 bars.
Source: The price source used for calculations (default is the close price).
Color Intensity: Adjusts the intensity of the heatmap colors, with a default value of 25.
Lines Width: The width of the plotted lines, with a default value of 10.
Main Color: The main color used for the heatmap (default is lime).
Logic
The script iterates through the number of bins, calculates the volume for each bin between highest and lowest prices for length period, and updates the corresponding bin in the freq array if the current bar is allowed.
If the current bar is the last bar, the script plots lines and labels based on the volume distribution.
Heatmap Lines:
Solid lines colored based on the volume in each bin, using a gradient from no color to the main color based on amount of volume.
Highest Volume Line:
A dashed red line indicating the bin with the highest volume.
Labels:
Labels for the highest and lowest prices and the volume at the highest volume bin.
Plots
Highest Price Plot: Plots the highest price within the lookback period if the current bar is within the allowed range.
Lowest Price Plot: Plots the lowest price within the lookback period if the current bar is within the allowed range.
Summary
This indicator provides a visual representation of where trading volume is concentrated across different price levels, forming a heatmap. The highest volume level is highlighted with a dashed red line and a label indicating the volume at that level. This can help traders identify significant price levels where trading activity is clustered.
The "Volume Distribution (Heat Map)" indicator is a valuable tool for traders looking to enhance their technical analysis by incorporating volume data into their price charts. It provides a clear and visual representation of where market participants are most active, aiding in better-informed trading decisions.
Volumeindicator
Volume ScoreVolume Score Indicator (VSCR)
The Volume Score Indicator (VSCR) is a powerful tool designed to enhance your trading analysis by evaluating volume activity relative to historical levels. This indicator provides valuable insights into volume trends, highlighting significant volume spikes and their implications for price movements.
Key Features:
1. Volume Analysis:
a.) Volume (RVol): Calculates the relative volume based on the 50-day simple
moving average.
b.) High Volume Conditions: Identifies conditions where volume is significantly higher
than historical levels, including:
b1.) Highest Volume in 1 Year (HV1Y): Volume exceeds the highest volume of
the year.
b2.) Highest Volume in 3 Months (HVQ): Volume exceeds the highest volume of
the past 3 months.
c.) Pocket Pivot Volume (PPV):
c1.) High Relative Volume: Volume is at least twice the 50-day moving average
volume.
c2.) Pocket Pivot Volume: Latest bar volume is higher than the highest down
volume bar of the last 10 days.
2.Volume Score Calculation:
a.) Computes a cumulative volume score (VSCR) based on the frequency and magnitude
of identified high-volume conditions over a user-defined look-back period (default:
90 days).
b.) Adds points to the volume score based on relative volume (RVol). For example, if
the current day's relative volume is 500% of the 50-day average volume, 5 points
will be added to the volume score.
Formula: Volume Score = Volume Score + (RVol / 100)
3. Customizable Plotting:
a.) High Volume Plotting (HV): Option to plot circles above bars when HV1Y or HVQ
conditions are met.
b.) Pocket Pivot Volume Plotting (PPV): Option to plot circles above bars when any of
the Pocket Pivot Volume conditions are met.
4.Interactive Table Display:
a.) Configurable table to display key volume metrics and scores.
b.) Customizable table layout (horizontal or vertical) and positioning (top, middle,
bottom; left, center, right).
c.) Dynamic Background Coloring: The table cells are color-coded to highlight
significant volume levels and scores:
c1.) Blue: Indicates a very high volume score or count, signaling exceptionally
strong volume activity (e.g., count >= 15, score >= 50).
c2.) Green: Represents a high but not extreme volume level, suggesting notable
volume activity (e.g., 10 <= count < 15, 40 <= score < 50).
c3.) Orange: Marks moderate volume activity, which is still above average but
less pronounced (e.g., 7 <= count < 10, 25 <= score < 40).
c4.) Red: Signifies relatively low volume activity, potentially indicating less
significant volume changes (e.g., count < 7, score < 25).
5.How to Use:
a.) Input Parameters:
a1.) Plot HV: Toggle to plot high volume i.e. HV1Y and HVQ conditions on the
chart. When enabled green plot will appear above the price bars on the
chart.
a2.) Plot PPV: Toggle to plot pocket pivot volume conditions on the chart. When
enabled orange plot will appear above the price bars on the chart.
a3.) Look Back Period: Define the period for looking back to calculate volume
conditions and scores (default: 90 days).
b.) Table Display:
b1.) Panel Options: Customize the table's position, layout, text size, and colors
to suit your preferences.
b2.) Volume Metrics: The table displays counts of high-volume events (HV1Y,
HVQ & PPV) and the cumulative volume score, color-coded based on
thresholds for easy interpretation.
c.) Practical Applications:
c1.) Volume Spike Detection: Quickly identify significant volume spikes that
may indicate institutional buying.
c2.) Historical Volume Context: Understand current volume activity in the
context of historical volume patterns.
c3.) Enhanced Decision Making: Use volume insights to make informed trading
decisions, particularly around areas of significant volume changes.
This indicator is an essential tool for traders looking to incorporate volume analysis into their trading strategy, providing clear and actionable insights into volume dynamics.
***Note***
Candlestick Exclusion: The indicator ignores any candles where the closing price is less than the opening price. All calculations and analysis are based on candles where the closing price is higher than the opening price.

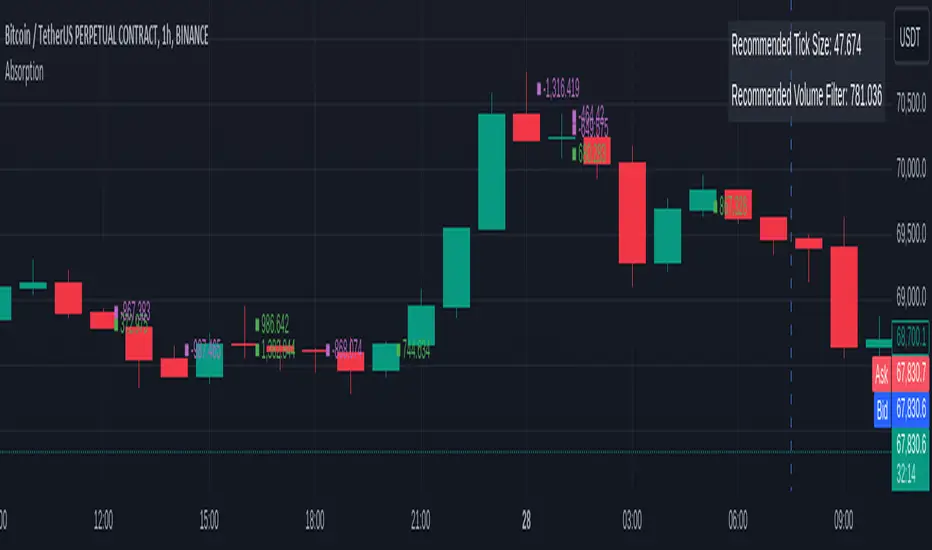
OrderFlow Absorption IndicatorWhat it Does
The OrderFlow Absorption Indicator marks areas where the price absorbs a large volume of aggressive market trades. This indicates areas where price may bounce back due to large limit (resting) orders absorbing significant aggressor volume (market orders). Absorption can also be seen as "preventing" or "stopping" the other side from breaking through a price level (e.g. bids stopping an influx of sell market orders). Absorption may signal a change in sentiment, potentially leading to a pullback or reversal.
An Example of Absorption
Of course, it is not always the case that such bullish absorption will initiate a trend as the example above. The OrderFlow Absorption Indicator merely serves as a tool for spotting possible absorption points in the market which you can incorporate into your trading arsenal.
How it Works
The indicator actively monitors price changes and records volume accumulated at a price level. If the price bounces back to at least where it was before the current price move, the indicator records this as absorption, provided it meets the Volume Requirement and optional Time Requirement.
How to Use it
1. Set Parameters
Choose your desired tick size and volume filter value. If unsure, refer to the table on the top right of the chart for recommended values. An automatic volume limit filter mode is also available.
Automatic Limit Mode : Enable this mode to have the indicator automatically select a volume filter value. It calculates the standard deviation of the last n minutes of volume and multiplies it by a volume multiplier. You can adjust these parameters.
Higher Volume Filter : Setting a higher volume filter value results in fewer, but higher quality detections, reducing noise.
2. Enabling the Time Limit
Enabling the time limit further improves detection quality by filtering out price levels that can defend against quick, sudden aggressive orders, acting as confirmation and indicating strong sentiment and resilient liquidity.
3. Enabling Historical Data Absorption
The indicator can also detect absorption in historical data, though less accurately than in real-time due to OHLCV aggregation.
You can select the granularity of historical data.
Lower granularity (e.g., 1 second) : Provides more accurate detections but may slow down the indicator.
Higher granularity : Improves speed but reduces detection accuracy.
Other Features
Hovering : When hovering over an absorption point, the interface reveals the price where the absorption occurred, along with the volume absorbed by the bids and asks, as well as the volume filter value used.
Delta Mode : In Delta mode, the system calculates the difference between the volume absorbed by bids and asks, revealing points only when the absolute value of this difference exceeds the volume filter value. Especially useful for larger tick sizes.
Troubleshooting
If the indicator doesn't mark anything, it means the traded volume hasn't exceeded the set volume filter value within the specified price intervals(tick size) and time limit. Adjust these settings as necessary.
Volume Spectrum Candles"Volume Spectrum Candles" is a visually intuitive trading indicator that enhances candlestick charts by incorporating trading volume directly into the color of each candle.
Purpose and Utility:
This tool assigns a unique color gradient to candlesticks, which varies from light to dark based on the volume of trades executed. This feature allows traders to immediately recognize and differentiate periods of varying trading activity at a glance.
Target User:
It is specifically designed for traders who integrate volume analysis into their trading strategies, offering a seamless blend of visual cues and technical data.
Benefits:
By providing a visual representation of volume intensity, traders can more effectively identify key market movements, helping to determine optimal entry and exit points. The color gradation adds a layer of quick analysis, making it easier to spot trends in trading volume without the need for additional indicators.
Application and Versatility:
Whether used by day traders to capture short-term price movements or by long-term investors to gauge broader market sentiment, "Volume Spectrum Candles" serves as a valuable addition to any trading setup.

RunRox - Signals MasterSignals Master - meticulously crafted by RunRox, is a versatile tool engineered to accommodate traders of all experience levels. This indicator does not merely suggest potential entry and exit signals; it can seamlessly integrate into your existing trade strategy, enhancing decision-making with its comprehensive features.
With an array of functionalities, Signals Master stands out as a robust standalone product. It is designed to cater to diverse trading approaches, offering real-time signal detection that allows traders to respond swiftly to market fluctuations.
The true power of Signals Master lies in its ability to simplify complex market data into actionable insights. Whether used as a primary indicator or as a complement to your strategy, it helps clarify the trading path ahead, empowering you with confidence in every trade you make.
Core Features of Signals Master
Real-time buy and sell signal alerts
Adjustable sensitivity for tailored signal precision
Customizable alert settings for efficient strategy execution
Advanced backtesting system for strategy optimization
Multiple take profit and stop loss options
Detailed dashboard display for strategy monitoring and adjustments
Support and resistance level identification
Trend lines and color-coded volume bars for easy trend following
Candlestick pattern recognition to anticipate market moves
In the image below, you can see our indicator at work and the explanations.
On the chart, you see buy and sell signals, as well as potential trade exits. The "X" mark can also be interpreted as a trend reversal and a potential signal for a trend change. But always stick to your own exit strategy!
Autopilot \ Optimization
One of the standout features of our Signals Master indicator is its auto-optimization and autopilot capabilities. This function automatically identifies the best settings for specific charts and timeframes, ideal for novice traders.
The autopilot feature simplifies the trading process by continuously adjusting settings to optimize your strategy under varying market conditions. This allows for a more efficient trading experience, focusing on strategy effectiveness rather than constant configuration adjustments.
Signal Mode
The Signal Mode functionality of our Signals Master indicator optimizes signals specifically for either buying or selling, tailoring the best settings to enhance one-directional trading. This feature is particularly useful for traders who prefer to focus exclusively on asset purchases. By optimizing for a single direction, Signal Mode ensures that traders can maximize their strategic approach and efficiency in the markets where they feel most confident. This targeted optimization helps to streamline decision-making processes and improve overall trading precision.
Additional Features
Reversal Zones: This feature identifies potential reversal points in the market, helping traders to spot opportunities where trends might change direction. By marking these zones, traders can anticipate market turns with greater accuracy.
Trend Assistant: Streamline your trend analysis with the Trend Assistant, which highlights ongoing trends and their strength. This tool aids in confirming the trend’s stability, making it easier to decide on entry or exit points.
Neo Cloud: Enhance your market analysis with Neo Cloud, which provides a dynamic visualization of support and resistance levels. This feature helps traders understand the current market state, indicating bullish or bearish conditions.
Candlestick Patterns Detection: Quickly identify key candlestick patterns that signal potential market moves. This detection tool simplifies the complexity of candlestick analysis, allowing for swift, informed trading decisions based on traditional charting techniques.
Volume Candlestick
Enhance your market reading with RunRox’s color-coded volume bars that gauge the strength of buying or selling within each bar. This intuitive feature adds a layer of depth to your analysis, allowing for quick recognition of vital market movements and informed trading decisions.
RISK DISCLAIMER
It is crucial for traders to recognize that while indicators are powerful tools, they should serve as aids rather than definitive solutions. No indicator, including those provided by RunRox, can offer a 100% win rate or replace the need for personal judgment and comprehensive analysis. Our goal is to equip traders with sophisticated instruments that can enhance their understanding and evaluation of market conditions.
We encourage all users of RunRox indicators to utilize them as supplements to their own trading strategies and analyses. The ultimate responsibility for trade decisions lies with the trader, informed by their own knowledge, risk assessment, and market research. Our indicators are designed to support this decision-making process, not to dictate it.

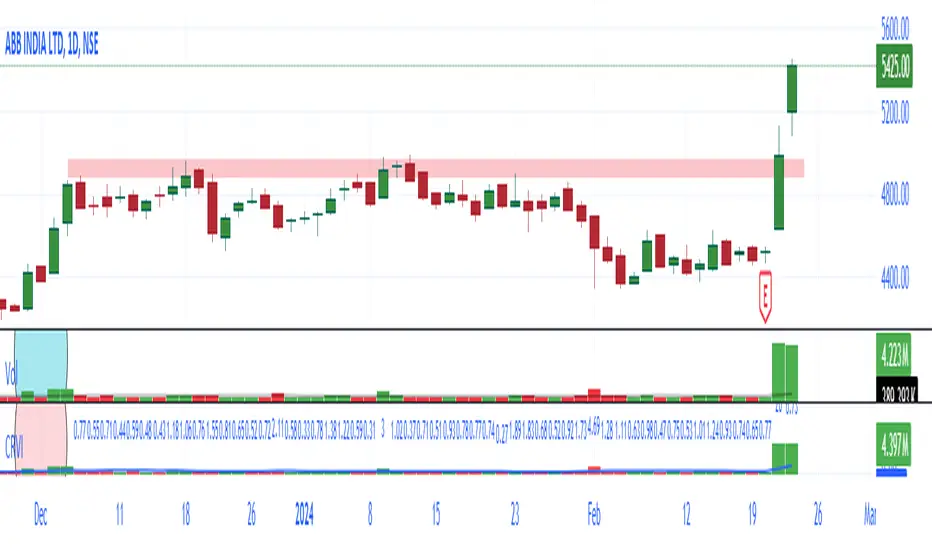
NSE + BSE Volume with Relative Volume Multiplier By AfnanIntroducing the Combined NSE + BSE Volume Indicator with Relative Volume indicator (CRVI).
The Combined NSE + BSE Volume Indicator with Relative Volume Multiplier (CRVI) is an essential tool for Indian traders who are engaged in volume breakout analysis, particularly breakout traders.
Key Features of CRVI:
Combining NSE and BSE Volume: The CRVI consolidates volume data from both the National Stock Exchange (NSE) and the Bombay Stock Exchange (BSE) into a single chart, ensuring that traders do not miss out on vital volume data from either exchange.
Understanding Operator Activity: This indicator gives traders the advantage of identifying whether operators or smart investors are building positions in either exchange. For instance, while observing an NSE stock chart, traders can now identify if operators are building positions in BSE stocks as well.
Add-on to Relative Volume / Volume Breakout Multiplier (RVI) Indicator: The CRVI is an additional feature integrated into the Relative Volume / Volume Breakout Multiplier (RVI) indicator, providing an enhanced perspective on volume dynamics.
Usage of CRVI:
Quantifying Volume Breakouts: The indicator quantifies the degree of volume breakouts concerning the Simple Moving Average (SMA), facilitating a clearer understanding of the strength of volume breakouts.
Relative Volume Interpretation: By comparing the current volume with the volume SMA, the CRVI delivers a breakout number, such as 2.0 for double the volume SMA or 0.50 for half the volume SMA. This assists traders in gauging the momentum and potential trading opportunities more effectively.
Advantages for Traders:
Enhanced Volume Analysis: Breakout traders, in particular, will find the CRVI invaluable for identifying potential trading opportunities and assessing volume strength more accurately.
Essential Toolkit Inclusion: Traders focusing on volume breakout analysis can benefit significantly from incorporating this indicator into their trading toolkit.
Embracing Continuous Improvement:
Every tool and analysis utilized contributes to the ongoing process of becoming more adept traders. Embracing continuous learning and improvement is the foundation of successful trading. As we move forward, armed with the right tools and mindset, we eliminate the doubts of today and pave the way for a more confident tomorrow.
Gratitude :
Your support, likes, and comments are deeply appreciated. If you have any questions, do not hesitate to reach out. Let's work together to make trading an enriching experience!
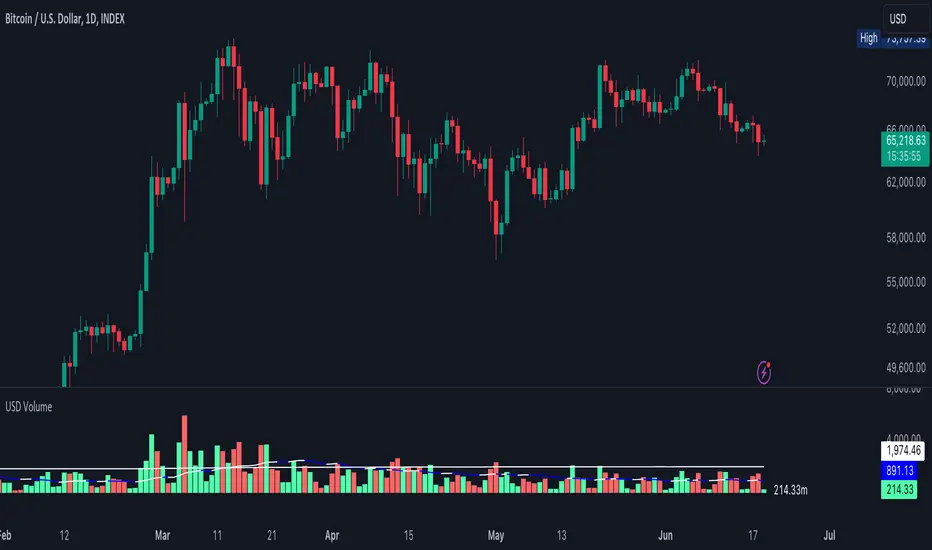
USD VolumeA volume tool but the candles represent Volume in USD Format which is usually
here are some examples of what the numbers represent on the right-hand side.
.01 = $10,000
.5 = $500,000
1 = $1,000,000
50 = $50,000,000
250 = $250,000,000
1000 = $1,000,000,000
The lower line is the "Average Volume" based on lifetime history. Anytime volume is below average, this likely denotes most people have capitulated or the markets have grown bored at these price ranges. A squeeze in volume primes the asset for a big move.
The upper line is the 3rd standard of Deviation from the average line. Anytime volume touches that line or goes higher, this denotes its a very big move relative to how the asset typically trades. If the volume stays above this range for an extended period of time, it would be wise to watch the chart closely and start taking profits off the table whether you're shorting or longing the asset.
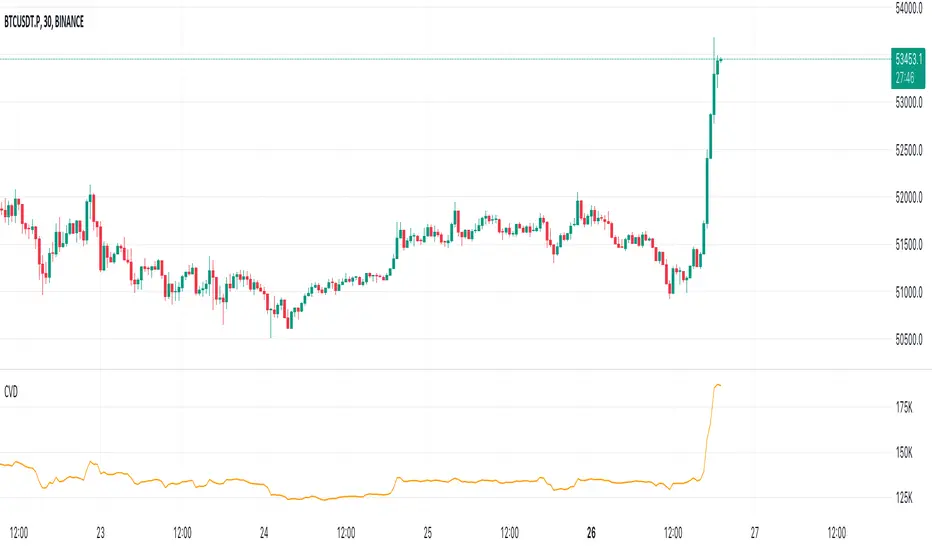
Cumulative Volume Delta (CVD)█ OVERVIEW
Cumulative Volume Delta (CVD) is a volume-based trading indicator that provides a visual representation of market buying and selling pressure by calculating the difference in traded volumes between the two sides. It uses intrabar information to obtain more precise volume delta information than methods using only the chart's timeframe.
Volume delta is the net difference between Buy Volume and Sell Volume. Positive volume delta indicates that buy volume is more than sell volume, and opposite. So Cumulative Volume Delta (CVD) is a running total/cumulation of volume delta values, where positive VD gets added to the sum and negative VD gets subtracted from the sum.
I found simple and fast solution how to calculate CVD, so made plain and concise code, here is CVD function :
cvd(_c, _o, _v) =>
var tcvd = 0.0, delta = 0.0
posV = 0.0, negV = 0.0
totUV = 0.0, totDV = 0.0
switch
_c > _o => posV += _v
_c < _o => negV -= _v
_c > nz(_c ) => posV += _v
_c < nz(_c ) => negV -= _v
nz(posV ) > 0 => posV += _v
nz(negV ) < 0 => negV -= _v
totUV += posV
totDV += negV
delta := totUV + totDV
cvd = tcvd + delta
tcvd += delta
cvd
where _c, _o, _v are close, open and volume of intrabar much lower timeframe.
Indicator uses intrabar information to obtain more precise volume delta information than methods using only the chart's timeframe.
Intrabar precision calculation depends on the chart's timeframe:
CVD is good to use together with open interest, volume and price change.
For example if CVD is rising and price makes good move up in short period and volume is rising and open interest makes good move up in short period and before was flat market it is show big chance to pump.
Volume-Trend Sentiment (VTS) [AlgoAlpha]Introducing the Volume-Trend Sentiment by AlgoAlpha, a unique tool designed for traders who seek a deeper understanding of market sentiment through volume analysis. This innovative indicator offers a comprehensive view of market dynamics, blending volume trends with price action to provide an insightful perspective on market sentiment. 🚀📊
Key Features:
1. 🌟 Dual Trend Analysis: This indicator combines the concepts of price movement and volume, offering a multi-dimensional view of market sentiment. By analyzing the relationship between the closing and opening prices relative to volume, it provides a nuanced understanding of market dynamics.
2. 🎨 Customizable Settings: Flexibility is at the core of this indicator. Users can adjust various parameters such as the length of the volume trend, standard deviation, and SMA length, ensuring a tailored experience to match individual trading strategies.
3. 🌈 Visual Appeal: With options to display noise, the main plot, and background colors, the indicator is not only informative but also visually engaging. Users can choose their preferred colors for up and down movements, making the analysis more intuitive.
4. ⚠️ Alerts for Key Movements: Stay ahead of market changes with built-in alert conditions. These alerts notify traders when the Volume-Trend Sentiment crosses above or below the midline, signaling potential shifts in market momentum.
How It Works:
The core of the indicator is the calculation of the Volume-Trend Sentiment (VTS). It is computed by subtracting a double-smoothed Exponential Moving Average (EMA) of the price-volume ratio from a single EMA of the same ratio. This method highlights the trend in volume relative to price changes.
volumeTrend = ta.ema((close - open) / volume, volumeTrendLength) - ta.ema(ta.ema((close - open) / volume, volumeTrendLength), volumeTrendLength)
To manage volatility and noise in the volume trend, the indicator employs a standard deviation calculation and a Simple Moving Average (SMA). This smoothing process helps in identifying the true underlying trend by filtering out extreme fluctuations.
standardDeviation = ta.stdev(volumeTrend, standardDeviationLength) * 1
smoothedVolumeTrend = ta.sma(volumeTrend / (standardDeviation + standardDeviation), smaLength)
A unique feature is the dynamic background color, which changes based on the sentiment level. This visual cue instantly communicates the market's bullish or bearish sentiment, enhancing the decision-making process.
getColor(volumeTrendValue) =>
sentimentLevel = math.abs(volumeTrendValue * 10)
baseTransparency = 60 // Base transparency level
colorTransparency = math.max(90 - sentimentLevel * 5, baseTransparency)
volumeTrendValue > 0 ? color.new(upColor, colorTransparency) : color.new(downColor, colorTransparency)
bgcolor(showBackgroundColor ? getColor(smoothedVolumeTrend) : na)
In summary, the Volume-Trend Sentiment by AlgoAlpha is a comprehensive tool that enhances market analysis through a unique blend of volume and price trends. Whether you're a seasoned trader or just starting out, this indicator offers valuable insights into market sentiment and helps in making informed trading decisions. 📈📉🔍🌐

High volume candles.
High Volume Candles Indicator:
This is a simple tool that shows you when there's a lot of action in the market. It highlights the candles with the highest trading volume on your chart.
What It Does:
Picks the Busiest Candle: It points out the candle with the most trading in your set time.
Shows Buying and Selling: Green for lots of buying, red for lots of selling.
You Choose the Time Frame: Whether it's a few candles or many, it's up to you.
Best Part - Alerts:
Get Notified: The cool thing? It'll alert you when these big volume candles happen. You won't miss the important moments.
Use this to keep track of when things are really moving in the market, without having to watch your screen all the time.

HTF Volume by Prosum SolutionsOverview of Features
This indicator was inspired by the work of "LonesomeTheBlue" in the script called "Volume Multi Time Frame" . This script will provide a highly customizable interface to specify the higher timeframe period for the volume with the ability to link to the "HTF Candles by Prosum Solutions" indicator using the "HTF Setting Code" data point, as well as adjusting various styling options for the volume bar color fill and border.
Usage Information
The indicator can be applied to any chart at any time frame. When the "Chart" option is chosen for the "Timeframe" field, the indicator will attempt to find a higher timeframe resolution to ensure the volume bars are drawn. The indicator will simply accumulate the volume value for each candlestick bar and reset when the new high timeframe period has started. The color of the volume bars are relative to the higher timeframe setting so that you can visually interpret when the volume in a rising or falling state relative to the higher timeframe price action.
If you choose to add the "HTF Candles by Prosum Solutions" indicator, you can link this indicator to it by choosing the "HTF Candles" option for the "Timeframe Source" field and then choosing the "HTF Setting Code" option for the "HTF Candles" field. At this point, whenever you adjust the high timeframe setting in the "HTF Candles by Prosum Solutions" indicator, this indicator will automatically adjust the timeframe to match it, thereby reducing the steps you need to take to keep the two indicators in sync.
Enjoy! 👍

Relative Volume Candles [QuantVue]In the words of Dan Zanger, "Trying to trade without using volume is like trying to drive a few hundred miles without putting gas in your tank. Trying to trade without chart patterns is like leaving without having an idea how to get there!"
Volume tends to show up at the beginning and the end of trends. As a general rule, when a stock goes up on low volume, it's seen as negative because it means buyers aren't committed. When a stock goes down on low volume, it means that not many people are trying to sell it, which is positive.
The Relative Volume Candles indicator is based on the Zanger Volume Ratio and designed to help identify key volume patterns effortlessly, with color coded candles and wicks.
The indicator is designed to be used on charts less than 1 Day and calculates the average volume for the user selected lookback period at the given time of day. From there a ratio of the current volume vs the average volume is used to determine the candle’s colors.
The candles wicks are color coded based on whether or not the volume ratio is rising or falling.
So when is it most important to have volume? When prices break out of a consolidation pattern like a bull flag or cup and handle pattern, volume plays a role. When a stock moves out of a range, volume shows how committed buyers are to that move.
Note in order to see this indicator you will need to change the visual order. This is done by selecting the the 3 dots next to the indicator name, scrolling down to visual order and selecting bring to front.
Indicator Features
🔹Selectable candle colors
🔹Selectable ratio levels
🔹Custom lookback period***
***TradingView has a maximum 5,000 bar lookback for most plans. If you are on a lower time frame chart and you select a lookback period larger than 5,000 bars the indicator will not show and you will need to select a shorter lookback period or move to a higher time frame chart.
Give this indicator a BOOST and COMMENT your thoughts!
We hope you enjoy.
Cheers!

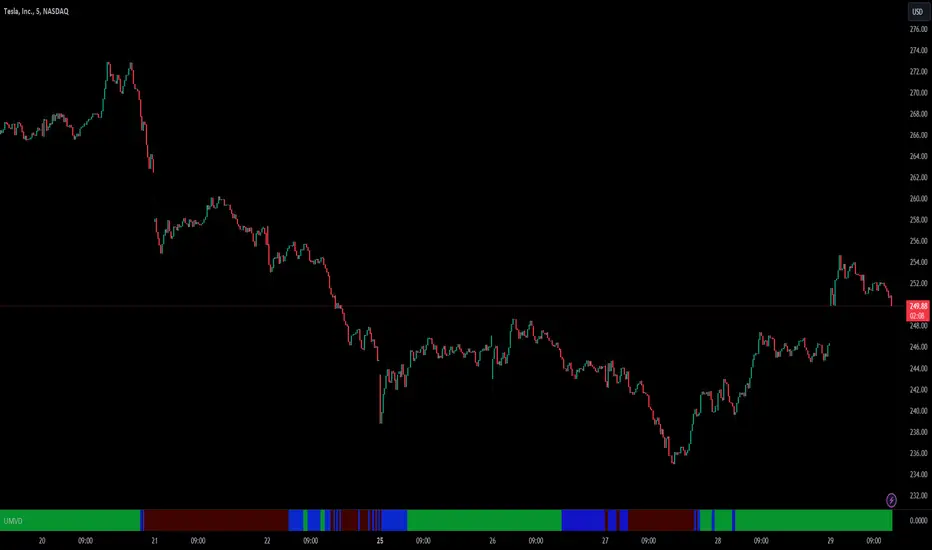
SaAy New Volume ComputationOverview of the Indicator
The "SaAy New Volume Computation" is a trading tool designed to give traders a clear understanding of market volume movements. It overlays on the main trading chart, providing insights into buying and selling pressures.
Key Features of the Indicator
Up and Down Volume Analysis
Buying Pressure (Up Volume) : This metric totals the trading volume on days when the market closes higher than it opens, indicating a bullish or positive market sentiment.
Selling Pressure (Down Volume) : Conversely, this measures the trading volume on days when the market closes lower than it opens, reflecting a bearish or negative sentiment.
Comparative Volume Analysis
Average Volume Comparison : The indicator also compares recent trading volume with the average volume over a set period. This comparison helps identify whether the current trading volume is unusually high or low compared to normal conditions.
Practical Use for Traders
Market Sentiment Understanding : By analyzing the up and down volumes, traders can get a sense of whether the market is dominated by buyers (bulls) or sellers (bears).
Volume Trend Identification: Comparing current trading volumes with the average volume can help traders spot trends or significant changes in market activity. For example, a higher than average volume on a day with rising prices might suggest strong buying interest and a possible continuation of the upward trend.
Conclusion
Overall, the "SaAy New Volume Computation" indicator is a valuable tool for traders. It simplifies the complex task of volume analysis, providing easy-to-understand metrics that indicate market trends and trader sentiment. This can help traders make more informed decisions and better understand the dynamics of the markets they are trading in.

Unusual Market Volume DetectorIntroduction
Price usually moves in lockstep with the volume trends i.e. price goes higher when there is buying and it goes down when there is selling in the market. But sometimes, the market behaves unusually i.e. Price and volume move in opposite directions. This indicator identifies precisely this divergent behavior in the market!
This script analyses the volume trends by utilizing changes in On Balance Volume (OBV) for the instrument and compares it with the price trend to color the lower panel on your chart window. The color changes as the direction of the OBV trend changes from Up to Down or vice versa. If there is a divergence between the price trend and volume trend, the color will switch to Purple.
Divergence in volume and price trends typically indicate a battle between supply and demand. This may coincide with a change in market direction as well. It is important to know which side won after this battle, as the market will follow that side.
This tool will alert traders of unusual market volume behavior and when both price & volume trends are in sync.
Features
A Purple color in the lower panel indicates that the Volume and Price trends are diverging and are moving in the opposite direction
A Green color in the lower panel indicates that the Volume is trending higher supporting bullish price action
A Red color in the lower panel indicates that the Volume is trending lower supporting bearish price action
How to use the Indicator while Trading?
When the Volume trend matches the price action ( Trend ), you have confirmation of your trade bias. Therefore when you are taking Long trades, you would want to see a Green color in the lower panel and a Red color when you are going Short.
When a Divergence is identified by the tool, as Purple color in the lower panel, Trader can take the following steps:
Take profit or partially close the position if you are in a Trade as this divergence presents
uncertainty
Watch for which color comes up after divergence, that side of the market has a higher
probability of prevailing. For example, a Red color indicates Selling in the market and vice
versa.
Divergence usually precedes a market direction change and therefore Trader can take this
into account when planning Trade bias and position size. Please note a divergence does
not always precede a reversal in the market and can be a temporary phenomenon with no
effect on the price action.
Basic Set-Up
Add the Indicator to the chart
You can change the default colors for Buying Volume, Selling Volume, and Divergence
Use the “Regular Trading Hours” Session in the Chart Settings for the most effective analysis
Please note : On-Balance Volume is a leading indicator but it doesn't provide specific information on exactly what happened or why. Also, a large spike in a single day may throw off the On Balance Volume for a while. Therefore we are focusing on its trend and comparing it with Price Trends for better effectiveness.
YD_Volume_Alert"YD_Volume_Alert" is a simple alert based on the increasing volume.
Although it is a simple indicator, strategies to determine accumulation and distribution can be developed using this indicator, which will also be published as well.
📌 Usage, Details and Alert
Using this indicator is simple.
You can enter two scales, "Increased Percentage 1 (%)" and "Increased Percentage 2 (%)", with default values set to 200% and 500%.
Signals are displayed in green and red triangles at the bottom of the bar, also printed with the text "Increased Volume" and "Hugely increased Volume".
Alerts are provided as a combination of the chart's symbol and the set percentage. For example,
"BINANCE:BTCUSDT.P 's Volume : 200% increased."
===========================================================
"YD_Volume_Alert" 는 거래량 증가에 따른 얼러트를 제공하는 간단한 지표입니다.
간단한 지표이지만 위 지표를 이용하여 매집과 매도의 타이밍으로 이용하는 전략 또한 개발할 수 있으며, 이 역시도 퍼블리시 할 예정입니다.
📌 사용 예시와 알림 설정
지표를 사용하는 방법은 간단합니다.
"Increased Percentage 1 (%)" 과 "Increased Percentage 2 (%)" 두 가지의 배율을 입력할 수 있으며, 기본값은 200%와 500%로 설정되어 있습니다.
시그널은 바 하단에 초록색, 빨간색 삼각형으로 각각 표시되며, "Increased Volume"과 "Hugely increased Volume"이라는 텍스트가 함께 출력됩니다.
얼러트는 자신이 설정한 차트의 심볼과 설정한 퍼센티지의 조합으로 제공되며 예를 들면 다음과 같습니다.
"BINANCE:BTCUSDT.P 's Volume : 200% increased."

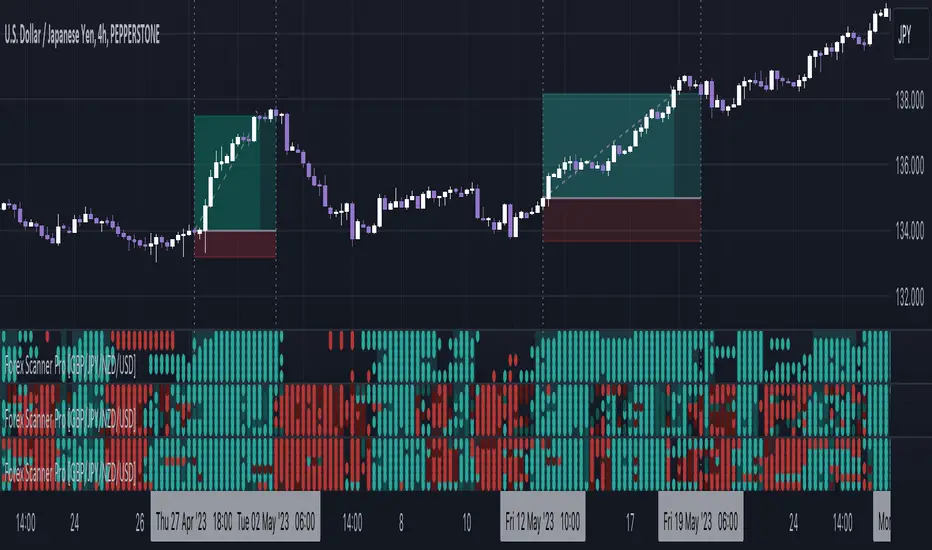
Forex Scanner Pro - GBP/JPY/NZD/USD [FxScripts]Forex Scanner Pro is both a multi-functional indicator and market scanner combined. The combination allows you to have multiple eyes across the market, all from a single chart.
The scanner is comprised of an intuitively designed 3-in-1 tool that tracks the key metrics that drive markets. Each use advanced algorithms to gather information from multiple data points, distilled into one simplified view.
***** TREND SCANNER *****
The first indicator featured on the chart is the Trend Scanner, this allows you to track price action across the wider market. Instantly see pattern shifts and emerging trends; when the market moves, you move with it.
***** MOMENTUM SCANNER *****
The second is the Momentum Scanner which offers a realtime representation of momentum shifts as they occur. This allows you to monitor false breakouts and catch the moves that matter.
***** VOLUME SCANNER *****
The third is the Volume Scanner which provides unique insight into where buy and sell volume is being placed across the market. It offers a further way of determining entry and exit points or simply confirmation that a trend is underway.
***** HOW IT WORKS *****
1. The scanner surveys the market looking for strengths and weaknesses in Trend, Momentum or Volume.
2. It displays the underlying strength or weakness as a series of dots with up to six green dots showing strength and up to six red dots showing weakness.
3. Lighter colored dots are displayed where the strength of the trend, momentum or volume is lesser; if a dot is missing this is a sign of market neutrality.
4. All scanners have a sensitivity setting plus a volatility filter which can be adjusted according to your style of trading and the underlying instrument (full details below).
5. The background can be set to color-fill when the majority of dots are coloured either red or green, with higher values denoting greater strength or greater weakness.
6. Alerts can be configured in the same way as the background to provide both entry and exit signals (further details below).
***** INSTRUMENTS *****
Due to computational restraints, the scanner is split across two different indicators. This one features GBP, JPY, NZD and USD; the other AUD, CAD, CHF and EUR. Both form part of the same package.
Forex Scanner Pro works effortlessly with any of the following major or minor crosses:
AUDCAD, AUDCHF, AUDJPY, AUDNZD, AUDSGD, AUDUSD, CADCHF, CADJPY, CADSGD, CHFJPY, EURAUD, EURCAD, EURCHF, EURGBP, EURJPY, EURNZD, EURSGD, EURUSD, GBPAUD, GBPCAD, GBPCHF, GBPJPY, GBPNZD, GBPSGD, GBPUSD, NZDCAD, NZDCHF, NZDJPY, NZDUSD, SGDJPY, USDCAD, USDCHF, USDJPY, USDSGD
***** SETTINGS OVERVIEW *****
The scanner features the following customizable settings:
~~ Trend Settings ~~
▶ Trend Filter - adjusting this will allow you to focus on short term trends (most suitable for scalping), medium or long term (best for swing trading).
▶ Countertrend Strength - increases the sensitivity of weaker vs stronger countertrends. As countertrends are trends that run against the main trend, this will assist in detecting the strength of a pullback or reversal and allow you to either hold, exit or reverse the trade with confidence.
~~ Momentum Settings ~~
▶ Momentum Filter - increase or decrease the sensitivity of the momentum scanner. Increase to avoid periods of low or weak momentum, decrease to highlight stronger surges in momentum.
~~ Volume Settings ~~
▶ Volume Filter - increase or decrease the sensitivity of the volume scanner. Increase to avoid periods where buy and sell volume can potentially cancel each other out.
~~ Volatility Settings ~~
▶ Volatility Offset - use this to fine tune the volatility filter. A higher value generally delays the volatility filter allowing for confirmation of stronger trends, a lower value will detect trend, momentum or volume movement sooner but may be less accurate.
▶ Each scanner has its own setting allowing you to adjust how you monitor the underlying volatility for each.
▶ As with all settings, we recommend adjusting this to your style of trading, instrument and timeframe.
~~ Alerts ~~
Alerts can be configured to send notifications when anything from 4-6 bullish or bearish dots are showing. Exit markers can be configured when anything from 2+ dots are revealed. This adds an extra layer of sensitivity for traders who appreciate complete control over their trade.
~~ Display Settings ~~
You have the ability to hide all colored dots and only show the background or, alternatively, hide the background and only show colored dots.
***** TRIAL PERIOD *****
We offer a FREE, no questions asked, 7-day trial with every new registration. Visit the link below to register.
Zaree - Bull & Bear Volume VoidThe "Zaree - Bull & Bear Volume Void" (BBVV) indicator is a versatile tool designed to help traders assess the dynamics of bull and bear power in the market, with a focus on volume-based analysis. This indicator offers a range of features that aid in identifying potential shifts in market sentiment and strength.
Details of the Indicator:
Volume Void Color Settings: This indicator allows you to customize the colors used for different conditions, such as strong bull areas, slowing bull areas, strong bear areas, and slowing bear areas. These colors play a crucial role in visualizing the indicator's output.
Volume Void Settings: The BBVV indicator provides options for selecting specific volume void functions, which include "Relative Volume Comparison," "Percentage of Average Volume," "Fixed Volume Threshold," "Volatility-Adjusted Volume," "Compare to Previous Volume Bars," "Volume Percentile Rank," and "Market Session Comparison." Each function has its own criteria for evaluating volume conditions.
Void Bull Sensitivity and Void Bear Sensitivity: These are key parameters in the settings. The values you choose for void bull sensitivity and void bear sensitivity will significantly impact the background color displayed by the indicator. Properly configuring these values is crucial for the indicator's effectiveness.
Moving Average Settings: You can specify the source and length of moving averages used in the indicator. This helps in smoothing out data and providing a clearer picture of bull and bear power.
Void Color Background Conditions: The indicator dynamically changes the background color of the chart based on the current market conditions. It takes into account bull and bear power, as well as the configured sensitivity levels to determine whether the market is in a strong or slowing bull/bear phase.
MACD and Signal Lines: The indicator also displays MACD and signal lines on the chart, helping traders identify potential bullish and bearish crossovers.
Histogram Bars: Histogram bars are used to represent the strength of bull and bear power. Above-zero bars indicate bullish strength, while below-zero bars indicate bearish strength.
How to Use the Indicator:
Begin by customizing the color settings for different market conditions to your preference.
Select a volume void function that aligns with your trading strategy and objectives.
Configure the void bull sensitivity and void bear sensitivity values carefully. These values should reflect your desired sensitivity to volume conditions.
Choose the source and length of moving averages based on your analysis requirements.
Pay attention to the background color of the chart. It will change dynamically based on the current market conditions, providing insights into the strength of bull and bear power.
Observe the MACD and signal lines for potential bullish or bearish crossovers, which can be used as additional confirmation signals.
Interpret the histogram bars to gauge the strength of bull and bear power.
Example of Usage:
As a swing trader with a focus on volume analysis, you can use the BBVV indicator to enhance your trading decisions. Here's an example of how you might use the indicator:
Select "Relative Volume Comparison" as the volume void function to assess volume relative to a simple moving average.
Configure void bull sensitivity and void bear sensitivity to match your risk tolerance and trading style.
Choose "SMA" as the moving average type with a suitable length.
Pay attention to the background color changes in the chart. Strong bull areas may indicate potential bullish opportunities, while strong bear areas may signal bearish conditions.
Monitor the MACD and signal lines for potential crossovers, aligning them with the background color to validate your trading decisions.
Use the histogram bars to assess the strength of bull and bear power, helping you gauge market sentiment.
Remember that the BBVV indicator is a valuable tool to complement your trading strategy. It provides insights into volume dynamics and market conditions, allowing you to make informed trading choices.
Be sure to adjust the indicator settings according to your trading preferences and always consider the broader market context in your analysis.

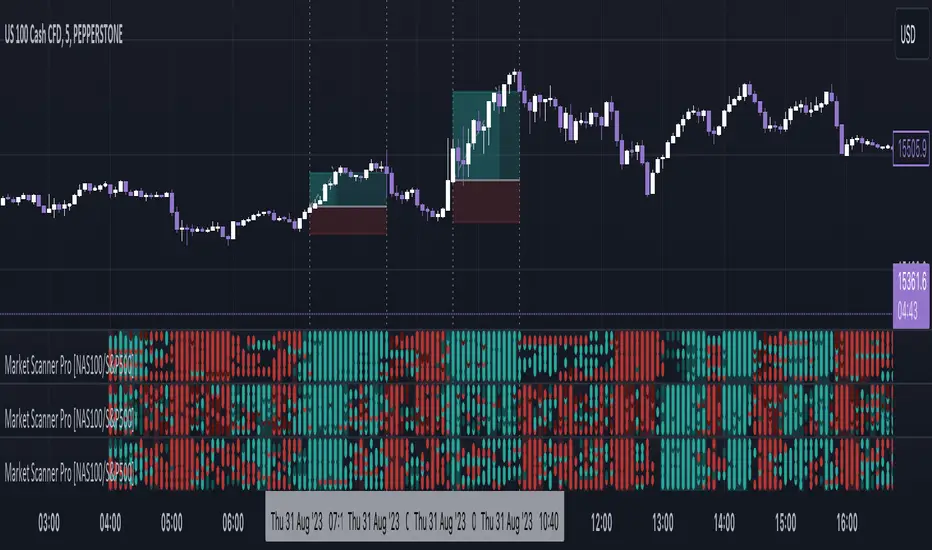
Market Scanner Pro - NAS100/S&P500 [FxScripts]***** OVERVIEW *****
Market Scanner Pro is both a multi-functional indicator and market scanner combined. The combination allows you to have multiple eyes across the market, all from a single chart.
The scanner is comprised of an intuitively designed 3-in-1 tool that tracks the key metrics that drive markets. Each use advanced algorithms to gather information from multiple data points, distilled into one simplified view.
***** TREND SCANNER *****
The first indicator featured on the chart is the Trend Scanner, this allows you to track price action across the wider market. Instantly see pattern shifts and emerging trends; when the market moves, you move with it.
***** MOMENTUM SCANNER *****
The second is the Momentum Scanner which offers a realtime representation of momentum shifts as they occur. This allows you to monitor false breakouts and catch the moves that matter.
***** VOLUME SCANNER *****
The third is the Volume Scanner which provides unique insight into where buy and sell volume is being placed across the market. It offers a further way of determining entry and exit points or simply confirmation that a trend is underway.
***** HOW IT WORKS *****
1. The scanner surveys the market looking for strengths and weaknesses in Trend, Momentum or Volume.
2. It displays the underlying strength or weakness as a series of dots with up to 10 green dots showing strength and up to 10 red dots showing weakness.
3. Lighter colored dots are displayed where the strength of the trend, momentum or volume is lesser; if a dot is missing this is a sign of market neutrality.
4. All scanners have a sensitivity setting plus a volatility filter which can be adjusted according to your style of trading and the underlying instrument (full details below).
5. The background can be set to color-fill when the majority of dots are coloured either red or green, with higher values denoting greater strength or greater weakness.
6. Alerts can be configured in the same way as the background to provide both entry and exit signals (further details below).
***** INSTRUMENTS *****
Market Scanner Pro is made up of both a European and US indices scanner, both forming part of the same package.
European features the DAX40 and FTSE100; US (this scanner) features the NAS100 plus S&P500. The US scanner works on futures and options such as ES, NQ, QQQ, SPX and SPY.
***** SETTINGS OVERVIEW *****
The scanner features the following customizable settings:
~~ Trend Settings ~~
▶ Trend Filter - adjusting this will allow you to focus on short term trends (most suitable for scalping), medium or long term (best for swing trading).
▶ Countertrend Strength - increases the sensitivity of weaker vs stronger countertrends. As countertrends are trends that run against the main trend, this will assist in detecting the strength of a pullback or reversal and allow you to either hold, exit or reverse the trade with confidence.
~~ Momentum Settings ~~
▶ Momentum Filter - increase or decrease the sensitivity of the momentum scanner. Increase to avoid periods of low or weak momentum, decrease to highlight stronger surges in momentum.
~~ Volume Settings ~~
▶ Volume Filter - increase or decrease the sensitivity of the volume scanner. Increase to avoid periods where buy and sell volume can potentially cancel each other out.
~~ Volatility Settings ~~
▶ Volatility Offset - use this to fine tune the volatility filter. A higher value generally delays the volatility filter allowing for confirmation of stronger trends, a lower value will detect trend, momentum or volume movement sooner but may be less accurate.
▶ Each scanner has its own setting allowing you to adjust how you monitor the underlying volatility for each.
▶ As with all settings, we recommend adjusting this to your style of trading, instrument and timeframe.
~~ Alerts ~~
Alerts can be configured to send notifications when anything from 6-10 bullish or bearish dots are showing. Exit markers can be configured when anything from 2+ dots are revealed. This adds an extra layer of sensitivity for traders who appreciate complete control over their trade.
~~ Display Settings ~~
You have the ability to hide all colored dots and only show the background or, alternatively, hide the background and only show colored dots.
***** TRIAL PERIOD *****
We offer a FREE, no questions asked, 7-day trial with every new registration. Visit the link below to register.
Market Scanner Pro - DAX/FTSE [FxScripts]***** OVERVIEW *****
Market Scanner Pro is both a multi-functional indicator and market scanner combined. The combination allows you to have multiple eyes across the market, all from a single chart.
The scanner is comprised of an intuitively designed 3-in-1 tool that tracks the key metrics that drive markets. Each use advanced algorithms to gather information from multiple data points, distilled into one simplified view.
***** TREND SCANNER *****
The first indicator featured on the chart is the Trend Scanner, this allows you to track price action across the wider market. Instantly see pattern shifts and emerging trends; when the market moves, you move with it.
***** MOMENTUM SCANNER *****
The second is the Momentum Scanner which offers a realtime representation of momentum shifts as they occur. This allows you to monitor false breakouts and catch the moves that matter.
***** VOLUME SCANNER *****
The third is the Volume Scanner which provides unique insight into where buy and sell volume is being placed across the market. It offers a further way of determining entry and exit points or simply confirmation that a trend is underway.
***** HOW IT WORKS *****
1. The scanner surveys the market looking for strengths and weaknesses in Trend, Momentum or Volume.
2. It displays the underlying strength or weakness as a series of dots with up to 10 green dots showing strength and up to 10 red dots showing weakness.
3. Lighter colored dots are displayed where the strength of the trend, momentum or volume is lesser; if a dot is missing this is a sign of market neutrality.
4. All scanners have a sensitivity setting plus a volatility filter which can be adjusted according to your style of trading and the underlying instrument (full details below).
5. The background can be set to color-fill when the majority of dots are coloured either red or green, with higher values denoting greater strength or greater weakness.
6. Alerts can be configured in the same way as the background to provide both entry and exit signals (further details below).
***** INSTRUMENTS *****
Market Scanner Pro is made up of both a European and US indices scanner, both forming part of the same package.
European (this scanner) features the DAX40 and FTSE100; US features the NAS100 plus S&P500. The US scanner works on futures and options such as ES, NQ, QQQ, SPX and SPY.
***** SETTINGS OVERVIEW *****
The scanner features the following customizable settings:
~~ Trend Settings ~~
▶ Trend Filter - adjusting this will allow you to focus on short term trends (most suitable for scalping), medium or long term (best for swing trading).
▶ Countertrend Strength - increases the sensitivity of weaker vs stronger countertrends. As countertrends are trends that run against the main trend, this will assist in detecting the strength of a pullback or reversal and allow you to either hold, exit or reverse the trade with confidence.
~~ Momentum Settings ~~
▶ Momentum Filter - increase or decrease the sensitivity of the momentum scanner. Increase to avoid periods of low or weak momentum, decrease to highlight stronger surges in momentum.
~~ Volume Settings ~~
▶ Volume Filter - increase or decrease the sensitivity of the volume scanner. Increase to avoid periods where buy and sell volume can potentially cancel each other out.
~~ Volatility Settings ~~
▶ Volatility Offset - use this to fine tune the volatility filter. A higher value generally delays the volatility filter allowing for confirmation of stronger trends, a lower value will detect trend, momentum or volume movement sooner but may be less accurate.
▶ Each scanner has its own setting allowing you to adjust how you monitor the underlying volatility for each.
▶ As with all settings, we recommend adjusting this to your style of trading, instrument and timeframe.
~~ Alerts ~~
Alerts can be configured to send notifications when anything from 6-10 bullish or bearish dots are showing. Exit markers can be configured when anything from 2+ dots are revealed. This adds an extra layer of sensitivity for traders who appreciate complete control over their trade.
~~ Display Settings ~~
You have the ability to hide all colored dots and only show the background or, alternatively, hide the background and only show colored dots.
***** TRIAL PERIOD *****
We offer a FREE, no questions asked, 7-day trial with every new registration. Visit the link below to register.

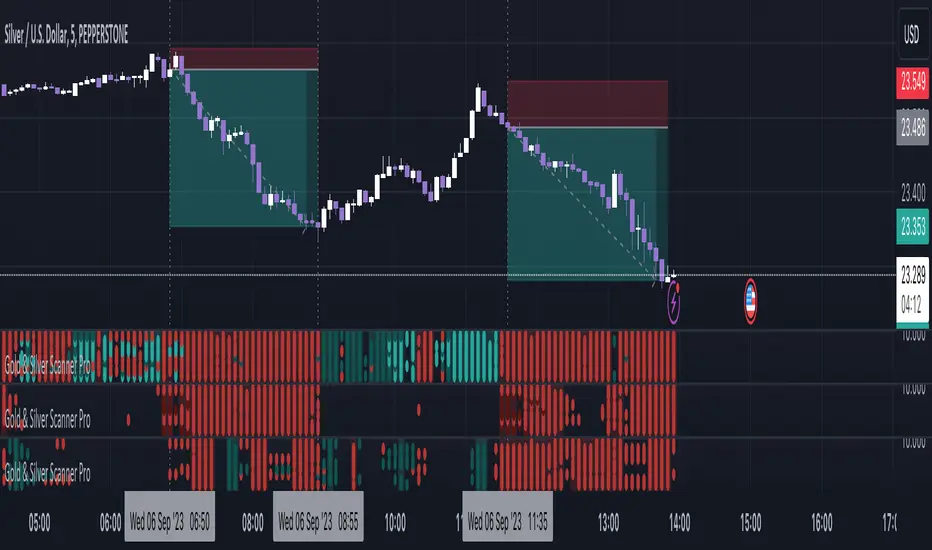
Gold & Silver Scanner Pro [FxScripts]***** FEATURES *****
Gold & Silver Scanner Pro is both a multi-functional indicator and market scanner combined. The combination allows you to have multiple eyes across the market, all from a single chart.
The scanner is comprised of an intuitively designed 3-in-1 tool that tracks the key metrics that drive markets. Each use advanced algorithms to gather information from multiple data points, distilled into one simplified view.
***** TREND SCANNER *****
The first indicator featured on the chart is the Trend Scanner, this allows you to track price action across the wider market. Instantly see pattern shifts and emerging trends; when the market moves, you move with it.
***** MOMENTUM SCANNER *****
The second is the Momentum Scanner which offers a realtime representation of momentum shifts as they occur. This allows you to monitor false breakouts and catch the moves that matter.
***** VOLUME SCANNER *****
The third is the Volume Scanner which provides unique insight into where buy and sell volume is being placed across the market. It offers a further way of determining entry and exit points or simply confirmation that a trend is underway.
***** HOW IT WORKS *****
1. The scanner surveys the market looking for strengths and weaknesses in Trend, Momentum or Volume.
2. It displays the underlying strength or weakness as a series of dots with up to nine green dots showing strength and up to nine red dots showing weakness (nine data points in total).
3. Lighter colored dots are displayed where the strength of the trend, momentum or volume is lesser; if a dot is missing this is a sign of market neutrality.
4. All scanners have a sensitivity setting plus a volatility filter which can be adjusted according to your style of trading and the underlying instrument (full details below).
5. The background can be set to color-fill when the majority of dots are coloured either red or green, with higher values denoting greater strength or greater weakness.
6. Alerts can be configured in the same way as the background to provide both entry and exit signals (further details below).
***** INSTRUMENTS *****
Gold & Silver Scanner Pro works effortlessly with any of the XAG and XAU major or minor crosses:
XAGAUD, XAGCHF, XAGEUR, XAGGBP, XAGJPY, XAGUSD, XAUAUD, XAUCHF, XAUEUR, XAUGBP, XAUJPY, XAUUSD
Plus the following gold and silver futures:
GC, SI
***** SETTINGS OVERVIEW *****
The scanner features the following customizable settings:
~~ Trend Settings ~~
▶ Trend Filter - adjusting this will allow you to focus on short term trends (most suitable for scalping), medium or long term (best for swing trading).
▶ Countertrend Strength - increases the sensitivity of weaker vs stronger countertrends. As countertrends are trends that run against the main trend, this will assist in detecting the strength of a pullback or reversal and allow you to either hold, exit or reverse the trade with confidence.
~~ Momentum Settings ~~
▶ Momentum Filter - increase or decrease the sensitivity of the momentum scanner. Increase to avoid periods of low or weak momentum, decrease to highlight stronger surges in momentum.
~~ Volume Settings ~~
▶ Volume Filter - increase or decrease the sensitivity of the volume scanner. Increase to avoid periods where buy and sell volume can potentially cancel each other out.
~~ Volatility Settings ~~
▶ Volatility Offset - use this to fine tune the volatility filter. A higher value generally delays the volatility filter allowing for confirmation of stronger trends, a lower value will detect trend, momentum or volume movement sooner but may be less accurate.
▶ Each scanner has its own setting allowing you to adjust how you monitor the underlying volatility for each.
▶ As with all settings, we recommend adjusting this to your style of trading, instrument and timeframe.
~~ Alerts ~~
Alerts can be configured to send notifications when anything from 5-9 bullish or bearish dots are showing. Exit markers can be configured when anything from 2+ dots are revealed. This adds an extra layer of sensitivity for traders who appreciate complete control over their trade.
~~ Display Settings ~~
You have the ability to hide all colored dots and only show the background or, alternatively, hide the background and only show colored dots.
***** TRIAL PERIOD *****
We offer a FREE, no questions asked, 7-day trial with every new registration. Visit the link below to register.
Relative Volume at Time (RVolAT) ChartShared for friends, but others are welcome to use.
RVolAT chart, designed for US equity markets, displayed as chart of current bar volume relative to the average volume for that period over a specified number of days. This can be calculated in two ways - see Calculation Mode below.
The chart uses a heatmap to identify RVol, with anything greater than 3 as the highest level. The increments are in 0.5 units.
The chart includes a current indicator using the heatmap colours at the last bar. The label colour will change according to RVol.
Previously I generated a x day, 1440 period array as the basis of calculations, but now that TradingView has released a rvol technical analysis (ta.relativeVolume) I have adopted this. This results in faster processing times, and the results are in line with my previous model.
According to the TV documentation:
Anchor Point
Specifies the size of the period used in the Relative Volume calculation, as described in the Calculation section above. If the "Anchor Timeframe" value is less than or equal to the chart's timeframe, the period will reset on every chart bar, which means the indicator will only use the last N bars in its calculation (where N is the "Length" value).
Lookback period
Specifies the number of historical periods used in the average volume calculation at the current time point. TV uses 5 but I have used 20 as a default setting
Calculation Mode
Specifies the type of volume used in the calculation.
If Cumulative, the indicator uses accumulated volume from the beginning of each period.
If Regular, it uses non-cumulative bar volume
I continually improve my models to add more functionality or styling so watch for updates.

Volume Based RSI with ADXThe RSI indicator is a powerful tool that utilizes both volume and time to determine market trends. When there is a low volume of trades in a short period of time, but the trading activity is high, it is considered bullish or bearish. In the case of a bullish trend, the RSI indicator will display a green color, while a bearish trend will be represented by a red color. If there is no trading activity, the indicator will display a gray color. Additionally, if the ADX level meets the threshold level, the indicator will display a blue color. However, if the ADX level does not meet the threshold level, the indicator will revert back to displaying a gray color.

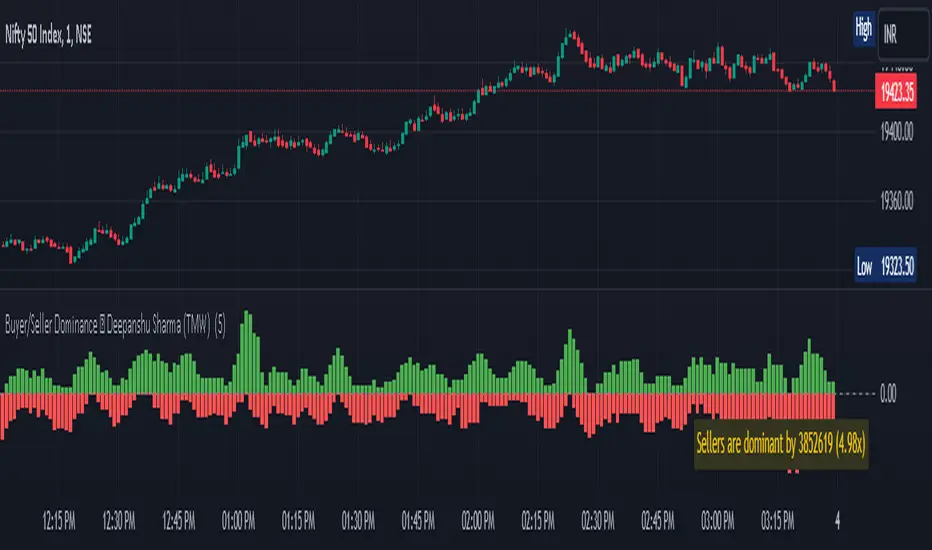
Buyer/Seller Dominance ©TMW
The "Buyer/Seller Dominance" indicator script, developed by Deepanshu Sharma under The Market Wisdom (TMW), is a powerful analytical tool designed for use on the TradingView platform. This script is released under the Mozilla Public License 2.0, and it offers traders and investors an innovative perspective on market dynamics by assessing the relative strength of buyers and sellers within a given time frame.
Key Features:
1. Dominance Calculation: The indicator calculates the dominance of buyers and sellers over a specified number of candles. Users can define the number of candles (`n`) to consider in the dominance calculation.
2. Visual Representation: The script provides a visual representation of buyer and seller dominance using colored columns on the price chart. Green columns represent buyer dominance, while red columns represent seller dominance.
3. Balance Line: The indicator includes a dashed horizontal line at the zero level, representing a balance point between buyer and seller dominance. When the green and red columns cross this line, it signifies shifts in market sentiment.
How it Works:
The script divides the historical price data into segments of specified candle count (`n`) and assesses each segment's dominance. It calculates the volume associated with both green (bullish) and red (bearish) candles within each segment.
If a candle's closing price is higher than its opening price, it is considered a green candle. Similarly, if the closing price is lower than the opening price, the candle is classified as red. The volume of each respective type of candle is then accumulated for each segment.
The script plots the cumulative green candle volume as the "Buyer Dominance" column and the cumulative red candle volume as the "Seller Dominance" column. This visual representation helps traders gauge the ebb and flow of buyer and seller strength in the market.
Disclaimer :
The indicator is provided for informational purposes only and should not be considered as financial advice. It's important to conduct thorough research and analysis before making any trading decisions. The creator, Deepanshu Sharma, and "The Market Wisdom" team are not responsible for any trading losses incurred based on the usage of this indicator.
Remember that trading involves risks, and historical performance may not necessarily predict future results. Always consider multiple indicators, market trends, and risk management strategies when making trading decisions.