Higher High / Lower Low StrategyThis is a very simple trend following strategy for Day Trading. The premise is to follow the Moving Average for the trend direction and buy/sell the dips and blips in the trend.
1. In an uptrend, when the candle action offers a "dip", or a lower high, the strategy will then buy on the close of the candle that breaks the high of the previous candle.
2. In a downtrend, when the candle action offers a"blip", or a higher low, the strategy will then sell on the close of the candle that breaks the low of the previous candle.
3. The strategy will go Long only or Short only, not both. It must be manually reversed in the settings when a new trend is established.
4. The start month and year allow you to backtest from then until now. It's not one month at a time.
5. The strategy uses a reversal of the Stochastic %K variable as the exist. The setting for Period K controls the exit for backtesting purposes.
6. The strategy uses a moving average to determine the trend. The setting for the Period MA controls the SMA.
7. The strategy has the option of filtering the number of trades based on the direction of the MACD and/or the Signal line. This can either reduce or increase the probability, and is highly dependent on the price action of the instrument.
WARNING: I am not a licensed financial advisor. This script is intended for entertainment purposes only. I highly recommend you manually enter and exit positions per your own Trading Rules, and do not blindly follow any software or recommendation. Use of this script is elective and at your own discretion, and risk.
If you like this script, please give it a Thumb's Up, and leave a comment. If you would like any custom scripts developed, contact me to discuss it. All of my work here is open and available, free of charge. It can be copied and edited to suit your needs.
Volatilität

PMax Explorer STRATEGY & SCREENERProfit Maximizer - PMax Explorer STRATEGY & SCREENER screens the BUY and SELL signals (trend reversals) for 20 user defined different tickers in Tradingview charts.
Simply input the name of the ticker in Tradingview that you want to screen.
Terminology explanation:
Confirmed Reversal: PMax reversal that happened in the last bar and cannot be repainted.
Potential Reversal: PMax reversal that might happen in the current bar but can also not happen depending upon the timeframe closing price.
Downtrend: Tickers that are currently in the sell zone
Uptrend: Tickers that are currently in the buy zone
Screener has also got a built in PMax indicator which users can confirm the reversals on graphs.
Screener explores the 20 tickers in current graph's time frame and also in desired parameters of the SuperTrend indicator.
Also you can optimize the parameters manually with the built in STRATEGY version.
PMax indicator :
Profit Maximizer - PMax is a brand new indicator developed by me.
It's a combination of two trailing stop loss indicators;
One is Anıl Özekşi's MOST (Moving Stop Loss) Indicator
and the other one is well known ATR based SuperTrend
Profit Maximizer - PMax tries to solve this problem. PMax combines the powerful sides of MOST (Moving Average Trend Changer) and SuperTrend (ATR price detection) in one indicator.
Backtest and optimization results of PMax are far better when compared to its ancestors MOST and SuperTrend. It reduces the number of false signals in sideways and give more reliable trade signals.
PMax is easy to determine the trend and can be used in any type of markets and instruments. It does not repaint.
The first parameter in the PMax indicator set by the three parameters is the period/length of ATR.
The second Parameter is the Multiplier of ATR which would be useful to set the value of distance from the built in Moving Average.
I personally think the most important parameter is the Moving Average Length and type.
PMax will be much sensitive to trend movements if Moving Average Length is smaller. And vice versa, will be less sensitive when it is longer.
As the period increases it will become less sensitive to little trends and price actions.
In this way, your choice of period, will be closely related to which of the sort of trends you are interested in.
We are under the effect of the uptrend in cases where the Moving Average is above PMax;
conversely under the influence of a downward trend, when the Moving Average is below PMax.
Built in Moving Average type defaultly set as EMA but users can choose from 8 different Moving Average types like:
SMA : Simple Moving Average
EMA : Exponential Movin Average
WMA : Weighted Moving Average
TMA : Triangular Moving Average
VAR : Variable Index Dynamic Moving Average aka VIDYA
WWMA : Welles Wilder's Moving Average
ZLEMA : Zero Lag Exponential Moving Average
TSF : True Strength Force
Tip: In sideways VAR would be a good choice
You can use PMax default alarms and Buy Sell signals like:
1-
BUY when Moving Average crosses above PMax
SELL when Moving Average crosses under PMax
2-
BUY when prices jumps over PMax line.
SELL when prices go under PMax line.

Donchian Channels Strategy - Long Term TrendFor Educational Purposes. Results can differ on different markets and can fail at any time. Profit is not guaranteed.
This only works in a few markets and in certain situations. Changing the settings can give better or worse results for other markets. This is a longer term trend following strategy that uses Donchian Channels for trend following and uses the upper and lower bands to find price breakouts to enter the market and then uses the middle band as a trailing stop to exit. DCs are known as the original trend following strategy made by Richard Donchian.
Usually the middle band uses the same length of the upper and lower bands in its calculation but I included the default option of using a middle band that is double the length of the other bands, but also an option to use the regular input length that most Donchian strategies use if needed. If long term trends are somehow found, this longer middle band lets the profits run longer and lets you see where the long trends were at if the market had any. The double lengthed middle band looks surprisingly very similar to a 3x ATR trailing stop, which is the recommended setting Wilder suggested for trend following. If a good ATR stop or other trailing stop can't be found, this longer middle band can act as a substitute for it.
For some reason I can't seem to find anything related to Donchian strategies on here despite the popularity and simplicity of it, not even a single working one to my liking, so I made my own. It seems this strategy only works in trending markets. I intentionally handpicked a market that the backtest does well on to illustrate the potential it might have for other markets where trending following strategies might work on and what to expect the results in those might be. Trend following strategies are said to have high profits but at the same time lower accuracy due to the failure rate of being able to catch the right trend. If you all got any suggestions or feedback please let me.

High/low crypto strategy with MACD/PSAR/ATR/EWaveToday I am glad to bring you another great creation of mine, this time suited for crypto markets.
MARKET
Its a high and low strategy, designed for crypto markets( btcusd , btcusdt and so on), and suited for for higher time charts : like 1hour, 4hours, 1 day and so on.
Preferably to use 1h time charts.
COMPONENTS
Higher high and lower low between different candle points
MACD with simple moving average
PSAR for uptrend and downtrend
Trenddirection made of a modified moving average and ATR
And lastly elliot wave oscillator to have an even better precision for entries and exits.
ENTRY DESCRIPTION
For entries we have : when the first condition is meet(we have a succession on higher high or lower lows), then we check the macd histogram level, then we pair that with psar for the direction of the trend, then we check the trend direction based on atr levels with MA applied on it and lastly to confirm the direction we check the level of elliot wave oscillator. If they are all on the same page we have a short or a long entry.
STATS
Its a low win percentage , we usually have between 10-20% win rate, but at the same time we use a 1:30 risk reward ratio .
By this we achieve an avg profit factor between 1.5- 2.5 between different currencies.
RISK MANAGEMENT
In this example, the stop loss is 0.5% of the price fluctuation ( 10.000 -> 9950 our sl), and tp is 15% (10.000 - > 11500).
In this example also we use a 100.000 capital account, risking 5% on each trade, but since its underleveraged, we only use 5000 of that ammount on every trade. With leveraged it can be achieved better profits and of course at the same time we will encounter bigger losses.
The comission applied is 5$ and a slippage of 5 points aswell added.
For any questions or suggestions regarding the script , please let me know.

Bollinger Bands Strategy with Intraday Intensity IndexFor Educational Purposes. Results can differ on different markets and can fail at any time. Profit is not guaranteed.
This only works in a few markets and in certain situations. Changing the settings can give better or worse results for other markets.
This is a mean reversion strategy based on Bollinger Bands and the Intraday Intensity Index (a volume indicator). John Bollinger mentions that the Intraday Intensity Index can be used with Bollinger Bands and is one of the top indicators he recommends in his book. It seems he prefers it over the other volume indicators that he compares to for some reason. III looks a lot like Chaikin Money Flow but without the denominator in that calculation. On the default settings of the BBs, the III helps give off better entry signals. John Bollinger however is vague on how to use the BBs and it's hard to say if one should enter when it is below/above the bands or when the price crosses them. I find that with many indicators and strategies it's best to wait for a confirmation of some sort, in this case by waiting for some crossover of a band. Like most mean reversion strategies, the exit is very loose if using BBs alone. Usually the plan to exit is when the price finally reverts back to the mean or in this case the middle band. This can potentially lead to huge drawdowns and/or losses. Mean reversion strategies can have high win/loss ratios but can still end up unprofitable because of the huge losses that can occur. These drawdowns/losses that mean reversion strategies suffer from can potentially eat away at a large chunk of all that was previously made or perhaps up to all of it in the worst cases, can occur weeks or perhaps up to months after being profitable trading such a strategy, and will take a while and several trades to make it all back or keep a profitable track record. It is important to have a stop loss, trailing stop, or some sort of stop plan with these types of strategies. For this one, in addition to exiting the trade when price reverts to the middle band, I included a time-based stop plan that exits with a gain or with a loss to avoid potentially large losses, and to exit after only a few periods after taking the trade if in profit instead of waiting for the price to revert back to the mean.

ATR Stop Buy StrategyThis strategy trial is let you to giving sell and buy orders with ATR (average true range) and an coefficent for them. it is my first strategy work, needs to be upgraded. USE IT WITH YOUR OWN RISK. IT IS NOT EVEN GUARANTEED TO WORK.
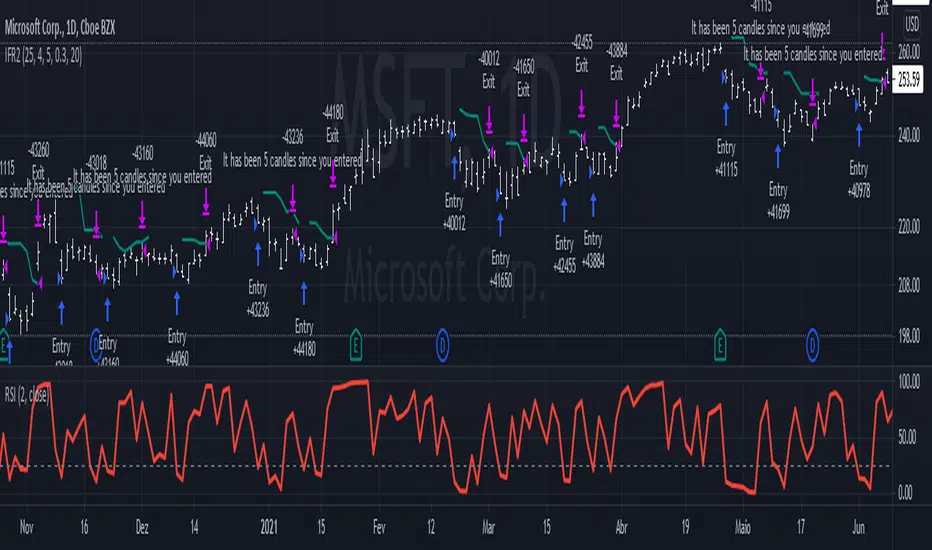
IFR2The IFR2 strategy is based on the RSI indicator.
If the two period RSI is less than the overbought level (25 is the default, but you can configure it to be lower), a long position is placed at the close of the candle. If you are doing it live, you'd have to enter the market ~ 10 minutes before it closes, check the RSI, and buy if it is lower than your overbought level. This generates a discrepancy in the backtesting, but since it is a very small difference, it can be disregarded. Higher overbought levels generate more signals, but they mostly are unreliable. Lower values generates better yields, but they won't occur very often. This strategy is designed to be used in a daily graph, and I don't recommend using it in intraday periods, since you'll make too little money to compensate for the operational cost.
The strategy exits when the high price of two previous candles is reached. If the exit price is higher than the closing price of when you entered, you'll be at a profit, otherwise you'll be at a loss. The exit price is plotted in the graph and it's colors depends on the current open profit: positive values will be green, negative will be red.
This strategy completely disregards the current trend. Long orders will be placed even if you are at a strong down trend. This may seem odd, but you have to keep in mind that this is a volatility based strategy , not a trend following one.
This setup was designed by Alexandre Wolwacz, a.k.a. Stormer.
2 Candles Inside ATR2 agitated candles falling inside ATR range, awaiting possibly a big move.
Buy / Sell signals at combined high / low can be used as order with other as stop loss.
Counter trade, when this minimal stop loss is hit, is also as useful. However, wait till the SL candle closes, before opening position on the other side.
Works quite well on 15 mins chart, with settings of ATR duration 25 and multiplier 0.6. These settings are configurable, so feel free.

Lagged Donchian Channel + EMAThis strategy is based on a lagged 24 periods Donchian Channel and a 200 periods EMA .
The enter positions are calculated this way :
Bull entry
1. we wait for the close of a candle below the channel and it must be below the 200 EMA
2. the following candle must be a green one and close in the lagged channel
3. we put a long order at the close of the second candle, a stop loss at the low of last 3 candles and a x3 take profit
Bear entry
1. we wait for the close of a candle above the channel and it must be above the 200 EMA
2. the following candle must be a red one and close in the lagged channel
3. we put a short order at the close of the second candle, a stop loss at the high of last 3 candles and a x3 take profit
For both long or short positions :
If the order is not filled, it's cancelled if the price reach 50% of the TP or if the price reach the stop loss level
The position is closed if a new bear/bull condition appears in the other side of the position (if a bear appears when you're long and inversement)
Features :
Position calculator's included with leverage option
Labels of position can be plotted or not
Bull/Bear channels can be plotted with red and green filled
All parameters can be changed for backtesting
Better results have been got with defaults parameters on LTCUSDTPERP in H1 timeframe => profit factor of 2.84 with almost 100 positions.
Hope this strategy will be useful and it would be cool if I could get feedback, comments or better combinations of parameters !!
Don't hesitate to like and leave a comment ;)
@Mysteriown

VWAP and BB strategy [EEMANI]This strategy combines VWAP and BB indicators
BUY RULE
1. EMA50 > EMA 200
2. if current close > vwap session value
3. check if price dipped BB lower band for any of last 10 candles
EXIT RULE
1. price closes above BB upper band
STOP LOSS EXIT
1. As configured --- default is set to 5%
warning: for the use of educational purposes only

Configurable BB+RSI+Aroon strategy backtest for binary optionsI wanted to share this strategy that I use myself for binary options trading. After trading binary options for several years I have learned that every single day is unique... assets behave differently every single day. So, when I start the day I want to know which is the optimum combination of parameters in my indicators that will give me the signals I want during the day and I get that by doing a quick backtest of the parameters combination in a specific asset that same day. When trading Binary Options I usually do 3 or 4 trades max per day and, yes, there are moments in which even with the right backtest data the signals fail (I strongly believe that there is no strategy that guarantees 100% success in any type of trade, and this one here is not an exception - but has worked well with some assets). So, here is my contribution to improve your productivity by automating a bit that backtesting part.
How this script works?
It is a simple price crossunder / crossover Bollinger Bands (BB) with a confirmation from RSI overbought / oversold signals and a fast Aroon. You will see the BB plotted with its confirmations:
(1) a blue circle that plots in the chart when the price is coming back inside the channel (within the Bollinger Bands)
(2) an orange square that plots in the chart when the RSI is coming back from the overbought or oversold areas
(3) a triangle that could be red or green depending on the Aroon confirmation: Red if Aroon Down is crossing down Aroon Up or green if vice versa.
The strategy will call for long (Call) if:
(1) the price is crossing over the lower band of the Bollinger Bands, coming back inside the channel
(2) Aroon Up is crossing or has crossed above Aroon Down
(3) RSI is crossing over the oversold limit
Consequently, the strategy will call for a short (Put) if:
(1) the price is crossing down the upper band of the Bollinger Bands, coming back inside the channel
(2) Aroon Down is crossing or has crossed below Aroon Up
(3) RSI is crossing under the overbought limit
You can configure:
1. Aroon length (keep it as fast as possible: 3, 4 or 5 are recommended values)
2. The point where Aroon Up and Aroon Down cross to make the signal valid (50 is by default. It could also be 25 or 75)
3. The RSI length
4. RSI Overbought and Oversold limits (they do not need to be symmetric: you can use 29 and 93, for example)
5. Bollinger Bands length and standard deviation
6. Number of bars to keep your option open. Depending on the timeframe used, this will determine the time you will keep your binary option open. If you are in a 1 min chart and keep this parameter in 3, then you will need to configure your binary option to expire in 3 minutes.
How to evaluate your backtest?
In Binary Options you only need the success rate, so what I do is that when I am manually updating the parameters I keep my strategy tester window open checking the winning trades vs losing trades ratio ("Percent Profitable"). I personally will only keep an asset monitored looking for signals that day if the Percent Profitable on the backtest of the same day is above 80%.
Regarding the code: it is open, public and free. No need to ask for permission if you want to copy+paste and use it in whole or parts.
Happy pip hunting!
-marco

Bollinger band (band display 5σ)Set the color for each bands and indicate the Bollinger bands.
In order to indicate with simple moving average line,hide the bollonger bands line and set the color for bands.
ボリンジャーバンドの帯域ごとに色を設定して表示します。
単純移動平均線と同時表示しても見やすいように、ボリンジャーバンドの線を非表示にして、帯域に色を設定して表示することができます。

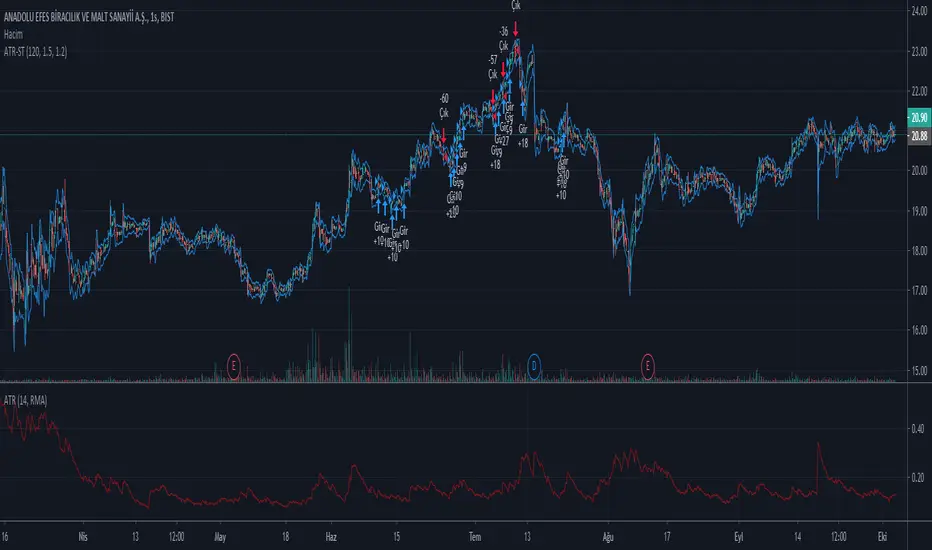
ATR Trailing Stop Strategy by ceyhunSame coding only coloring and strategy version added
//Barcolor
Green = Trail1 > Trail2 and close > Trail2 and low > Trail2
Blue = Trail1 > Trail2 and close > Trail2 and low < Trail2
Red = Trail2 > Trail1 and close < Trail2 and high < Trail2
Yellow = Trail2 > Trail1 and close < Trail2 and high > Trail2
//It gives White color where there is deterioration.
Let's not use InfoPanel in strategy, it would be wrong as it signals the next day.
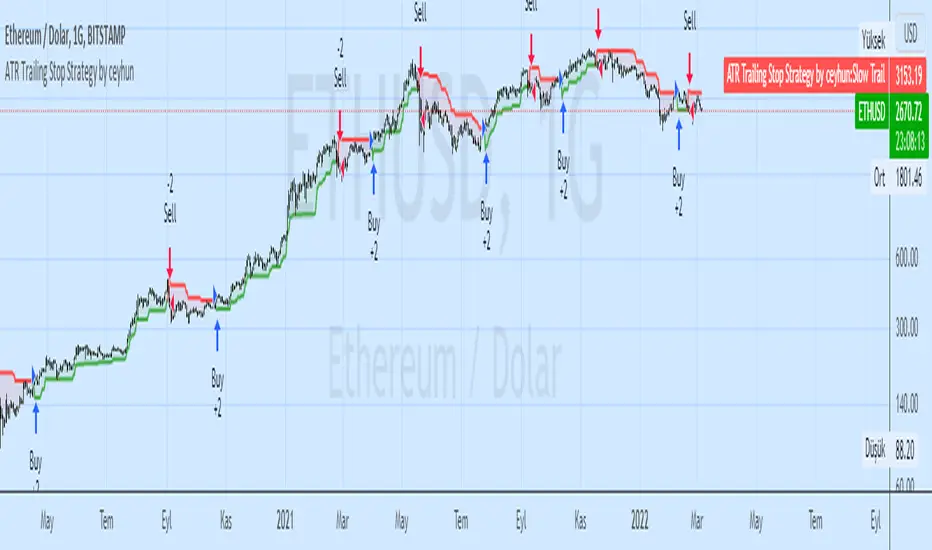
ATR Trailing Stoploss StrategyI am sharing the strategy version of the indicator used before. It is very simple to use.
These are the settings I use, you can change, test and use as you wish.
Atr Period 5
Highest High Period 10
Multiplier 2.5
It can generate more signals in shorter time frames.
The success rate will be higher in longer time frames.

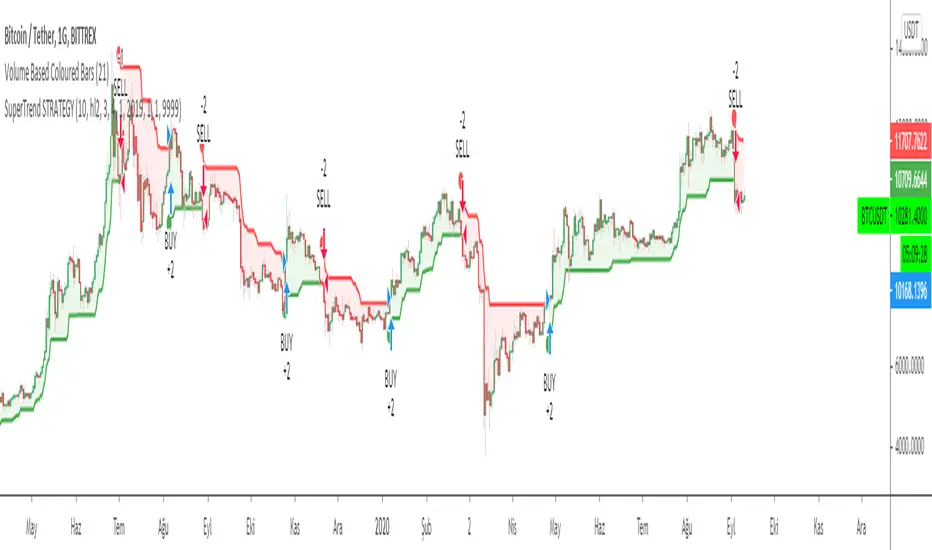
SuperTrend STRATEGYSTRATEGY version of SuperTrend Indicator:
SuperTrend is one of the most common ATR based trailing stop indicators.
In this version you can change the ATR calculation method from the settings. Default method is RMA, when the alternative method is SMA .
The indicator is easy to use and gives an accurate reading about an ongoing trend. It is constructed with two parameters, namely period and multiplier. The default values used while constructing a superindicator are 10 for average true range or trading period and three for its multiplier.
The average true range (ATR) plays an important role in 'Supertrend' as the indicator uses ATR to calculate its value. The ATR indicator signals the degree of price volatility .
The buy and sell signals are generated when the indicator starts plotting either on top of the closing price or below the closing price. A buy signal is generated when the ‘Supertrend’ closes above the price and a sell signal is generated when it closes below the closing price.
It also suggests that the trend is shifting from descending mode to ascending mode. Contrary to this, when a ‘Supertrend’ closes above the price, it generates a sell signal as the colour of the indicator changes into red.
A ‘Supertrend’ indicator can be used on equities, futures or forex, or even crypto markets and also on daily, weekly and hourly charts as well, but generally, it fails in a sideways-moving market.
Source function added to use the indicator as the ATR Trailing Stop indicator.
Just change source type hl2 to close.
different variations might be useful.
Simple and efficient PSAR swing strategyThis is a strategy build inside tradingview, which I found it works great with swing/position trading.
It works based on parabolic sar indicator, when indicator is below the candle, is an uptrend and when its its above is a downtrend.
At the same time it's very nice, because it has a sort of stop loss which is dynamic, because it triggers when candle crosses with indicator, so you dont have to worry about stop loss or take profit .
The key here of course, is going to be the risk management, if you want to success with it, never trade more than 2% of you capital, and if you want you can always apply a rule inside the code to close all position if x % amount of equity was going down, although I recommend have patience and let the system do its job.
I recommend this strategy to be used with charts like 1 day or 1 week. If you need and want I can convert it to an indicator that uses alerts (although with strategy as well can be made to send alerts).
PS. When you add this strategy on chart, inside is has different versions, if you use first version(1), it uses the system I explain above. If you use the last one, its based on risk management when the stop loss is the difference between psar and the candle, but it still needs some adjustments to make.
Overall first one is atm much more profitable, but I believe that the version with risk management can be much better, but it need much more adjustments to make which I dont have the time at the moment for it.
Enjoy it .

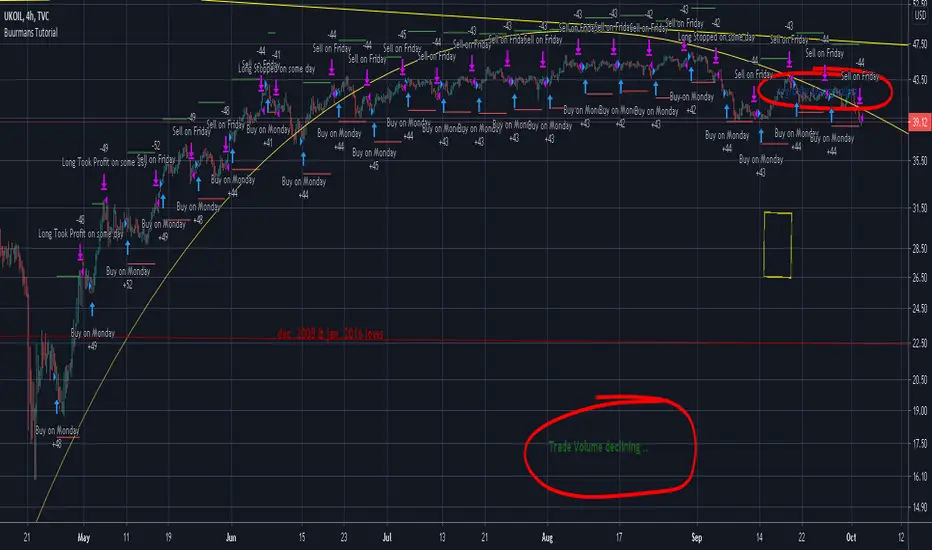
Buurmans TutorialA little Script as part of a Tutorial using Monday as entries and Friday as exits/shorts, with option to Long-Only and a rudimentary Stoploss.
outlined in detail here
can't find a better fitting Category, so bear with me
Trend Indicator with BUY SELL signalsThe Script can be used to identify the main trend and take BUY/SELL decisions in the lower time frames.
The tool can be applied as follows
1) Apply the tool your favorite chart
2) Select the main trend.
3) Go to lower time frames to check the BUY/SELL signals. Example: If the selected main trend is 4 hrs then go to time frames below 4 hrs to find the entry and exit positions.
Feel free to reach out to me if you need any further information

Bollinger Bands Breakout StrategyBollinger Bands Breakout Strategy is the strategy version of Bollinger Bands Filter study version, which can be found under my scripts page. The strategy goes long when price closes above the upper band and goes short signal when price closes below the lower band.
Bollinger Bands is a classic indicator that uses a simple moving average of 20 periods, along with plots of upper and lower bands that are 2 standard deviations away from the basis line. These bands help visualize price volatility and trend based on where the price is, in relation to the bands.
The strategy doesn't take into account any other parameters such as Volume / RSI / Fundamentals etc, so user must use discretion based on confirmations from another indicator or based on fundamentals. The strategy results are based on purely long and short trades and doesn't take into account any user defined targets or stop losses.
The strategy works great when the price closes above/below upper/lower bands with continuation on next bar. It is definitely useful to have this strategy or the Bollinger Bands filter along with other indicators to get early glimpse of breach/fail of bands on candle close during BB squeeze or based on volatility .
This can be used on Heikin Ashi candles for spotting trends, but HA candles are not recommended for trade entries as they don't reflect true price of the asset.
The strategy settings default is 55 SMA and 1 standard deviation for Bollinger Bands filter, but these can be changed from settings.
It is definitely worth reading the 22 rules of Bollinger Bands written by John Bollinger if interested in trading Bollinger Bands successfully.

QuantNomad - Heikin-Ashi PSAR StrategyContinue experimenting with different combinations of strategies.
Here is the PSAR Strategy calculated based on HA candles. HA is already calculated inside the script, do not apply it to HA candles.
Strategy is calculated based on 25% equity invested with 0.1% commission.
####################
Disclaimer
Please remember that past performance may not be indicative of future results.
Due to various factors, including changing market conditions, the strategy may no longer perform as good as in historical backtesting.
This post and the script don’t provide any financial advice.

Varprice4 - Price is the real KingWhen you use any indicators you suffer of lagging and possibile mistakes.
In this case, higher movements of the (daily) prices (long green candle) are a signal that market is appreciating your stock. The variation of a single candle is compared to standard deviation of the stock.
Besides normal money management (on fixed percentages), we have kept the possibily of exiting the position before stop loss adding a multiplier considering that red (or black) candles are normally wider than green (white) ones.

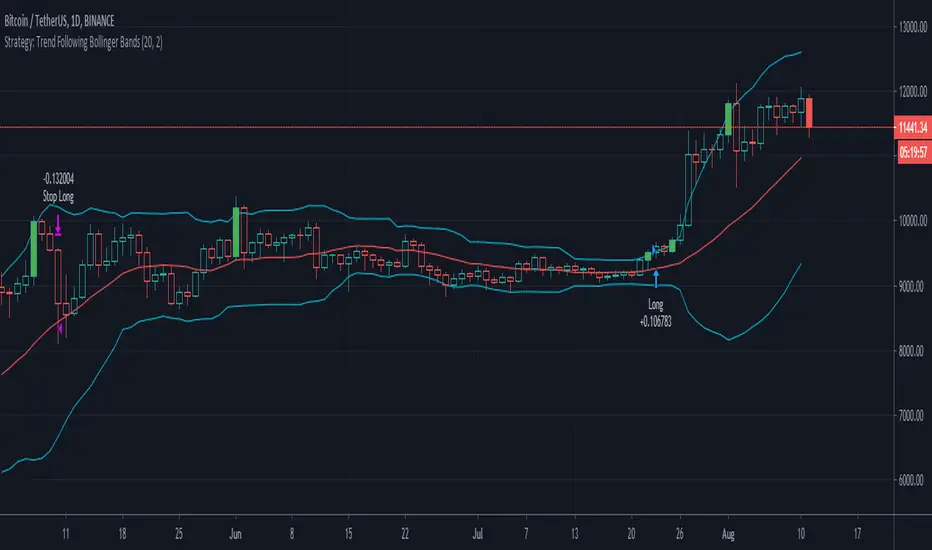
Setup Trend Following Bollinger Bands - ValenteBuy when the candle closes above upper BB
Sell when the candle closes bellow lower BB
Stop always on base line
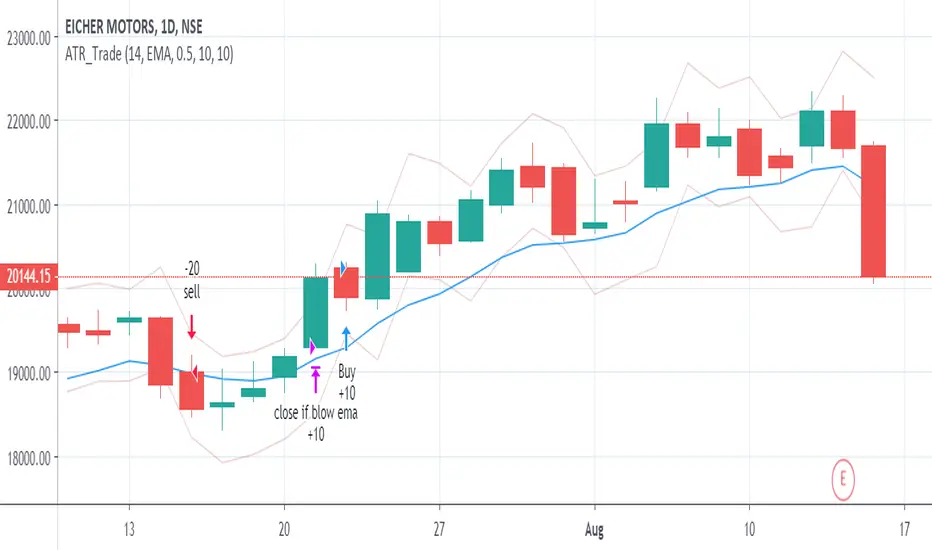
ATR_Trade_strategyATR Based Strategy
Identify the ATR range on Daily Chart.
ATR HIGH= Previous Close +ATR
ATR Low =Previous Close - ATR
Long when Close is above ATR High
Short when Close is below ATR Low
Exit when close moves below EMA(10) OR
a user-selected max loss