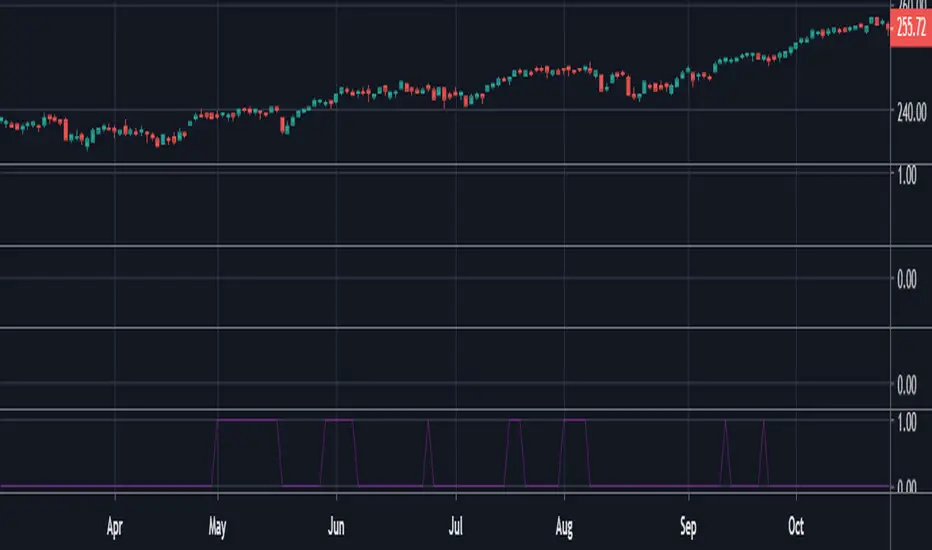
Trading Range Indicator - TRISimple script made to identify trading ranges in any timeframe
The oscillator bounces between 1 and 0. 1 means that the current asset is in a trading range and 0 meaning it is not.
The determination of a trading range is determined by the following:
ATR(14)40 and RSI<60
ADX<25
Due to all 3 having to be fulfilled in order for the oscillator to show there is a trading range, this causes a problem where 2 of the conditions are fulfilled and therefore still shows 0 on the oscillator, however, the asset could very well be in a trading range.
So what in the world do you use this for if there is such a significant margin of error?
Since all 3 conditions need to be fulfilled in order for it to be considered a trading range, this gives a very strong indicator of said trading ranges. So if a person is looking at individual stock tickers or the SPY index ticker, then when the oscillator reads a 1, it could be ideal to open an Iron Condor on said ticker. This means that this indicator is not well suiting for traditional long and short stock positions, but rather it is made for options traders who by using an Iron Condor can make money of a range-bound market.
Trading
Bitfinex Spot vs Margin Volume - Multi-assetThe Bitfinex Spot vs Margin Volume - Multi-asset indicator was designed to help understanding how volume is composed between Spot and Margin transactions, considering all possible scenarios.
It provides valuable additional insight on how 'smarter money' is behaving in anticipation of possible upcoming moves, and can contribute to current analysis toolkits.
To request access, please send me a direct message.
Main features:
Spot vs. Margin insight for all margin-enabled Bitfinex pairs (dynamically detected from Chart).
Can be used on non-Bitfinex Charts which share same Ticker (eg. BTCUSD on Bitfinex or Bitstamp). Also dynamically detected.
Can be used in a separate pane (default) or added to main chart, as a standard volume indicator.
Shapes' meanings:
Colored bars represent scenario where maximum possible volume is attributed to Spot transactions (and its corresponding effect on Margin, if any).
Histograms (thin bars) represent scenario where maximum possible volume is attributed to Margin transactions (and its corresponding effect on Spot, if any).
When volume information leaves room for ambiguity, there will be a mismatch between maximums and minimums. Truth will be somewhere in the middle.
By default, Spot and Margin volumes are stacked up, as in traditional volume bar style.This can be disabled in Options - in which case Margin volumes are presented below zero line (this can facilitate some readings; see notes).
Standard volume for current chart's pair is presented in light gray, in the background. It helps seeing realtime volume and any surplus volume in relation to Bitfinex's.
Colors:
By default, Spot volume bars are colored in blue, but you can choose to use price closes to define them instead - as in traditional volume indicators.
You can also choose to invert Spot and Margin colors, so that Spot volumes are presented in higher contrast.
Margin volumes are, by default, colored based on whether Longs or Shorts were more relevant.
Direction attribution:
Default ratio threshold to define above-mentioned relevance is 1.1 (10%). (eg.: if Longs were greater than Shorts, Longs' volume must be at least 10% grater than Shorts' for direction of movement to be attributed to Longs). Direction then is defined based on winning side, plus whether openings or closings were dominant.
Threshold be configured from 1.01 to N. If ratio is below threshold, direction is considered neutral (yellow/orange colors).
Based on this assessment, label signals are presented at top area of chart, indicating whether opening(+) or closing(-) Longs or Shorts were the major responsibles for the move.
By default, to avoid much cluttering, labels are presented only for greater-than-average (ema 17) margin volumes. This can also be customized in Options.
Claim transactions:
Claim transactions are margin positions closed with traders' own existing assets being handed in to lenders. Thus, they do not impact order books -- and volume -- when executed.
Still, they are an additional, potentially valuable source of information, and the indicator is able to detect and report them.
Green triangle-like area shapes represent Longs closed with Claim transaction(s). Likewise, similar red shapes represent Shorts closed with Claim transactions.
This topic is explained in greater detail in this Bitfinex article .
Notes:
When using stacked up visualization, values in data window do not correspond to actual margin volumes. To see actual values, change to non-stacked up mode, and ignore negative sign.
The lower the time frame, the more precise it gets.
To request access, please send me a direct message.
For questions and feedbacks, please share them in comments section below.
Thank you, and best of success on your trades.

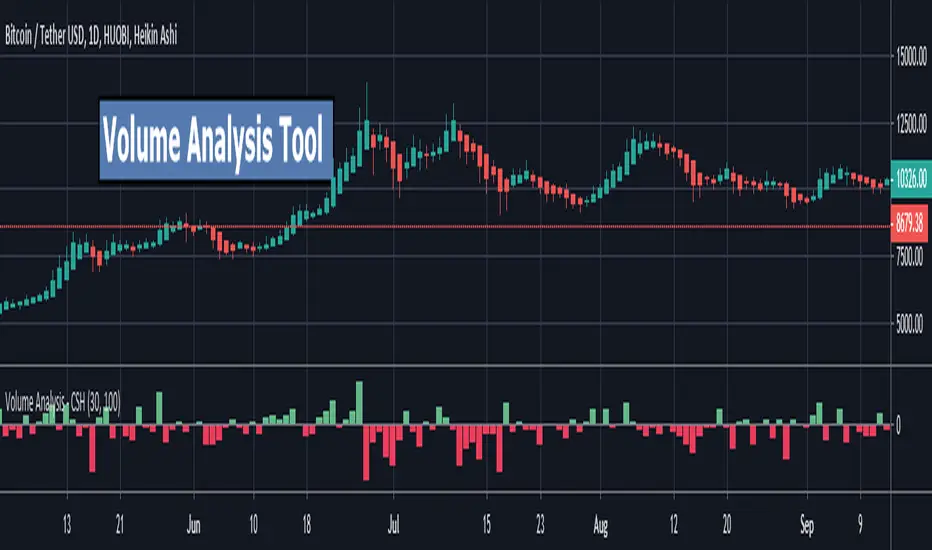
Volume Analysis Tool - CryptoShoots Volume Analysis Tool
Volume Analysis Tool is a technique to simulate tick volume data to get Buying volume and Selling Volume in each bar to any asset .
*** Features
* Delta Volume Mode .
* Detailed Volume mode - Buying and selling for each candle .
* Better understanding to the Accumulation and Distribution using volume analysis easily .
*** Usage
* Turn only one Mode(Delta or Detailed ) ON to let the indicator Shows you its magic .
* Volume Search : by default it's 1 MIN . Note : if you want to change the value understand that the lower the value the better the Accuracy .
//
As a rule of thump use 1 MIN Volume Search for these time frames ( from 5 min to 4 hours ) and 5 min Volume Search for Daily time frame .
RSI background by AvesTradingHello,
This is RSI indicator that shows background color, when proper levels reached, instead of line in another pane. Customizable options are available:
- source
- length
- overbought level
- oversold level
I have added as well RMA of RSI for extra confirmation if needed. I hope you enjoy and will leave me some feedback! Don't forget to follow me for new releases.
Cheers
Aves
Please remember that the indicators provided by me are for educational purposes only.

DMT AutobotYou have to have a defined trading plan and you also have to believe it. For this, it is necessary to have coordination and harmony between the conscious and subconscious part of the individual, That is why it is so difficult for most retail traders to be profitable
ĐΜŦ is designed to identify spots in the market that offer some of the most suitable buy and sell scalping trading opportunities.
ĐΜŦ is comprised of three inputs, which are helping to identify the volatility of a security. To determine the level of volatility there are three ranges included in the equation
Input 1 - Current Day's Range
Input 2 - How High has the security risen from the previous day's close
Input 3 - How low has the security dropped from the previous day's close
One of the greatest challenges for new traders is avoiding drawdowns on their account. Drawdowns are what kills a trader's ability to consistently earn over the long haul and creates enormous emotional pain and turmoil.
Drawdowns are a result of two factors:
(1) over leverage and
(2) extremely volatile stocks. One could argue that if you get to number 1 right, the volatility is irrelevant; however, these two elements are not always mutually exclusive.
HOW TO USE
Buy and sell signals for entry
and 7 take profit levels where you can set alerts for autobot trading or manual trading
also adjustable stop lost level for each direction .
easy to setup with autobot service and alert system trading .

Alpha - Bybit Directional MetricsThis is only for BTCUSD contracts on the Bybit exchange.
Alerts are built-in and working.
No Repainting nonsense.
Important:
This indicator will ONLY work for the ticker it is built for. It will not plot if you try and apply it to a different ticker.
Features:
Select the prefered lookback length, either Short or Long. If looking for a more reactive means of calculation then use Short. If you want more data taken into account giving a greater average then use Long.
Green bar color represents a LONG opportunity
Red bar color represents a SHORT opportunity
This has been built specifically for @Rektproof for his trading comp so good luck fam. Killem.

Guppy CBLThis is the Count Back Line script from the book Guppy Trading by Daryl Guppy.
It is usually used as a stop loss line, but can also be used to find entries.
Hope someone finds it usefull, if you find anything that is wrong with it, please let me know and I will try to fix it.
This is my first PineScript, hope it is working as intended.

[astropark] Crypto Swing Trading [alarms]Dear Followers,
today a Swing Trading Strategy , runnable on a bot , which works great from 30m timeframe and above. Best suggested timeframes are 1h and 4h.
If you are a scalper, you will love suggested entries for fast profit. You can run it from 1 minute timeframe if you are used to scalp trading and close each trade whenever you fell happy (a proper trailing stop strategy is suggested anyway).
This indicator can trigger till 5 or 20 buy or sell signals in a row before reverting (it changes greatly depending on timeframe you use), so use a proper money management .
This script will let you set alarms whenever a Buy or a Sell signal is drawn on chart. This way you can set all notifications you may need in order to be alerted on each triggered signal.
The backtesting-strategy version of this script can be found here below or by searching for "Crypto Swing Trading" and then choosing the "strategy" version.
Strategy results are calculated on the timeframe from January 2018 to now, so on about 2 years, using 10000$ as initial capital and working at 3x leverage (very safe leverage!).
This is not the "Holy Grail", so use a proper risk management strategy.
This is a premium indicator , so send me a private message in order to get access to this script.

ChaosVChaosV- Chaos Volume, is another Bill Williams' style indicator. It's essentially the Profitunity Candles, but in a Volume Bar setup. It incorporates MFI, to determine if a bar meets the Green, Squat, Fade or Fake requirements, as set by Bill Williams in his book Trading Chaos.

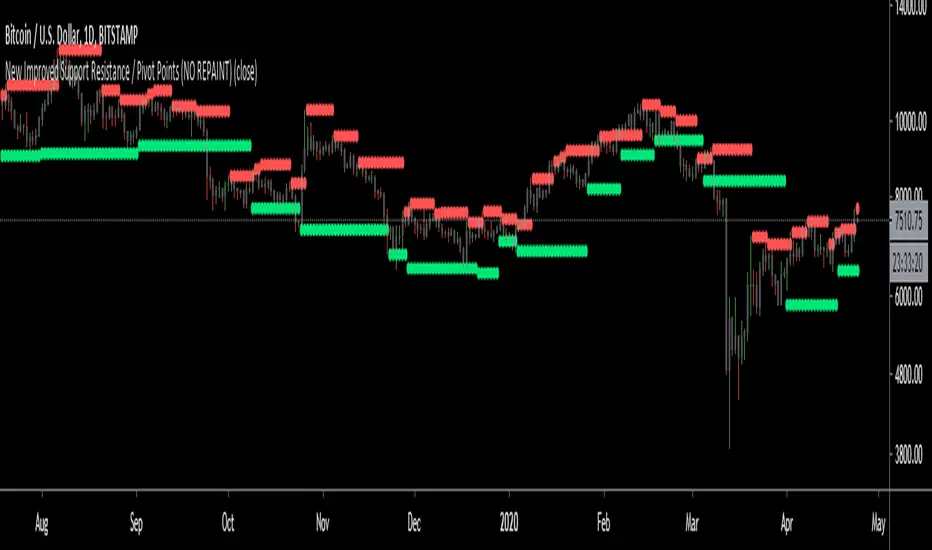
New Improved Support Resistance / Pivot Points (NO REPAINT)This indicator plots local pivot points / support resistance levels in real time (No Repaint). I created this indicator based on my own research and testing (i.e. it is not just a a Pinescript adaptation of some other indicator available online).
The Problem with Similar Indicators Which Are Currently Available On TradingView:
Inaccurate placement of swing/pivot/SR points (making your screen cluttered with meaningless levels).
Repainting (meaning the historical values change as new data becomes available; this is misleading and not very useful when trading in real time).
Have a long delay before confirming/plotting the new pivot points (20/20 hindsight...).
Require you to specify a lookback period and simply looks for the highest or lowest value over that time frame (which isn't very useful since it disregards all of the swings in between).
Do not show all of the historical swing levels, only the most recent ones.
My Solution:
Accurately places swing/pivot/SR points on local highs and lows once a short term trend is over (allowing you to easily identify reversal points).
Does not repaint (the historic values shown are exactly what would have been seen upon the close of the given candles in live trading; this means you can use this indicator for live trading).
Has minimal lag. New swing lows/highs are typically identified by this indicator on the candle which immediately following the swing point (this allows for better entries/exits rather than waiting for the price to run too far in the wrong direction before confirmation).
No lookback period required. The indicator will automatically identify new swings regardless how long the run lasts.
Allows you to adjust for more/less sensitivity.
P.S.: Future developments will be using these levels to create an automatic plot of fibonacci retracement levels.
Simple BTC trading strategy based on yesterday's trading rangeOnce market opens, the strategy calculates the price to send a stop buy order
The order is calculated as the sum of yesterday's range multiplied by a special number and today's open price
System has no stops yet
System closes the position on session close
The performance is quite good
Feel free to use it and trade it
Good luck and good trading

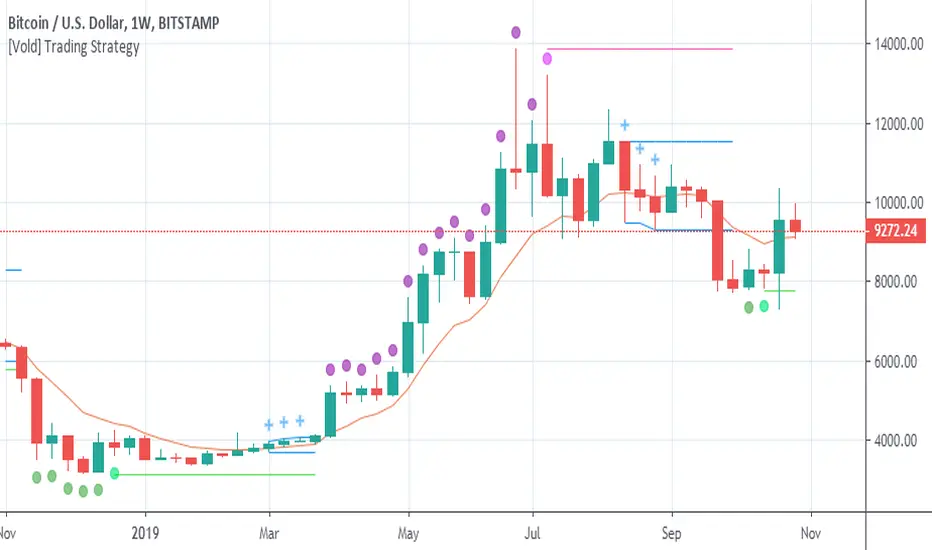
[Vold] Trading StrategyGreen dot = Trending down.
Purple dot = Trending up.
Fuchsia dot = Uptrend ended.
Lime dot = Downtrend ended.
Fuchsia line = The highest value of the last trend (breaking it up means continuation.
Lime line = Idem fuchsia line but to the downside.
Blue crosses = Could be different things: 1. A dip to buy, 2. A rally to sell, 3. Building a range ...
Blue range = Depending on the direction it breaks, is the next direction.
Golden line = Candles above favour uptrends, Candles below favour downtrends, also works as support and resistance .
This trading strategy can be traded very mechanically (see this experiment here: www.tradingview.com)
But I don't advice to do that, use it along with other indicators to make better decisions ( RSI for example) or volume of the trends and the end of them. Also, you can use higher timeframes to understand better the context.
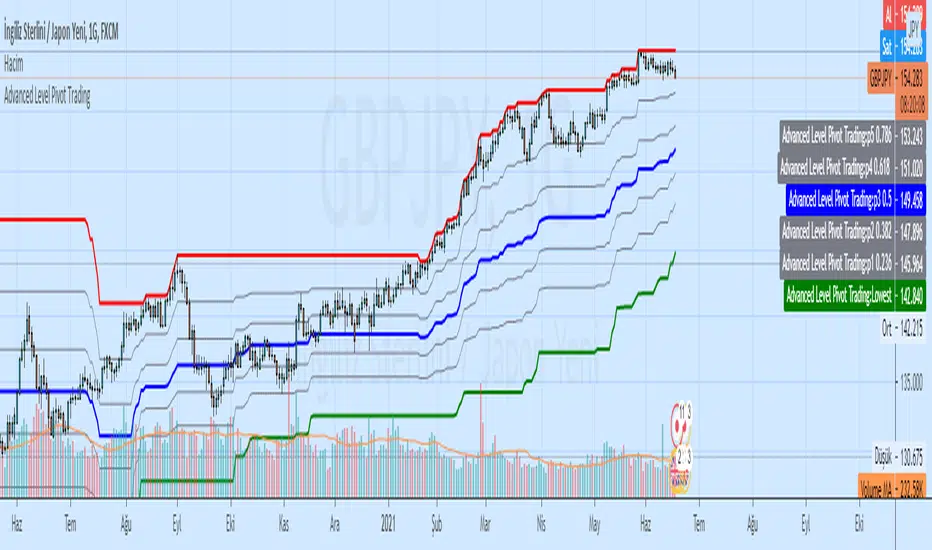
Advanced Level Pivot TradingAdvanced Level Pivot Trading
Highest Lowest Channel and Level Pivot (Fibonacci)
Triple RSI - by cryptotradingresource.com -This simple combination of 3 different RSI can help you to find a good entry or exit point.
Default RSI's are: 5, 13, 50. You can simple change them on values you like to use more.
For buy the background color will change into green and for sell, red. Play around and find the best settings that fits your trading setup.
Check out also my other indicators.
Happy trading
+++ use this tool on your own risk. i'm not responsible for your loses +++

Scalping BerkinAlex 2
--------Inglés---------
Updated to Pine Script v4.
Errors found fixed.
---------Español---------
Actualizado a Pine Script v4.
Errores encontrados solucionados.
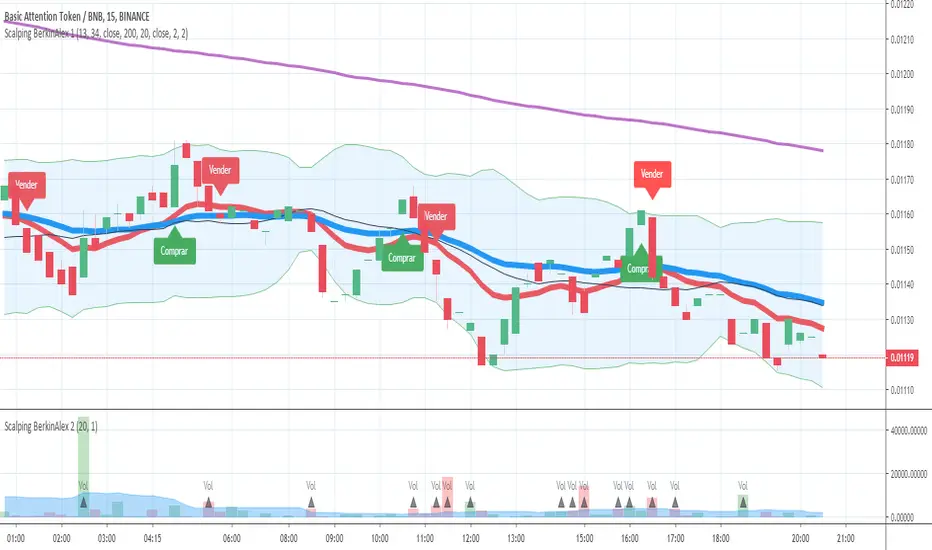
Scalping BerkinAlex 1
--------Inglés---------
Updated to Pine Script v4. 👌
Added labels (indicators) of Purchase and Sale according to moving averages for scalping and intraday. 🤑
Fusion of the "Scalping BerkinAlex 3" indicator with the "Scalping BerkinAlex 1", so as not to occupy a slot of indicators unnecessarily if you have a free account. 😜
Alert system designed, now you can create an alert in free mode according to the possibility of buying or selling an asset.🔔
Errors found fixed.💪
---------Español---------
Actualizado a Pine Script v4. 👌
Añadidas etiquetas (indicadores) de Compra y Venta según medias móviles para scalping e intradía. 🤑
Fusión del indicador "Scalping BerkinAlex 3" con el "Scalping BerkinAlex 1", para así no ocupar un slot de indicadores innecesariamente en caso de disponer cuenta gratuita. 😜
Sistema de alertas diseñado, ahora podrás crear una alerta en modo gratuito según exista la posibilidad de comprar o vender un activo.🔔
Errores encontrados solucionados.💪

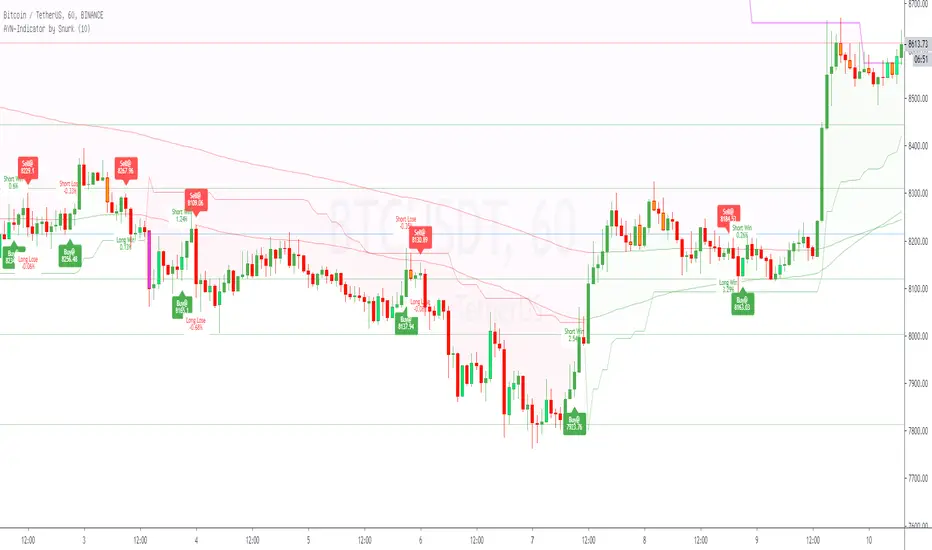
AYN: Buy-, Sell-, Trend- and SwingSignals incl. AutoFibo
Hi,
i want to introduce you to my AllYouNeed-Indicator. I calculate the buy sell signals within different timeframes independent in wich timeframe you are, therefore Pinescript suppose the Signal could be repainted. I was not able to fix this error, but after frequent checks of the result i haven't found a single repaint. Please try it out and let me know me, if you still get caught by a repaint.
Features:
- Short, Mid and Longterm-Trends
- Buy and Sell Signals and Results as well with Labels (Prices, Percentage, Win/Lose)
- Length Multiplier for different Marketsituations
- Trend-Signals with Barcolors (Lime=Uptrend, Fuchsia=Downtrend)
- Swing-Signals with Barcolors (Lime=Upswing, Orange=Downswing)
- Auto-Fibonacci with changing Linecolors as Support(green) / Resistance(red)
Hope you like it, feel free to contact me for further informations.
Please leave a comment on what I can do better, thanks.
Best regards,
snurk
Session P4L SNIPERSsession separator only for the operation of the academy. by its time margin. added the asian range for a power of three

DAY separator P4L FOREX
day separator for better orientation of neutralizations in the graph. with the possibility of choosing day and color to show in the graph

EMA-50H-50L-15CThank you @rachitpjain for sharing this simple yet effective strategy on open platform( Twitter ).
For detail reading about strategy refer tweets of @rachitpjain where he timely posts charts using this strategy.
**************************************************************************************************
**EMA-50H-50L-15C Script V1
**************************************************************************************************
This script will be helpful to identify trade based on strategy shared by @rachitpjain.
Here are salient features of this script :
-Apply Three EMAs using single indicator (50H-50L-15C)
-When 15C crosses 50H - EMA Band will be filled with green color and only BUY trades should be taken
-When 15C crosses 50L - EMA Band will be filled with red color and only SELL trades should be taken
-When 15C in between 50H - 50L Band will be filled with white color and Trading should be avoided
*Strategy works best in trending market using any instrument. Results will vary with change in time frame
**Apply Basic TA like horizontal support, resistance, Higher High, Higher Low, Lower Low and Lower High price structure will increase success rate of this strategy
*** Script is kept protected mode and don't ask for codes.
(I think it's easy to code and by coding yourself, you will learn so many aspect of trading which you might missed)

Broly Returnsthis is a study created on pine v4, gives u a lot of usefull information about the trend, as u can see we have AVERAGE TRUE RANGE BANDS, also simple moving average, buy when green appears, and sell when the red come over, good trading bye.

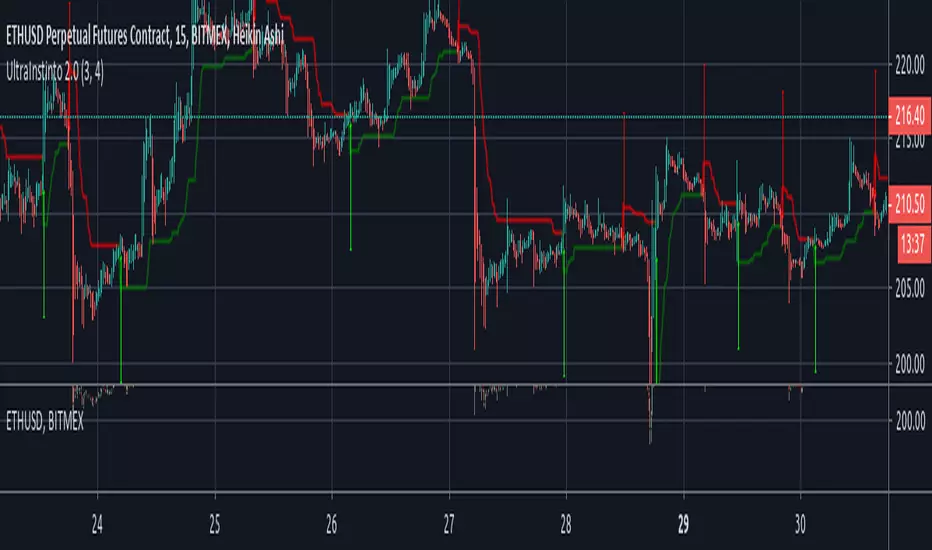
UltraInstinto 2.0BITMEX:ETHUSD
UltraInstinto 2.0 is a trend hunter tool, based on the latest artificial inteligence algorithms it can take decisions on real time, on any frametime, buy when the green arrow appears, and sell when the red arrow appears, easier than play fortnite, and returns you a lot of money