SuperTrend Oscillator [LuxAlgo]This oscillator is made of three components, all derived from the SuperTrend indicator. This approach allows the user to easily determine overbought/sold zones, identify whether a retracement is present or if the price is ranging or trending. It also allows for the anticipation of the potential price cross with the SuperTrend.
We provide additional information including whether a signal returned by the SuperTrend was false, as well as the percentage of false signals.
Settings
Length: Period of the "average true range" used in the calculation of the SuperTrend
Mult: Multiplicative factor for the "average true range"
Smooth: Determines the degree of smoothing of the histogram
Misc:
Fixed Transparency: Use a fixed transparency for the main oscillator
Show Lines: Show the lines displayed by the indicator
Show Labels: Show the labels displayed by the indicator
Usage
The indicator is in a range of (-100,100) with values closer to 100/-100 indicating a stronger trend. The main oscillator value above 0 indicates that the price is above the SuperTrend.
It is possible to identify when a retracement is present in a trend. This is often indicated by an oscillator value moving within 50/-50.
Each overbought/oversold level can be used to determine potential exit points.
The indicator also includes two additional oscillators derived from the main oscillator. A smoothed version of the main oscillator (Signal), and a smoothed version of the difference between the Main and Signal oscillators (Histogram), thus making the oscillator part of the indicator more similar to MACD.
One can use the histogram to anticipate when the price might cross the SuperTrend by comparing the sign between the main and histogram. Potential false signals can also be filtered with this method.
Certain crosses between the price and SuperTrend can be filtered out when the histogram and main oscillator have a different sign (here main = 1, histogram = -1).
We include various indications in order to analyze the signals returned by the SuperTrend. The indicator displays symbols indicating whether a signal was false or not.
A cross symbol will be displayed at the top of the displayed lines when the previous Buy signal was false, else a checkmark is displayed. Symbols displayed at the bottom of the lines are referring to sell signals. We also provide a percentage of false signals, calculated over the entire chart history.
Details
The scaling method used is similar to max-min normalization. We first compute the difference between the price and SuperTrend and divide the result by the difference between the upper and lower extremity used to compute the SuperTrend. Values higher than (1,-1) can occur when price crosses the SuperTrend and as such we use the max and min functions to attenuate these.
The filter used to compute the signal line is based on exponential averaging and is fully adaptive. The smoothing factor used for its computation is the squared value of the main oscillator, divided by length . Since higher values of the oscillator are associated with trending markets, the filter will be closer to the main oscillator when the market is ranging.
Supertrend

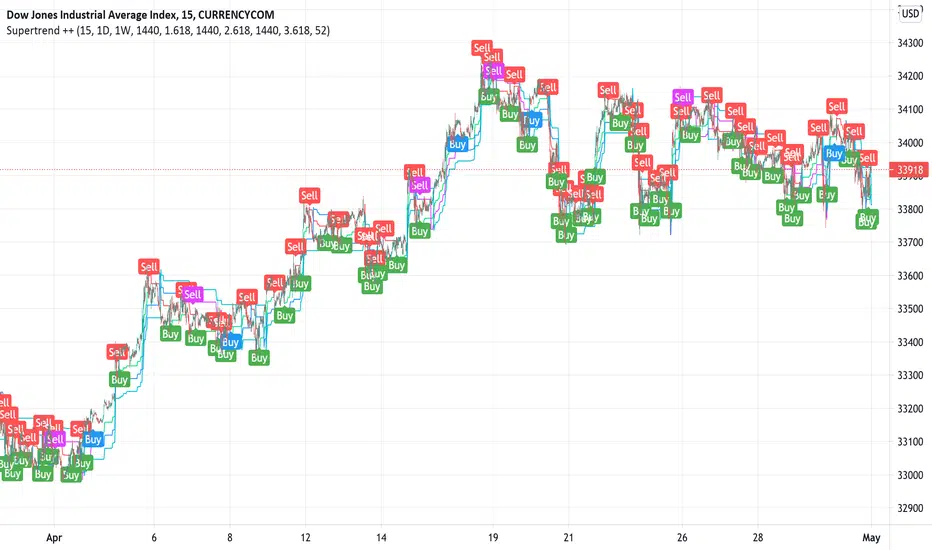
Supertrend ++Supertrend ++ is an HTF (HigherTimeFrame) Supertrend with an optional Volume Filter with adjustable value in the Settings.
Signals are represented by Green Labels (Buy) to indicate a Long Entry or Red Labels (Sell) to indicate a Short Entry.
Note that the script does not Repaint and that you have the option of placing a single Alert for the two available Alerts.
Always use the option "Once per bar" and not "Once per bar close" when placing an Alert of individual type.
If you have any suggestions or need help, please let us know in the comment area.
Good Trade everyone and remember, Risk Management remains the most important.
3 SuperTrends + ATR SL + 3 EMAsHere I have assembled 3 indicators, SuperTrend + ATR + Ema, to make them fit into one indicator to make things more organized and to save space. Check Script for original Authors of the used scripts. The UI or the indicator is far from perfect as my programming skills are very low :D

Divit Multi SuperTrendthese are all supertrend lines with different settings.
green lines indicate uptrend.
red line indicates down trend.
when all lines are green its very good uptrend - you can buy.
when all lines are red its very good downtrend - you can sell.
when few lines are red and few are green its not confirmed buy or sell.
in this situation you may confirm buy or sell with the help of other indicators.
its an easy to use indicator.

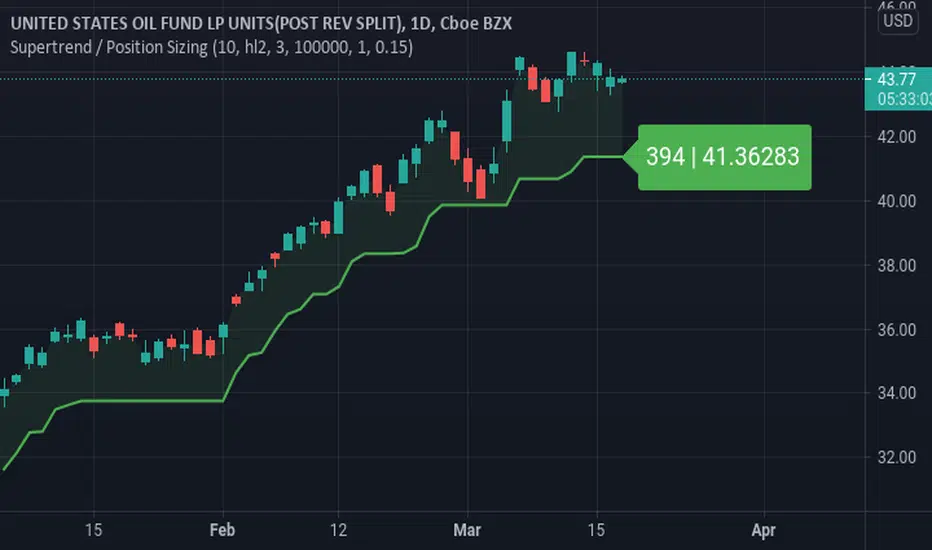
Supertrend / Position SizingSuperTrend with position sizing calculator.
This is based on SuperTrend by Kivanc. I only added the position size calculation and displaying the result.
MA Candles - SupertrendConverting strategy to indicator for those who want to use it as indicator.
Concepts are simple :
Calculate moving average of High, Low, Open and Close and make candles of them
Calculate ATR and derive supertrend on the moving average candles.
Alerts :
Bullish Crossover - When supertrend turns green
Bearish Crossover - When supertrend turns red
Bullish Pullback - Supertrend is green but close crossed below Moving average high
Bearish Pullback - Supertrend is red but close crossed above Moving average low
Original strategy is present here:

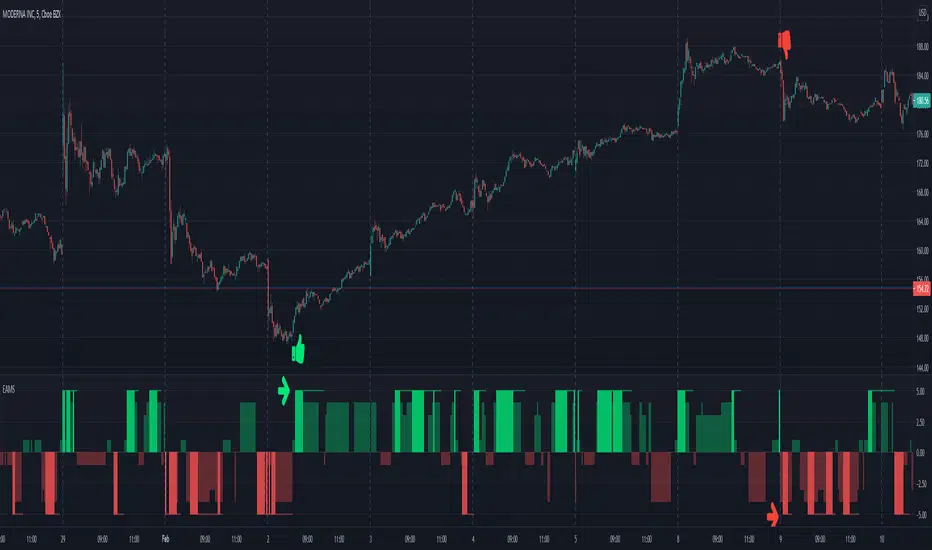
Electrified Aggressive Momentum SignalWhat this can be used for:
If you've already decided you want to trade a symbol, this can identify points of momentum alignment.
If a strong move has recently happened and you're looking for a change in momentum.
How it works:
This is a weighted combination of a Stochastic RSI and two modified SuperTrend (ATR Trailing Stop) indicators:
The Stochastic RSI signal is based upon aligned momentum and is negated at the overbought and oversold points.
The SuperTrend formula uses high and low values for calculation and both fast and slow can be adjusted for sensitivity.
Philosophy:
Signals have to be useful to humans. If a signal occurs to late, you've missed it. The intent of this indicator is to assist in timing a trade at very short time-frames. It assumes your conviction about a trade already exists, but you are trying to get an optimal entry.
Opposing momentum (weak signal) within an uptrend can be a sign that you should wait before entering. The frequency of a signal can indicate the strength of the trend. As the frequency of the aligned signal value decreases so does the reward vs risk.
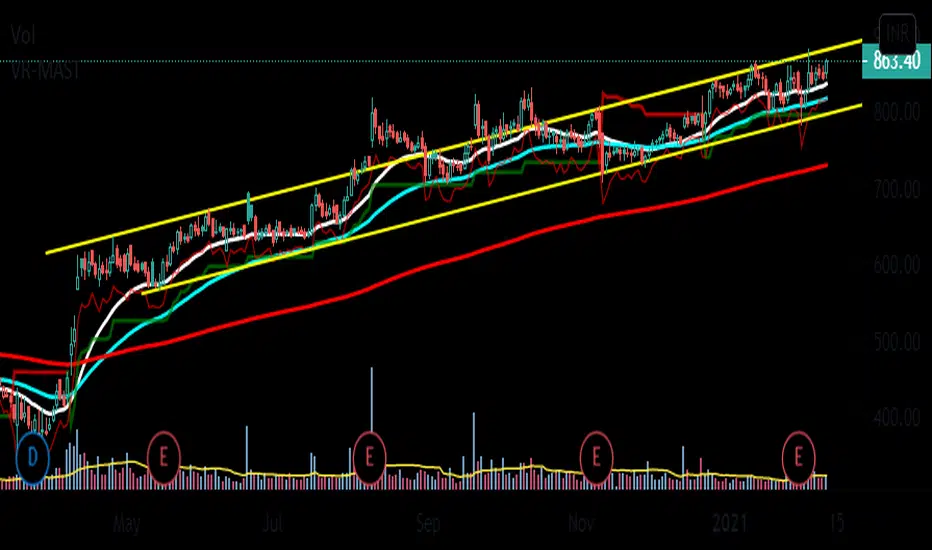
VR-MASTThis is a my script for a super simple trading strategy - ZEST.
Identify Zone of Value, Enter on pullback, place proper Stop Loss and set achievable Targets.
So, to identify Zone of Value, I have EMA in my script.
20EMA generally acts as a dynamic Support/Resistance zone.
For Buy Stop Loss, we have 1ATR below Swing Low.
Then, we have SuperTrend for Trailing Stop Loss.
[THETA] Tema Hema Evwma Trade ActionTHETA
Is an Intraday Strategy Indicator, To be used over 1 minute chart and in conjunction with built in pine indicator Pivot Point Standard, {Fibonacci One}
I came across this Strategy Indicator while reading through the Forex Trading Journals, and thought of sharing you guys
The Indicator Comprises of amalgamation of
TEMA : Triple Exponential Moving Average
HMA : Hulls Moving Average
EVWMA and EMA: Elastic Volume weighted Moving Average and Exponential Moving Average
Filter Action by Rajandran R Supertrend
So
Theta = ( tema(src, length) + hma(src, length) + ema(src, length) + evwma(src, length) )/4
The lengths in use are: 8,21,34,55,89,144,233,610
How to Use
Use on 1 min chart for best results
UsE in Conjuction with Fibonacci Pivot Points, (.which is present in option of built in pine indicator : Pivot Point Standard )
Provision For Alert
Long theta Signal
Short theta Signal
RGTS_SuperTrend v.10This Classic Super Trend Indicators, Change Setting According to your Requirement and Us
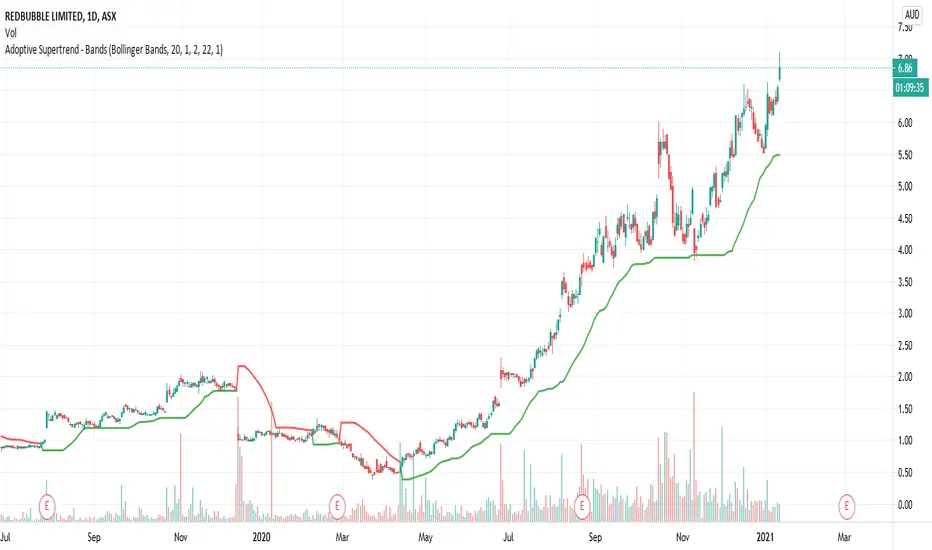
Adoptive Supertrend - BandsAnother adoption of supertrend. This time based on different channels - Bollinger Band, Keltner Channel, Donchian Channel and Pivot point based Donchian channel.
When price hits top of bands, it is considered as start or continuation of uptrend. When price hits bottom of the band it is considered as start or continuation of downtrend. Hence, supertrend is drawn based on these calculations. Use ATR Periods and ATR Multiplier to create stops certain ATR away from band's top and bottom.
Other supertrend adoptions published are here:
Pivot point based donchian channel is published here:
MAST TrendHello Traders !!
This is a simple super trend based MAST trend.
By default the supertrend is 10 period with 3 ATR multiplier.
A moving average is used to benefit from the pullback entries.
Bullish Pullback : Price above Supertrend & below MA
Bullish: Price above Supertrend and above MA
Bearish pullback : Price below Supertrend & above MA
Bearish : Price below Supertrend & below MA
Refer to investopedia or any relevant articles for in detail about Supertrend.

PMax on RSI with Tillson T3Profit Maximizer Indicator on RSI with Tillson T3 Moving Average:
PMax uses ATR calculation inside, for this reason users couldn't manage to use PMax on RSI because RSI indicator doesn't have High and Low values in bars, but ATR needs that values. So I personally calculate RSI in a different way to have High and Low values of RSI wrt price bars.
IMPORTANT:
Because of the sudden movements and divergences on RSI, this indicator must firstly optimized for the charts before using. Optimization can be held by users for the meaningful parameters for each chart.
3 parameters are critical when optimizing:
First: Multiplier
Second: Tillson T3 Length
Third: T3 Volume Factor
Here are some information about Profit Maximizer:
PMax Indicator:
PMax Screener and Strategy:

Adoptive Supertrend - PivotsAnother experiment with Supertrend by making use of pivot point high/lows.
Trailing Stop types used in this indicator are:
ATR - plain ATR based supertrend
Breakout - ATR based supertrend combined with breakout. (Trailing triggered only if price change is higher than HighPriceChange multiplier times ATR.
Pivot Points - Trail only when new pivots created. Pivot stop multiplier is used below pivot low.
Combined - Combine everything together

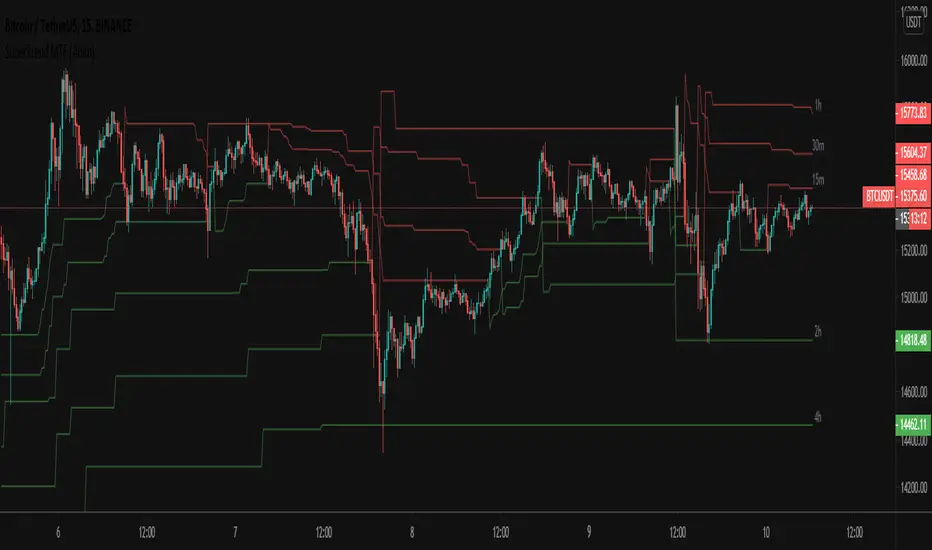
SuperTrend MTF [Anan]Hello friends,
As per many experts, supertrend indicator is best to use in combination with other indicators like MACD and RSI.
The best thing about supertrend it sends out accurate signals on precise time. The indicator offers quickest technical analysis to enable the intraday traders to make faster decisions. It is extremely simple to use and understand.
However, the indicator is not appropriate for all the situations. It works when the market is trending. Hence it is best to use for short-term technical analysis. Supertrend uses only the two parameters of ATR and multiplier which are not sufficient under certain conditions to predict the accurate direction of the market.
Understanding and identifying Bull and Bear signals in supertrend is the main crux for the intraday traders. Both the downtrends as well uptrends are represented by the indicator. The flipping of the indicator over the closing price indicates signal. A Bull signal is indicated in green color whereas Bear signal is given as the indicator turns red.
Options:
- Change calculation source ( default SuperTrend uses: hl2)
- Change calculation method (default SuperTrend uses: RMA)
- Additional six multi-time frames SuperTrends
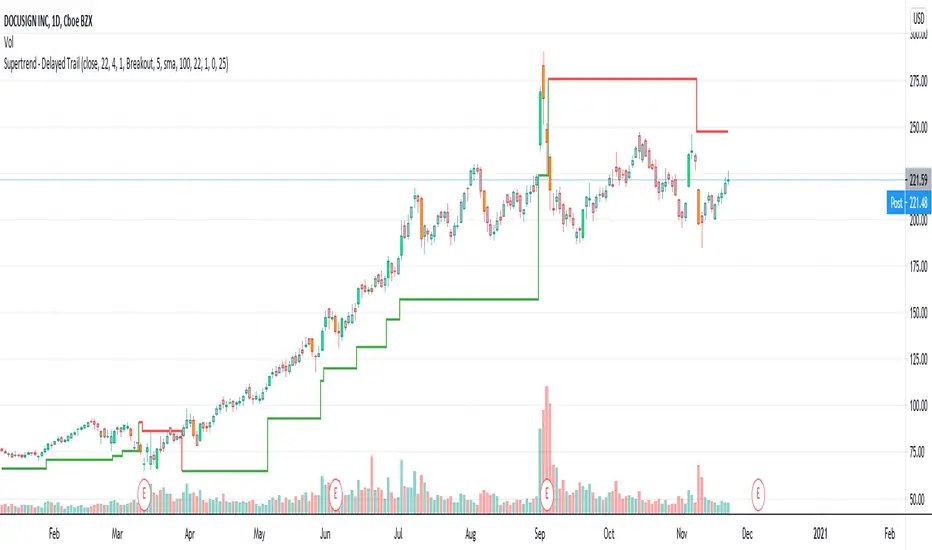
Supertrend - Delayed TrailI use supertrend for for trailing stops. One of the problem of trailing stops in long term trend trading is we get stopped too early and then trend continues. To avoid this problem, we can limit or delay our trailing.
In this modified version of supertrend, we can delay trailing by two methods:
Bars : Trail after certain bars. Input DelayBars says after how many bars it should trail.
Steps : Trail after reaching equivalent stop on the other side.
ConsiderWicks option reverse direction upon high reaching trailing Sell stop or low reaching trailing buy stop (instead of close)
ConsiderWicksForDelayByStep does the same thing for calculating if the steps have reached.
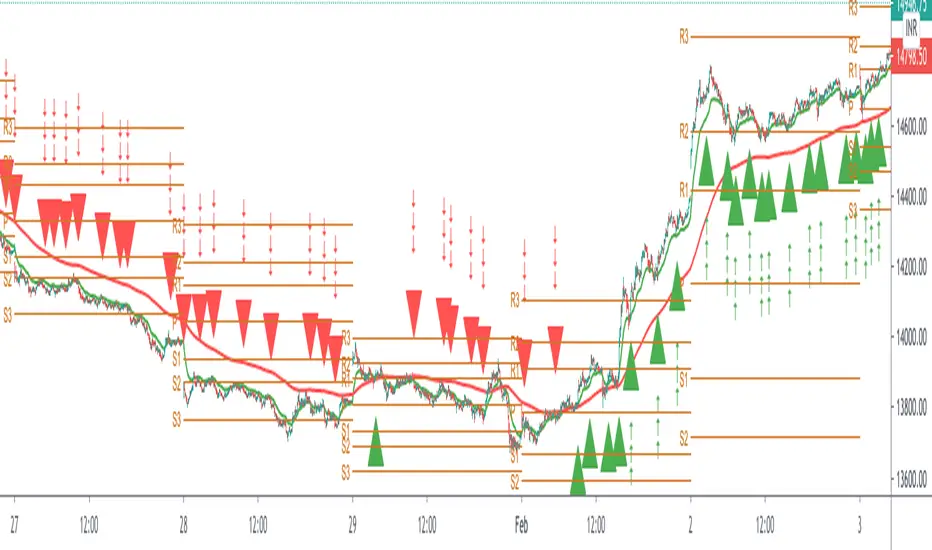
SuperTrendRange by DGTSuperTrendRange study attempts to determine the state of the market
• whether a well-established bull/bear trend is present
• whether the market is trading in a range
SuperTrendRange (STR) takes into account the volatility of the market - further details regarding volatility can be found in the description of “Volatility Bands by DGT” study
Due to its similarities to SupertTrend (ST) and Parabolic SAR (SAR), I will try to explain by stating differences between them
SuperTrendRange uses both the ATR (Average True Range) and STDEV (Standard Deviation) as part of its calculations - unlike ST and SAR where they use only ATR
Sensitivity of the indicator is adjusted using the multiplier setting of both ATR and STDEV
Additionally, unlike ST, the source of the basis of SuperTrendRange can be selected among the assets price value or its moving average
Source and Length are adjustable too
The SuperTrendRange, like Parabolic SAR indicator, appears on a chart as a series of dots, either above, below or unlike Parabolic SAR both above and below of the asset's price
A dot placed
- below the price when the market is trending upward
- above the price when it is trending downward
- both above and below when the price starts moving sideways – this is a feature that both SuperTrend and Parabolic SAR misses, where they are known to produce false signals and losing trades, whereas SuperTrendRange emphasis the zones of the ranges occurring and in most cases are considered no trade recommended zones. Please note that the range width may vary depending on how the market is volatile. It is up to the users to trade if it fits their trading strategies
Dots plotted above and below can be assumed as Support and Resistance levels
Example usages – with trading opportunities
Gold Monthly Chart
Bitcoin Daily Chart
Disclaimer:
Trading success is all about following your trading strategy and the indicators should fit within your trading strategy, and not to be traded upon solely
The script is for informational and educational purposes only. Use of the script does not constitute professional and/or financial advice. You alone have the sole responsibility of evaluating the script output and risks associated with the use of the script. In exchange for using the script, you agree not to hold dgtrd TradingView user liable for any possible claim for damages arising from any decision you make based on use of the script

Supertrend (MTF) & Parabolic SAROne of my mixed approach strategy indicators which includes:
- Parabolic SAR
- 1 Hour Supertrend
- 4 Hour Supertrend
Whilst this script may appear slow due to the 4hr Supertrend, it does a great job of managing breakouts.
Using this indicator is simple, if the line labeled Lifetime is green then buy, if red then sell OR don't trade. So...
Green Line - This strategy is in a buy position
Red Line - This strategy is in a sell position
Any other Color - DON'T TRADE
The traders approach is simple, when all indicators are green or red, then take the trade. As soon as one indicator changes, then re-evaluate using your normal process, such as price action, to determine whether to close the trade or continue.
If you require any further information or script modifications, please message me.
PLEASE CHECK OUT MY OTHER SCRIPTS

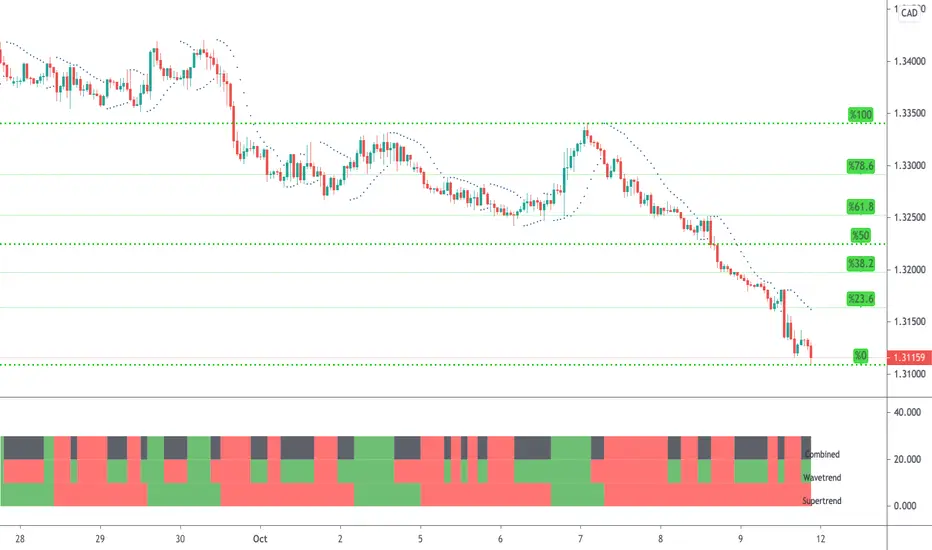
WaveTrend & Supertrend Comparison/CombinedThis compares two reasonably reliable strategies and shows where they are in agreement.
When the top line is GREEN - Then consider BUYing
When the top line is RED - Then consider SELLing
There are also alerts available.
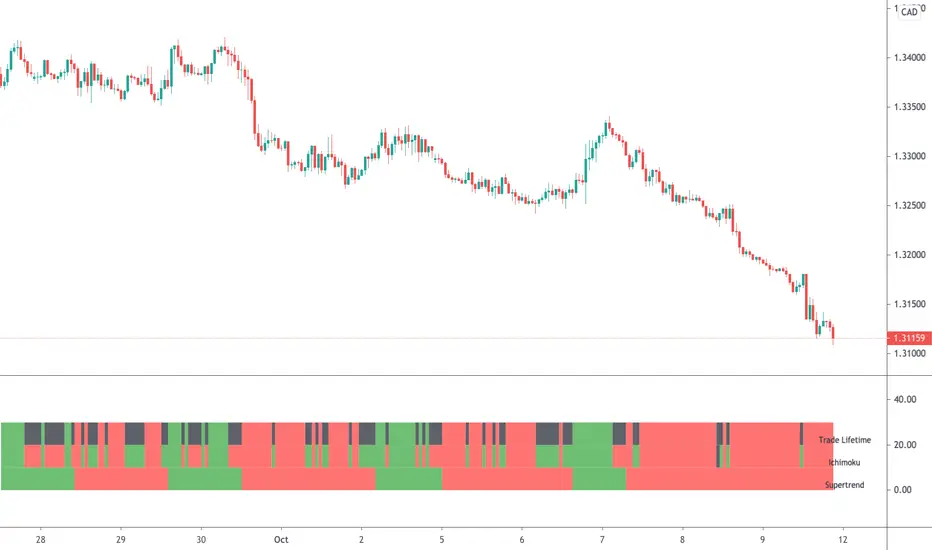
Ichimoku & Supertrend Combined StrategyOne of my mixed approach strategy indicators which include's:
- Ichimoku using much faster settings. (ECC-11)
- Supertrend
Whilst both Supertrend and Ichimoku are quite reliable, they do sometimes provide false signals. By combining both indicators, trading when both agree, it reduces the number of false alerts.
Using this indicator is simple. If the lifetime line is green then buy. If red then sell and when black don't trade. So...
Green Line - This strategy is in a buy position
Red Line - This strategy is in a sell position
Black Line - DON'T TRADE
The trader's approach is simple, when all indicators are green or red, then take the trade. As soon as one indicator changes, then re-evaluate using your normal process, such as price action, to determine whether to close the trade or continue.
There are also some alerts for opening and closing positions.
If you wish to make some changes or discuss, please don't hesitate to message me.
Multi StrategyDuring the course of a trade, we can find ourselves changing strategies depending on the market. Instead of using many different templates, I have a simple indicator that clearly says "Buy", "Sell" or "Stay Out". The great thing about this approach, is we instantly observe the majority are in agreement and that decides which way to place our trade.
This indicator includes the following strategies:
- QQE
- Ichimoku using much faster settings.
- Parabolic SAR
- Supertrend
- TTM Oscillator
- The Squeeze strategy
- The Alligator Strategy
Using this indicator is simple, if the lines are mainly green then buy, if mainly red then sell OR don't trade. So...
Green Line - This strategy is in a buy position
Orange or Black Line - This strategy is undecided
Red Line - This strategy is in a sell position
There are also some green and red circles for reference that appear showing when that bar has broken through the Ichimoku cloud.
The trader's approach is simple, when all indicators are green or red, then take the trade. As soon as one indicator changes, then re-evaluate using your normal process, such as price action, to determine whether to close the trade or continue.
I can customise this further or add other strategies, please message me.

Supertrend Screener PanelScript to display Supertrend trend state of 8 different securities in a panel. Timeframe & Tickers which are to be displayed can be configured from settings.
Part of code is from the ADX DI Monitoring Panel script by u/wugamlo with his permission. Thanks to him for that and do please check out his work also.

Profit Maximizer PMaxPMax is a brand new indicator developed by KivancOzbilgic in earlier 2020.
It's a combination of two trailing stop loss indicators;
One is Anıl Özekşi's MOST (Moving Stop Loss) Indicator
and the other one is well known ATR based SuperTrend.
Both MOST and SuperTrend Indicators are very good at trend following systems but conversely their performance is not bright in sideways market conditions like most of the other indicators.
Profit Maximizer - PMax tries to solve this problem. PMax combines the powerful sides of MOST (Moving Average Trend Changer) and SuperTrend (ATR price detection) in one indicator.
Backtest and optimization results of PMax are far better when compared to its ancestors MOST and SuperTrend. It reduces the number of false signals in sideways and give more reliable trade signals.
PMax is easy to determine the trend and can be used in any type of markets and instruments. It does not repaint.
The first parameter in the PMax indicator set by the three parameters is the period/length of ATR.
The second Parameter is the Multiplier of ATR which would be useful to set the value of distance from the built in Moving Average.
I personally think the most important parameter is the Moving Average Length and type.
PMax will be much sensitive to trend movements if Moving Average Length is smaller. And vice versa, will be less sensitive when it is longer.
As the period increases it will become less sensitive to little trends and price actions.
In this way, your choice of period, will be closely related to which of the sort of trends you are interested in.
We are under the effect of the uptrend in cases where the Moving Average is above PMax;
conversely under the influence of a downward trend, when the Moving Average is below PMax.
Built in Moving Average type defaultly set as EMA but users can choose from 8 different Moving Average types like:
SMA : Simple Moving Average
EMA : Exponential Movin Average
WMA : Weighted Moving Average
TMA : Triangular Moving Average
VAR : Variable Index Dynamic Moving Average aka VIDYA
WWMA : Welles Wilder's Moving Average
ZLEMA : Zero Lag Exponential Moving Average
TSF : True Strength Force
Tip: In sideways VAR would be a good choice
You can use PMax default alarms and Buy Sell signals like:
1-
BUY when Moving Average crosses above PMax
SELL when Moving Average crosses under PMax
2-
BUY when prices jumps over PMax line.
SELL when prices go under PMax line.
