bc Grid Backtest v1.4This strategy is a full implementation of Grid Trading backtest.
Prominent features of this backtesting strategy are:
- Logarithmic Chart Support: This strategy can support Log Scale on graph. Meaning that grid lines won't have irregular gaps in between the lines if you would like to view the chart Log Scaled. Every line will be aligned correctly even if you use Log Scale or not.
- Precise Buy & Sell: Script will execute precise Buy and Sell orders.
- Dynamic Grid Level Count: From 2 grid levels to n amount of grid levels are supported. There is no limitation on grid level count. You can pick any number starting from 2.
- Customized Backtesting Results Table: A table which includes data for those who want to know has been added at top right. It can be disabled.
Characteristics of this script:
- Able to fill more than one order in one single candle.
- Levels will keep being updated with every trade.
- There will be always one grid level ignored and it will be the level which made the last order filling possible. This is normal behavior of grid trading system.
- You can both use Log Scale and Normal Scale with this script. No issue will be on grid levels.
Using the script:
- Add this script to the chart from indicators tab
- Set starting and ending date for the grid backtesting bot either by dragging and dropping the vertical lines or by the date-time picker from indicator Inputs tab.
- Set highest and lowest limit for the script. These will be the boundary limits. Highest and lowest price for the script to work on. Lines will populate between these two values
- Set grid level count. Number of levels of the grid.
- Set amount to spend on per level. This quantity of order will be placed on each level when needed.
After setting the above settings, there is one last thing to do in order to get precise results. It is setting the Initial Capital.
- We can set this setting from 'Properties' tab. Named 'Initial Capital'. After setting the boundaries all we need to is to navigate to TradingView's own 'Data Window', and get the value there. Then paste it on the strategy's own related setting area.
In this example we used pair BTCUSDT 4h timeframe, our settings are:
Inputs Tab:
- Grid Count: 13
- High Limit: 72 000
- Low Limit: 17 000
- Logarithmic Grids: Checked (because I always use Log Scale on charts, if Log Scale is turned on, this needs to be checked)
- Quantity per level: 0.1
- Show Table: Checked
- Show Grid Levels: Checked
- Show Average Position Price: Checked
Properties Tab:
- Initial Capital: 24 902
- Slippage: 5
- Commission: 0.1% (this is the broker commission value)
This script's purpose is to make simulating possible outcomes between two dates. Therefore making it easier to get the idea of grid trading, finding the best settings for your risk management and for your portfolio.
Strategy

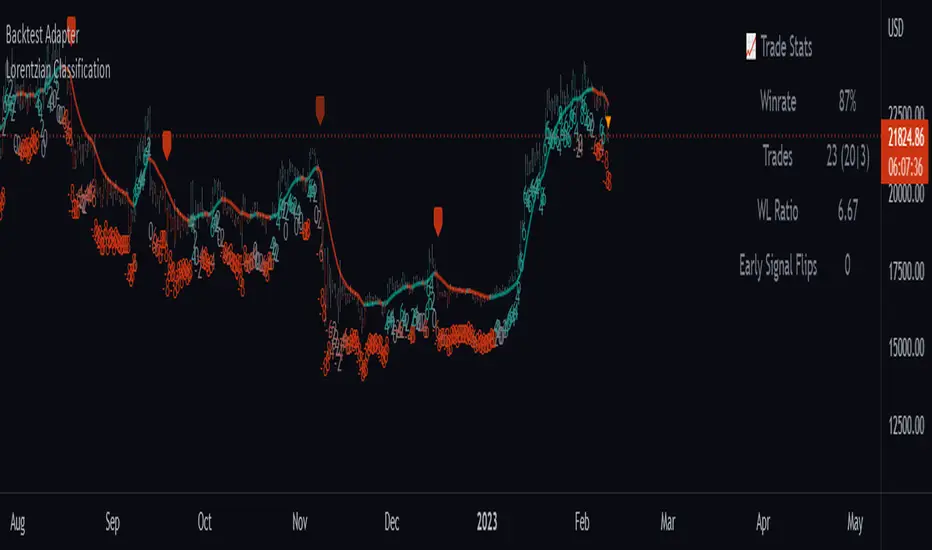
Backtest AdapterThis is a proof-of-concept Backtest Adapter that can be used with my recent publication "Machine Learning: Lorentzian Classification" located here:
This adapter is helpful because it enables interactive backtesting with TradingView's built-in "Strategy Tester" framework without the need to translate the logic from an "indicator" script to a "strategy" script.
To use this, one must have the "Machine Learning: Lorentzian Classification" script and this Backtest Adapter open simultaneously on the same chart. From there, simply change the "Source" setting of the Backtest Adapter to "Lorentzian Classification: Backtest Stream" to transfer the entry/exit signals stream to the Backtest Adapter.
For an example of how to implement your own backtest stream in your indicators, please refer to the "Backtesting" section in the source code of the "Machine Learning: Lorentzian Classification" script, which is shown below for convenience:
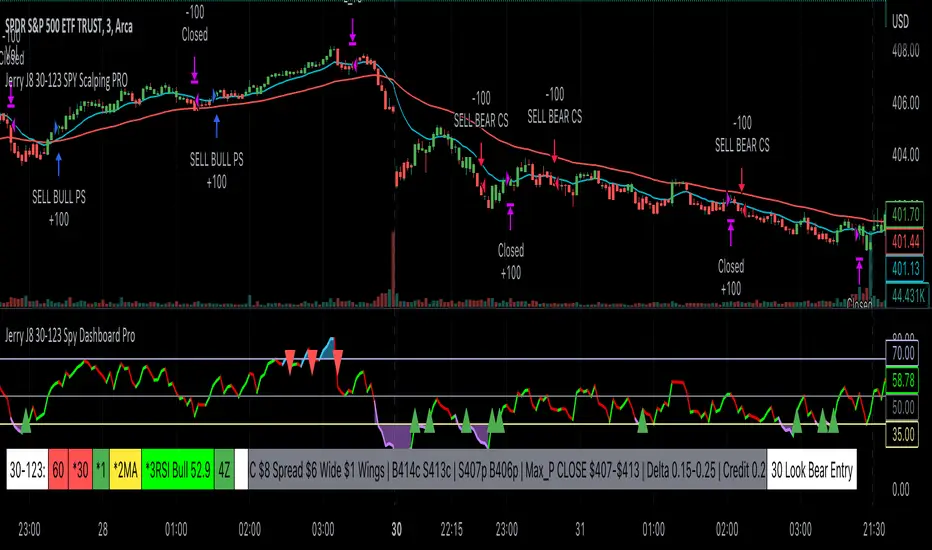
Jerry J8 30-123 Spy Dashboard ProPlease watch the J8 Scalping Tutorial Video below for a walkthrough on how these indicators work.
This script is used in conjunction with Jerry J8 30-123 SPY Scalping PRO” Indicator(which creates the buy and sell orders as a strategy). The Dashboard shows the 4 main criteria statuses from the strategy. I find the dashboard makes scalping the SPY much easier.
This study project is designed for scalping options that expire daily with bull put and bear call credit spreads on a 3 minute chart. The name 30_123 is a reference to 4 main criteria being met to give a green light for a potential trade. The criteria:
* 30 = 30 minute trend
* 1 = 3 minute trend
* 2 = Moving average criteria
* 3 = RSI criteria
4 = Secondary trend. Bonus if in sync but not a requirement.
* The strategy also utilizes momentum as a criteria but this is not shown on the dashboard.
This indicator is designed to trade options that expire daily including the SPY, IWM, QQQ, and NDX. However, it can be used with multiple symbols on a 3 minute chart.
When the 30_123 conditions are all green with all criteria are met a bull signal is created.
When the 30_123 conditions are all red with all criteria are met a bear signal is created.
This study is the dashboard that is designed to show how the main J8 strategy indicator is working and it shows which criteria have been met. Additionally there are multiple user INPUTS that you can adjust for the 4 main criteria plus inputs to help you with your credit spread criteria.
For example, if the SPY is at 400 we could have an order to sell a BULL PUT CREDIT SPREAD and I would likely sell the 398p and buy the 397p; The 398p delta would be approximately -.2. The spread position profits with any close over 398 and/or can be closed early with a bullish price move. IMPORTANT: If the SPY closed the day at $399 on the chart it would look like a loss based on the buy and sell orders but the spread would be a full profit since the close was above 398.
---- IRON CONDOR
For the SPY ticker only an iron condor label is generated when the SPY is trading sideways and meets specified criteria. When the criteria is met the Iron Condor label appears and it provides a recommendation for what option to buy and sell. The iron condor recommendations can be adjusted with user inputs.
This Indicator dashboard shows the criteria labels and colors the criteria as green if bullish and red if bearish. When the criteria are not met the dashboard shows “NO CLEAR SIGNAL”. There is also a label that shows whether you are looking for bullish or bearish positions based on the 30 minute trend.
The chart shown on the indicator is the RSI and for this indicator an RSI over 50 is bullish and under 50 is bearish. The line color shows the RSI trend. RSI OB (overbought) and OS (oversold) areas are shaded. The RSI can remain in an OB or OS state for a prolonged period and while some people use OB and OS as a reversal signal I use it as a strong trend indication and recognize it will not last forever. You can SET the OB and OS levels with inputs.
---- USER INPUTS
Paint Bars: Turns on/off the candle coloring. Default is OFF.
Iron Condor Settings: Defaults are what I use and can be used as a guide.
Criteria: Trend, moving averages, and RSI settings can all be adjusted.
---- SETUP & HINTS
Add "Jerry J8 30-123 SPY Scalping PRO” indicator to show bull and bear signals
Add "Jerry J8 MACD Optimal Entry Zone” indicator to show best MACD range for entry
I also like to add "Jerry Momentum Dream" indicator to see the momentum
With this indicator we’re looking for the 30, 1, 2, and 3 criteria to be met which increases our likelihood of success. IMPORTANT. Never automatically enter a position without reviewing the other indicators and drawing your own conclusions. You want to choose the entries that are the most appealing to you that take into account volume, time of day, and risk/reward. Positions should be closed based on your risk/reward goals.
Indicators are not a magic pill and should be used to support trading decisions, not to make them for you. Past performance is not a guarantee of future returns. The results of individual stocks/indexes with any strategy do not constitute proof they will repeat in the future.
DISCLAIMER: The information contained in our scripts/indicators/ideas does not constitute financial advice or a solicitation to buy or sell any securities of any type. Trading and investing in the stock market and cryptocurrencies involves substantial risk of loss and is not suitable for every investor. I’m NOT a financial adviser. All trading strategies are used at your own risk.
Please Use the AUTHOR’s INSTRUCTIONS link below for more information.
NOTE: The PERFORMANCE SUMMARY below does not accurately reflect the trading strategy because the entry orders generated in the strategy are based on the stock price and our actual order is a credit spread that is profitable even if the price moves against us a little bit. What could show as a loss in the strategy could be a profit in the credit spread.

Jerry J8 30-123 SPY Scalping PROPlease watch the J8 Scalping Tutorial Video below for a walkthrough on how these indicators work.
---- STRATEGY
This study project is designed for scalping options that expire daily with bull put and bear call credit spreads on a 3 minute chart. The name 30_123 is a reference to 4 main criteria being met to give a green light for a potential trade. The 4 main criteria:
*30 = 30 minute trend
*1 = 3 minute trend
*2 = Moving average criteria
*3 = RSI criteria
4 = Secondary trend. Bonus if in sync but not a requirement.
* The strategy also utilizes momentum as a criteria.
This indicator is designed to trade options that expire daily including the SPY, IWM, QQQ, and NDX.
When 30_123 conditions are all green and all criteria are met a bull signal is created.
When 30_123 conditions are all red and criteria are met a bear signal is created.
The bull and bear signals are based on the stock/index price; BUT the actual orders are for option spreads that are normally based on a delta of approximately .15 to .25.
For example, if the SPY is at 400 we could have an order to sell a BULL PUT CREDIT SPREAD and I would likely sell the 398p and buy the 397p; The 398p delta would be approximately -.2. The spread position profits with any close over 398 and/or can be closed early with a bullish price move. IMPORTANT: If the SPY closed the day at $399 on the chart it would look like a loss based on the buy and sell orders but the spread would be a full profit since the close was above 398.
This script is used in conjunction with Jerry J8 30-123 Spy Scalping Dashboard Pro indicator which is the dashboard to give a visual for the 4 main criteria and makes things easier to understand.
---- TRADING TIME FRAME
The default time frame is 10:00 - 15:57 and can be controlled by the user. I do not enter trades in the first 30 minutes since that can be a very volatile period and you can easily configure the indicator and trading time frame based on how you trade.
---- MAJOR USER INPUTS
Paint Bars: Turns on/off the candle coloring for the trend
Exits: Open orders can be closed with 3 different exit criteria and all should be left on. These exits are needed to provide multiple entry signals throughout the day. However, you want to close the spreads based on your own criteria and not on the indicator.
Criteria: Trend, moving averages, RSI settings, and trading time frames can all be adjusted.
---- SETUP & HINTS
Add "Jerry J8 30-123 Spy Scalping Dashboard Pro” indicator to show J8 criteria dashboard
Add "Jerry J8 MACD Optimal Entry Zone” indicator to show best range of entry
I also like to add "Jerry Momentum Dream" indicator to see the momentum
With this indicator we’re looking for the 30, 1, 2, and 3 criteria to be met which increases our likelihood of success. IMPORTANT. Never automatically enter a position without reviewing the other indicators and drawing our own conclusions. You want to choose the entries that are the most appealing to you that take into account volume, time of day, and risk/reward. Positions should be closed based on your risk/reward goals.
Indicators are not a magic pill and should be used to support trading decisions, not to make them for you. Past performance is not a guarantee of future returns. The results of individual stocks/indexes with any strategy do not constitute proof they will repeat in the future.
DISCLAIMER: The information contained in our scripts/indicators/ideas does not constitute financial advice or a solicitation to buy or sell any securities of any type. Trading and investing in the stock market and cryptocurrencies involves substantial risk of loss and is not suitable for every investor. I’m NOT a financial adviser. All trading strategies are used at your own risk.
Please Use the AUTHOR’s INSTRUCTIONS link below for more information.
NOTE: The PERFORMANCE SUMMARY below does not accurately reflect the trading strategy because the entry orders generated in the strategy are based on the stock price and our actual order is a credit spread that is profitable even if the price moves against us a little bit. What could show as a loss in the strategy could be a profit in the credit spread.
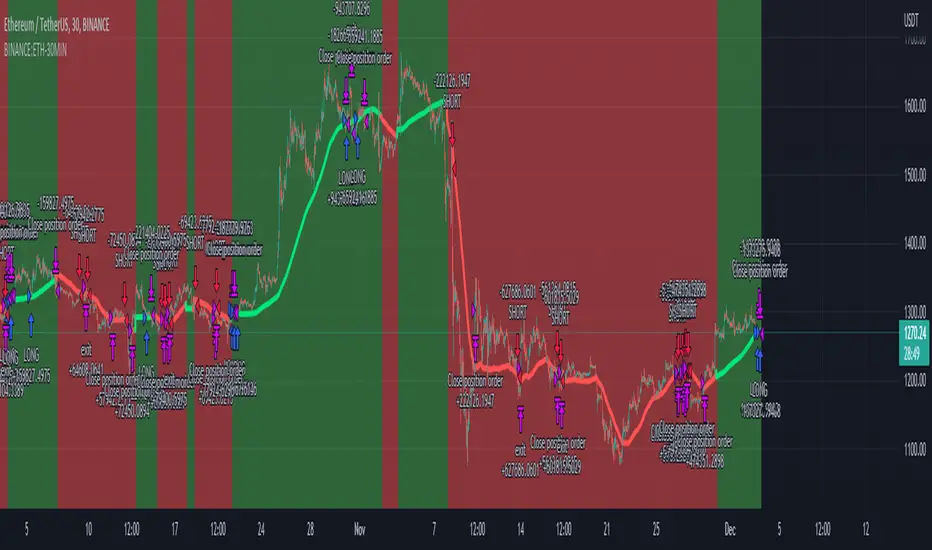
Rocket Grid Algorithm - The Quant ScienceThe Rocket Grid Algorithm is a trading strategy that enables traders to engage in both long and short selling strategies. The script allows traders to backtest their strategies with a date range of their choice, in addition to selecting the desired strategy - either SMA Based Crossunder or SMA Based Crossover.
The script is a combination of trend following and short-term mean reversing strategies. Trend following involves identifying the current market trend and riding it for as long as possible until it changes direction. This type of strategy can be used over a medium- to long-term time horizon, typically several months to a few years.
Short-term mean reversing, on the other hand, involves taking advantage of short-term price movements that deviate from the average price. This type of strategy is usually applied over a much shorter time horizon, such as a few days to a few weeks. By rapidly entering and exiting positions, the strategy seeks to capture small, quick gains in volatile market conditions.
Overall, the script blends the best of both worlds by combining the long-term stability of trend following with the quick gains of short-term mean reversing, allowing traders to potentially benefit from both short-term and long-term market trends.
Traders can configure the start and end dates, months, and years, and choose the length of the data they want to work with. Additionally, they can set the percentage grid and the upper and lower destroyers to manage their trades effectively. The script also calculates the Simple Moving Average of the chosen data length and plots it on the chart.
The trigger for entering a trade is defined as a crossunder or crossover of the close price with the Simple Moving Average. Once the trigger is activated, the script calculates the total percentage of the side and creates a grid range. The grid range is then divided into ten equal parts, with each part representing a unique grid level. The script keeps track of each grid level, and once the close price reaches the grid level, it opens a trade in the specified direction.
The equity management strategy in the script involves a dynamic allocation of equity to each trade. The first order placed uses 10% of the available equity, while each subsequent order uses 1% less of the available equity. This results in the allocation of 9% for the second order, 8% for the third order, and so on, until a maximum of 10 open trades. This approach allows for risk management and can help to limit potential losses.
Overall, the Rocket Grid Algorithm is a flexible and powerful trading strategy that can be customized to meet the specific needs of individual traders. Its user-friendly interface and robust backtesting capabilities make it an excellent tool for traders looking to enhance their trading experience.

Price Swing Detection - Smart Money ConceptSince my own style is Smart Money Concept and these days I have seen a lot of my friends who are having trouble identifying structures for their indicators and strategies. I wrote this code so they could use it in their strategy . In fact, this type of structure, as one of the strongest technical structures, can increase the success of your strategy according to your personalization.
The script detects swings (i.e. significant highs and lows) in a financial instrument's price action over a specified period. The user can set the lookback period (number of candles to consider) and the colors of the lines representing bullish and bearish trends.
The script has two functions: detectSwing and pivot high. The detectSwing function calculates the swing highs and lows for the specified number of candles. The function uses the ta.highest and ta.lowest functions to find the highest and lowest prices, respectively, over the lookback period. The function also determines the swing state (high or low) of the current candle and returns the calculated swing values.
The pivot high function calculates the pivot high, which is an important step in detecting bullish structures in the market. If a new top (i.e. swing high) is found, the script updates the pivot high values and creates a line from the recent top to the last bar. The script also updates the trailing maximum values, which are used to extend the top extension line.
For Strategy :
The variable "trendDirection" in the code is used to keep track of the trend state, either bullish (up trend) or bearish (down trend), in the market. The variable is initialized to 0 which represents a downtrend. The value of this variable is updated later in the code based on the calculations of swing highs and lows, pivot crosses, and the trailing maximum. If a bullish structure is detected, the value of "trendDirection" is set to 1, indicating an uptrend.

Macro Score - Dem. Fib. McGinley DynamicsA "macro score", as defined here, is created by giving various weights to different signals and adding them together to get one smooth score. Positive or negative values are assigned to each of the signals depending on if the statement is true or false (e.g. DPO > 0: +1, DPO < 0: -1). This manner of strategy allows for a subset of the available signals to be present at one time as opposed to every technical signal having to be active in order for a long/short signal to trigger.
The DFMG - Democratic Fibonacci McGinley Dynamic - is a separate indicator that we have released that takes 10 different Fibonacci McGinley Dynamics (lengths of 3 to 233, at Fibonacci intervals) and averages them to form the DFMG line. This helps by creating a consensus on the trend based on these dynamic lines alone. Crossovers of the DFMG with the various McGinley lengths as well as a cross of the price source and these lines can provide adequate long and short signals.
This strategy has the signals and weights pre-determined in the code. Heaviest weights have been given to crosses of the DFMG line/McGinley(233) as well as the crosses of the McGinley(3)/DFMG. Additionally, there are thresholds for DPO ( Detrended Price Oscillator , above or below 0), CMO ( Chande Momentum Oscillator , above or below 0), Jurik Volatility Bands (above or below 0), and Stoch RSI (above or below 50). These four signals hold a lighter weight than the McGinley cross signals.
The macro score itself is printed in an underlay as a white line that goes between -10 and 10 for this strategy. In addition to the macro score line, a green momentum line (sourced by the macro score itself) has been included. A crossover/crossunder of the macro score and the macro momentum line is included into the long/short signal syntax in addition to long and short thresholds for the macro score, defaulted to 5 and -5 respectively.
Take profit, stop loss, and trailing percentages are also included, found at the bottom of the Input tab under “TT and TTP” as well as “Stop Loss”. Make sure to understand the TP/SL ratio that you desire before use, as the desired hit rate/profitability percentage will be affected accordingly. The option for adding in a trailing stop has also been included, with options to choose between an ATR-based trail or a percentage-based trail.
This strategy does NOT guarantee future returns. Apply caution in trading regardless of discretionary or algorithmic. Understand the concepts of risk/reward and the intricacies of each strategy choice before utilizing them in your personal trading.
Profitview/Pineconnector Settings:
If you wish to utilize Profitview’s automation system, find the included “Profitview Settings” under the Input tab of the strategy settings menu. If not, skip this section entirely as it can be left blank. Options will be “OPEN LONG TITLE”, “OPEN SHORT TITLE”, “CLOSE LONG TITLE”, and “CLOSE SHORT TITLE”. If you wished to trade SOL, for example, you would put “SOL LONG”, “SOL SHORT”, “SOL CLOSE LONG”, and “SOL CLOSE SHORT” in these areas. Within your Profitview extension, ensure that your Alerts all match these titles. To set an alert for use with Profitview, go to the “Alerts” tab in TradingView, then create an alert. Make sure that your desired asset and timeframe are currently displayed on your screen when creating the alert. Under the “Condition” option of the alert, select the strategy, then select the expiration time. If using TradingView Premium, this can be open-ended. Otherwise, select your desired expiration time and date. This can be updated whenever desired to ensure the strategy does not expire. Under “Alert actions”, nothing necessarily needs to be selected unless so desired. Leave the “Alert name” option empty. For the “Message”, delete the generated message and replace it with {{strategy.order.alert_message}} and nothing else. If using Pineconnector, follow the same directions for setting up an alert, but use the " ,buy, ,risk=" syntax as noted in the tooltips.
Default Properties for AVAX 20M:
DPO - 35 , uncentered
CMO - 25, open
K/D - 3/3
RSI Stoch Length - 3
Stoch Length - 4
Stoch Source - open
JVB Length - 14
JVB Smoothing - 2
DFMG source - close
Macro Length - 14
TP % - 1.5%
TTP % - 0.005%
SL % - 1.8%, no trail

Setup Max e Min Larry WilliansLarry Williams used this system to win the trading championship
Hello friends, I bring a script with a trading strategy to be used in futures such as Index, Forex and Commodities. Developed by famous trader Larry Williams.
In them we use two 3-period Simple Moving Averages (Arithmetic) (one with the high price, the other with the low price), and a 21-period Moving Average (Arithmetic) to determine the trend. This will form an average channel with the prices of the maximums and minimums of the last three candles.
Best time charts use the strategy: from 5 minutes to 60 minutes.
This strategy is quite simple. The 21 Moving Average will color according to the trend (Green for bullish, Red for bearish and Gray for transitions). The Script will signal the entry according to the trend by the colors of the candles and also by the signal:
When green, the buy will be on the crossing of the lower Moving Average crossing the candlestick, and the exit will be on the crossing of the candlestick on the next Upper Moving Average.
When red, the sell will be at the crossing of the Upper Moving Average crossing the candlestick, and the exit will be at the crossing of the candlestick on the next Lower Moving Average.
When the Script signals the candle with a purple X, it means that the trend is changing and the entire open operation must be closed.
This system has no Stop, so be careful when using it.
Na linguagem do autor:
Larry Williams usou esse sistema ganhar campeonato de trade
Olá amigos, trago um script com uma estratégia de trade pra ser usada em futuros como Índice, Forex e Commodities. Desenvolvido pelo famoso trader Larry Willians.
Neles usamos duas Médias Móveis Simples (Aritmética) de 3 períodos (uma com o preço da máxima, outra com o preço da mínima), e uma Média Móvel (Aritmética) de 21 períodos para determinar a tendência. Nisso vai formar uma canal de médias com os preços das máximas e mínimas dos últimos três candles.
Melhores tempos gráficos usar a estratégia: de 5 minutos até 60 minutos.
Essa estratégia é bem simples. A Média Móvel de 21 irá colorir de acordo com a tendência (Green pra alta, Red para baixa e Gray para transições). O Script irá sinalizar a entrada de acordo com a tendência pela cores dos candles e também pela sinalização:
Quando green, a compra será no cruzamento da Média Móvel inferior cruzando o candle, e a saida será no cruzamento do candle na Média Móvel Superior seguinte.
Quando red, a venda será no cruzamento da Média Móvel Superior cruzando o candle, e a saida será no cruzamento do candle na Média Móvel Inferior seguinte.
Quando o Script sinaliza o candle com X purple, significa que a tendência está em mudança e deve ser fechada toda a operação em aberto.
Este sistema não possui Stop, portando cuidado quanto a seu uso.

Alex trading stragedyOverview
This script, named "ALEX TRADING STRATEGY", is a technical trading strategy designed for new investing groups. It uses a combination of various technical indicators to identify potential buying and selling opportunities in the market. The script includes the Relative Strength Index (RSI), Simple Moving Averages (SMA), Exponential Moving Averages (EMA), and Higher High Lower Low (HHLL) strategies to create a complete trading solution.
The user can change the position from long to short in the Input Settings. The script uses bar colors to indicate the current trading position. The script also has exit strategies to help manage the open trades. The user can also set the period for the various indicators used in the strategy.
The script provides various technical indicators and entry/exit signals to make the trading decision easier for the user. It also includes pivot lines, resistance and support levels to help the user make a more informed decision.
This Pine script implements a multi-indicator trading strategy that combines several technical analysis techniques for making trading decisions. The script uses the Relative Strength Index (RSI) to determine overbought and oversold conditions in the market and plots the RSI values on the chart. The RSI values above 70 are considered overbought and plotted as red upward triangles, while the RSI values below 30 are considered oversold and plotted as green downward triangles.
The script also calculates Simple Moving Averages (SMAs) with the user-defined period and plots them along with the Exponential Moving Averages (EMAs) of 20, 50, and 100 periods. Based on the crossover of the close price and the moving averages, the script enters long or short trades. The script sets the trade exit conditions as the low or high crossing the lower or upper band, respectively.
In addition to the moving average crossover, the script uses the highest high and lowest low over a user-defined period to determine long and short entries. The script plots the long and short conditions on the chart as green upward and red downward triangles, respectively. The script allows the user to switch between long and short trades by changing the input settings.
Finally, the script changes the bar colors based on the trade direction, with green bars indicating a long trade, red bars indicating a short trade, and blue bars indicating no trade. Overall, this Pine script provides a comprehensive trading strategy that combines several technical analysis techniques to make informed trading decisions.
HOW TO USE
Input Settings: In the Input Settings section, you can change the long to short position. You can also change the period value (default is 10) used to calculate the Simple Moving Average (SMA) for the Keltner channel.
Indicators: The script uses RSI (Relative Strength Index) with 14 periods as well as multiple EMAs (Exponential Moving Averages) with periods 20, 50, and 100 to help in making trading decisions.
Entry Signals: The script uses two main entry signals: (1) Keltner Channel and (2) HHLL (High-Low). When the closing price crosses above the upper band of the Keltner channel, the script generates a long signal, and when the closing price crosses below the lower band of the Keltner channel, the script generates a short signal. The HHLL strategy generates a long signal when the current high crosses above the highest high of the last "nPeriod" bars, and generates a short signal when the current low crosses below the lowest low of the last "nPeriod" bars.
Exit Signals: The script uses two exit signals: (1) Stop Loss based on Keltner channel and (2) Profit Target based on Keltner channel. The script exits the long position when the closing price crosses below the lower band of the Keltner channel, and the script exits the short position when the closing price crosses above the upper band of the Keltner channel.
To use this script, you will need to have access to a trading platform that supports PineScript, such as TradingView, and attach the script to a chart. The script will then automatically generate entry and exit signals based on the rules described above. It's important to note that this script is just a tool and not a guarantee of profit. As with any trading strategy, it's important to thoroughly test and understand the script before using it for live trading.

Strategy: Range BreakoutWhat?
In the price action, levels have a significant role to play. Based on the price moving above/below the levels - the underlying instrument shows some price-action in the direction of breakout/breakdown.
There are plenty of ways level can be determined. Levels are the decision point to take a trade or not. But if we make the level derivation complex, then the execution may get hamper.
This strategy script, developed in PineScript v5, is our attempt at solving this problem at the core by providing this simple, yet elegant solution to this problem.
It's essentially an attempt to Trade Simple by drawing logical (horizontal) lines in the chart and take actions, after multiple associated parameters confirmation, on the breakout / breakdown of the levels.
How?
Let us explain how we are drawing the levels.
We are depending on some of the parameters as described below:
Open Range : During intraday movement, often if prices move beyond a particular level, it exibits more movement in the same swing in same direction. We found out, through our back testing for Indian Indices like NSE:NIFTY , NSE:BANKNIFTY or NSE:CNXFINANCE the first 15m (i.e 09:15 AM to 09:30 AM, IST) is one of such range. For Indian stocks, it is 9:15 to 9:45. And for MCX MCX:CRUDEOIL1! it's 5:00 pm to 6:00 pm. There are our first levels.
PDHCL : Previous Day High, Close, Low. This is our next level
VWAP : The rolling VWAP (volume weighted average price)
In the breakout/breakdown of the Open Range and Previous Day High/Low, we are taking the trade decisions as follows using CEST principle:
C onditions :
If current bar's (say you are in 5m timeframe) closing is broken out the Open Range High or Previous Day High, taken a Buy/Long decision (let's say buying a Call Option CE or selling a Put Option PE or buying the future or cash).
If current bar's (say you are in 5m timeframe) closing is broken down the Open Range Low or Previous Day Low, taken a Sell/Short decision (let's say buying a Put Option CE or selling a Call Option PE or selling the future or cash).
Additionally, and optionally (default ON, one can turn off): we are checking various other associated multiple confirmations as follows:
1. Momentum : Checking 14-period RSI value is more than 50 or less than 50 (all parameters like period, OB, OS ranges are configurable through settings)
2. Current bar's volume is more than the last 20 bars volume average. How much more - that multiplier is also configurable. (default is 1)
3. The breakout candle is bullish (green) or bearish (red).
E ntry :
All of these happens only on the closing of the candle . Means: Non Repainting! .
Clearly in the chart we are showing as green up arrow BO (breakout for buy) and red down arrow BD (breakdown for sell) to take your decision process smooth.
So, on the closing of the decision BO/BD candle we are entering the trade (with a thumping heart and nail biting ...)
S top Loss :
We are relying on the time tasted (last 40 years) mechanism of Average True Range (ATR) of default 14 period. This default period is also configurable.
So for Long trades: the 14 period ATR low band is the SL.
For Short trades: the 14 period ATR high band is the SL.
T arget :
We are depending on the thump rule of 1:2 Risk Reward. It's simple and effective. No fancy thing. We are closing the trade on double the favorable price movement compared to the SL placed. Of course, this RR ratio is confiurable from the settings, as usual.
What's Unqiue in it?
The utter simplicity of this trading mechanism. No fancy things like complex chart pattern, OI data, multiple candlestick patterns, Order flow analysis etc.
Simple level determination,
Marking clearly in the chart.
Making each parameter configurable in Settings and showing tooltip adjacent to the parameter to make you understand it better for your customization,
Wait for the candle close, thus eliminating the chances of repainting menace (as much as possible)
Additional momentum and volume check to trade entry confirmation.
Works with normal candlestick (nothing special ones like HA ...)
Showing everything as a Summary Table (which, again can be turned off optionally) overlaying at the bottom-right corner of the chart,
Optionally the Summary Table can be configured to alert you back (say you get it notified in your email or SMS).
That way, a single, simple, effective trade setup will ease your journey as smooth sail as possible.
Mentions
There are plenty of friends from whom time to time we borrowed some of the ideas while working closely together over last one year.
From tradingview community, we took the spirit of @zzzcrypto123 awesome work done long back (in 2020) as the indicator "ORB - Opening Range Breakout". (We tried to reach him for his explicit consent, unable to catch hold of him).
Some other publicly available materials we have consulted to get the additional checks (like RSI, volume).
Lat word
Use it please and thank you for your constant patronage in following us in this awesome platform. Let's keep growing together.
Disclaimer :
This piece of software does not come up with any warrantee or any rights of not changing it over the future course of time.
We are not responsible for any trading/investment decision you are taking out of the outcome of this indicator.

Flying Dragon Trend StrategyFlying Dragon Trend Strategy can be used to indicate the trend on all timeframes by finetuning the input settings.
The Flying Dragon Trend family includes both the strategy and the indicator, where the strategy supports of selecting the optimal set of inputs for the indicator in each scenario. Highly recommended to get familiar with the strategy first to get the best out of the indicator.
Flying Dragon Trend plots the trend bands into the ribbon, where the colours indicate the trend of each band. The plotting of the bands can be turned off in the input settings. Based on the user selectable Risk Level the strategy is executed when the price crosses the certain moving average line, or at the Lowest risk level all the bands have the same colour.
The main idea is to combine two different moving averages to cross each other at the possible trend pivot point, but trying to avoid any short term bounces to affect the trend indication. The ingenuity resides in the combination of selected moving average types, lengths and especially the offsets. The trend bands give visual hint for the user while observing the price interaction with the bands, one could say that when "the Dragon swallows the candles the jaws wide open", then there is high possibility for the pivot. The leading moving average should be fast while the lagging moving average should be, well, lagging behind the leading one. There is Offset selections for each moving average, three for leading one and one for the lagging one, those are where the magic happens. After user has selected preferred moving average types and lengths, by tuning each offset the optimal sweet spot for each timeframe and equity will be found. The default values are good enough starting points for longer (4h and up) timeframes, but shorter timeframes (minutes to hours) require different combination of settings, some hints are provided in tooltips. Basically the slower the "leading" moving average (like HMA75 or HMA115) and quicker the "lagging" moving average (like SMA12 or SMA5) become, the better performance at the Lowest risk level on minute scales. This "reversed" approach at the minute scales is shown also as reversed colour for the "lagging" moving average trend band, which seems to make it work surprisingly well.
The Flying Dragon Trend does not necessarily work well on zig zag and range bounce scenarios without additional finetuning of the input settings to fit the current condition.
Strategy direction selector by DashTrader.

ASE Supply & Demand█ Introduction
ASE Supply & Demand is a multi-timeframe Supply and Demand zone indicator based on the Order Block concept. Order Blocks are a price action concept defined as a basing candle followed by a breakout candle (as seen in the chart below). A basing candle typically shows a slowing down in price action, foreshadowing a reversal and initial institutional activity. The breakout candle then confirms institutional activity with a displacement candle in the opposite direction of the basing candle. Additionally, there is an advanced feature called “Potentials,” which allows us to see price action forming S&D zones beforehand & trapped positions live through the same Order Block concept.
█ Supply and Demand Zones
The Supply & Demand zones are plotted on 8 timeframes (5m, 15m, 30m, 1hr, 2hr, 3hr, 4hr, D). In addition, there are custom settings that allow the trader to filter for the most significant zones and to cohere to their trading style:
Range Multiplier
Filters the creation of a zone based on the basing candle of Supply/Demand(0-5)
The size of the basing candle must be smaller than 0-5 times the True Range Index to create Supply/Demand.
If the basing candle range is smaller than the True Range Index, this can foreshadow the potential of institutional activity as price slows down, and a potential reversal might occur.
True Range Index
The number of bars to calculate the True Range in Range S+D mode.
Displacement Sensitivity
Filters the creation of a zone based on the displacement from the base (0-20)
Calculated by taking the breakout range (as seen in the chart below) divided by the range of the basing candle
0 = less significant, more zones
20 = more significant, fewer zones
Zone Strength Filter %
Filter out current zones based on how strong they are (0-100)
Calculated by the amount of fill within a zone. By changing the Zone Strength Filter, you can display zones that have not breached the filter % you select. For example, if you choose 80% Zone Strength, that means it will only show zones that are 20% filled or less; in other words, zones that have 80% or more yet to be filled.
0 = All Zones
100 = Completely unused zones
With these advanced filters and plotting on multiple timeframes, we have created the best Supply and Demand Indicator . In addition, these filters help to eliminate insignificant zones and noise in the market, leaving us a clean chart.
█ Potentials
Potentials foreshadow the possibility of a Supply or Demand Zone forming, the possibility of a Trapped concept, and it works great as targets or influence in our trades.
Potentials are calculated by the same Order Block concept, which allows us to see Supply & Demand/Order Blocks forming in real-time.
When a potential is triggered and holds, the line turns solid. If it continues to hold, it has the potential of forming a Supply/Demand zone based on the trader's Zone Filters. If the price pulls back and fails to hold, it will go back to dotted. Inferring it used the potential as liquidity and is potentially trapping market participants at that potential.
█ How To Use:
Supply and Demand Zones are the ‘Where’ to our trade but not the ‘Why.’ This means that the zones are our POI (Point of Interest) and ‘Where’ we want to be looking for a trade. It is not our ‘Why’ because we do not enter just because we are in a zone. This is because we expect pivots or reversals inside our Supply & Demand zones, and this rarely happens quickly.
What we want to look for in our zones is a solid base for our reversals. Simply put, we want to see new demand forming at our Demand Zones and new supply forming at our Supply Zones. This can be achieved by observing the ‘Potentials’ feature which allows us to see new Order Blocks or ‘Base Candles’ forming. With a trained eye, the ‘Potentials’ feature is highly effective in addition to its ‘Trapped’ logic which can offer entries on their own. The "Trapped" label on potentials shows potential trapped buyers or sellers after we reach that level. Observing and understanding how price action facilitates, especially around the zones, is crucial to its usability. In addition, other strategies or indicators can be used in confluence to support bounces out of demand and rejections out of supply.
Ultimately once we find a viable entry, we want to see a complete cycle. For example, if we caught a bounce out of demand with new demand forming, we would want to see the cycle complete and us reach the next supply or manufacture new supply. The ‘Potentials’ feature is the easiest way to gather multiple targets and at the same time offers stop loss management.
█ Settings:
Enable Supply/Demand/ Zones and Potential Liquidity
STF S&D Zones - Enables 5 minute and 15 minute timeframe for zones
LTF S&D Zones - Enables 30 minute and 1 hour timeframe for zones
HTF S&D Zones - Enables 2 hour, 3 hour, and 4 hour timeframe for zones
Daily S&D Zones - Enables Daily timeframe for zones
Enable Potentials
Supply Demand Zone Models
Range - Filters zones based on the range of candles before supply/demand
Displacement - Filters zones based on the displacement of the breakout candle
Range + Displacement - Filters zones based on the displacement of breakout candle and range of the candles before supply/demand
Supply Demand Zone Filters (see “Supply and Demand Zones” section for usage)
Range Multiplier
True Range Index
Displacement Sensitivity
Zone Strength Filter %
Deletion Conditions
Confirmed - Deletes zone upon time-frame close above supply or below demand
On Break - Deletes zone upon break above the top of supply or break below bottom of demand
On Tap - Deletes zone upon the touch of supply or demand
Other Settings
Price Labels - Turns on Zone Price Levels
Supply/Demand Color Input - Customize color of zones to your liking
Supply Demand Border Width - Change the border width of zones (0 would be completely borderless zones)
Supply Demand Transparency - Change transparency of zones (0 is completely solid zones, 100 is completely transparent)
Transparency Input - "Normal" Transparency stays at the level that's set; "Decrease with price" as price moves through, the zones become more transparent
Default Color - Changes color of any text/labels (default is gray)
Text size - Change size of text on labels
Trend Movement S1-TMIdea:
This script combines: Moving Average (MA), Directional Movement (DMI), MACD
When condition of long or short position from all mentioned indicator are met script opens position. Once trend changes, it closes the position.
Then add some filter conditions to avoid noise.
Concept:
(Note that we take the close to get the closing price)
-Using only cross up down with MA will give a reversal point, but the downside is that it can be noisy.
-MACD will show the current trend detected by cross point.
-Then the +DI , -DI , ADX values are taken into account to confirm the price direction and movement strength.
-This strategy solves this problem by combining 2 more moving averages called 2 trend lines 1 long and 1 short. When the short line crosses up, it will show that the price trend is increasing (at this time the background between these 2 lines will be green) and vice versa (red). To determine if the current trend is bullish or bearish . This will avoid buying when price tend to go down.
-However, there will be many points where some more complex logic is needed. It will add conditions and calculate the probabilities before triggering the signals (You can see them through the item symbols B1, B2, ... ).
How it works:
1. The thin line is stand for short term moving average, and the thick line is stand for long term moving average.
If thin lines cross the thick lines, their color and background will turn green, the price is tend to go up (Uptrend).
If thin lines cross down thick lines, their color and background will turn red, the price is tend to go down (Downtrend).
2. Ability to check the checkbox in setting to show the Golden/De*ath cross.
The yellow symbol "+" is the Golden cross.
The black symbol "+" is the De*th cross.
3. Buy and Sell are show clearly on strategy as the buy and sell point. The default source from bar is CLOSE
4. Setting "Buy only" it using for spot market.
5. When "Not buy in down trend" is checked, it will not trigger buy when in down trend (thin lines cross down thick lines like description in 1.)
6. Setting High spread will call Close buy when it match the High spread bar with the High spread % value
7. It provides setting "Back test From date/To date" for backtest feature. You can set "BacktestFrom date" as the begin of test period. If check box "Using To Date" is check: "Backtest To Date" will be the end of test period.
Suitable time frames:
4h, 1D, 1W
* Please note that this logic does not attempt to predict future prices or 100% accurate signal; Strategy Tester are available to test the profitability of this strategy.
(INVITE ONLY indicator. Please direct message or visit website to try it out)
Hope you guys enjoy!
Examples:
BTCUSD 4H
TSLA 4H

Stockbee Momentum BurstThis is a script to color code bars based on the bullish- and bearish combination.
Bullish Combination
Percent: Price >= 4% from yesterday and Volume today > Yesterday
Dollar: Price >= 0.9 dollar from open
Base Requirements
- Price > Yesterday's close
- Price > Open
- Price is within 30% of high
- Todays price range >= Yesterdays price range
- Yesterday's move <= 2%
- Volume >= 100 000
Bearish Combination
Percent: Price <= 4% from yesterday and Volume today > Yesterday
Dollar: Price <= 0.9 dollar from open
Base Requirements
- Price < Yesterday's close
- Price < Open
- Price is within 30% of low
- Todays price range >= Yesterdays price range
- Yesterday's move >= -2%
- Minimum volume for each of last 3 days >= 100 000
Momentum Filter
These are based on the 10 and 20 EMA crossover, where the former above would indicate upward momentum and below downward momentum. This can help to narrow down the color code to continuation phases. The linked option will override all other momentum filters, bullish candles will be displayed when EMA 10 > 20 and bearish candles when EMA 10 < 20.

RSI Bands [APIDEVs]RSI BANDS:
It is an exclusive product of ApiDevs, this indicator selectively integrates a series of highly advanced algorithms that aim to provide the trader with an effective and profitable trading system, based on a series of conditions that project the price direction with a reasonable probability.
This indicator bears the name of “RSI Bands”, this is because we have based this trading system on the “Relative Strength Index ( RSI )”, the strength of this indicator is centennial and we at APIDEVs have decided to focus our efforts on the development of powerful tools based on the favorite indicators of the afternoon.
WHAT IT HAS INCORPORATED:
1. Exponential Moving Average (EMAs): The RSI Bands has, by default, a band composed of two moving averages of 10 and 55 exponential periods, which can be modified in the indicator menu.
• Possibility of changing the value of the EMAs.
• Function was enabled to change the color and transparency of the bands.
• Visual alerts SHORT (L) and LONG (L) were added when there is the crossing of the EMAS.
• Hull Moving Average ( HMA ) of 100 periods was also incorporated, also modifiable for those who wish to strengthen their visual analysis. (Disabled by default)
• We also add an Exponential Moving Average ( EMA ) of 200 periods to mark the trend. (Disabled by default).
2. ATR ( Average True Range ): This indicator has two main functions in the RSI Bands, the first is to mark the trend of the asset and the second is to establish a margin of safety in price volatility , that is, a maximum estimate of the setbacks without this representing a change in the direction of the price.
3. RSI ( Relative Strength Index ): It was visually incorporated into the RSI Bands, the graph is obtained on the right side and its purpose is to visually indicate where the price is with respect to the RSI PRO+ indicator, offering the following improvements :
• ALERT SYSTEM: THE RSI PRO+ has the ADX incorporated into its algorithm, which allows establishing a filter that will provide reliable inputs, represented by the LONG (L) and SHORT (S) signals.
• FILTER AGAINST TREND: The signals described above will be activated according to the crossing of the RSI above the 50 point, provided that the ADX agrees with the market direction.
• Possibility of deactivating this graphical representation.
4. ADX ( Average Directional Index ): The ADX in this indicator is intended to estimate the strength of the movement, it is present in each part of the code, either to indicate the strength of the market or to serve as a filter against trend. In the same way, we apply certain exclusive improvements for this indicator:
• It was established as default values of the ADX that the Level Range was 10 and the Level Trend 25. This significantly changes the behavior of this indicator, almost completely eliminating the zone of disinterest that was usually considered.
• A function was activated to paint the sails the color of the ADX .
5. ADX Ocillator: Yes, we developed a Wave oscillator type ADX and incorporated it into this strategy. From this indicator, which we recommend using in conjunction with the RSI Bands, we extracted the LONG (L) and SHORT (S) signals. The ADX Oscillator is the improved version of the traditional ADX as it offers the following improvements:
• Its interpretation is much simpler.
• Allows you to set entry and exit signals during the trend change and during the price path.
• It has an integrated alert system.
STRATEGY PANEL:
This panel is an exclusive creation of APIDEVs, and its purpose is to parameterize five conditionals based on the indicators that make up our RSI strategy, giving the trader an immediate vision of the status of the asset analyzed considering this strategy. That is, we decided to transfer our experience of using this indicator on a panel that will project the price trajectory visually. It has the following characteristics:
• It can be placed anywhere on the screen through the main menu of the indicator, it can even be deactivated.
• It can be resized, we designed this to adapt to all types of screens, including those of mobile phones.
• It has an upper panel called "Project" which will calculate the percentage probability that the price has to take a direction based on all the indicators incorporated into the strategy. Their values range from (+ 100%) to (-100%).
STRATEGY PANEL PARAMETERS:
1. EMAs: This panel has 2 variables:
• LONG: If the fast EMA is above the slow EMA .
• SHORT: If the fast EMA is below the slow EMA .
2. RSI: This panel has 3 variables:
• LONG: The RSI should be bullish (green) and above the 50 point.
• SHORT: The RSI should be bearish (red) and be below the 50 point.
• RANK: (Range)this condition is activated when there is no concordance with the RSI condition and its crossing.
3. ATR: This panel has 2 variables:
• LONG: When the price is above the ATR.
• SHORT: When the price is below the ATR.
4. ADX: This panel has 3 variables:
• LONG: The ADX is green. That is, the DI + is above the DI-.
• SHORT: The ADX is red. That is, the DI- is above the DI +.
• RANK: ADX is below point 10.
It also has a numerical value that indicates the value of the ADX and two texts indicating the strength of the trend:
• Trend ( bullish or bearish ).
• Strong trend ( bullish or bearish ).
5. OSC: This panel has 3 variables:
• LONG: The oscillator slopes upward and the built-in ADX is green.
• SHORT: The oscillator slopes downward and the built-in ADX is red.
• RANK: The oscillator slopes downward and the built-in ADX is green and the opposite. In short, there is no coherence in the movement of the oscillator and the projection of the ADX .

Selected Dates Filter by @zeusbottradingWe are presenting you feature for strategies in Pine Script.
This function/pine script is about NOT opening trades on selected days. Real usage is for bank holidays or volatile days (PPI, CPI, Interest Rates etc.) in United States and United Kingdom from 2020 to 2030 (10 years of dates of bank holidays in mentioned countries above). Strategy is simple - SMA crossover of two lengts 14 and 28 with close source.
In pine script you can see we picked US and GB bank holidays. If you add this into your strategy, your bot will not open trades on those days. You must make it a rule or a condition. We use it as a rule in opening long/short trades.
You can also add some of your prefered dates, here is just example of our idea. If you want to add your preffered days you can find them on any site like forexfactory, myfxbook and so on. But don’t forget to add function “time_tradingday ! = YourChoosedDate” as it is writen lower in the pine script.
Sometimes the date is substituted for a different day, because the day of the holiday is on Saturday or Sunday.
Made with ❤️ for this community.
If you have any questions or suggestions, let us know.
The script is for informational and educational purposes only. Use of the script does not constitutes professional and/or financial advice. You alone the sole responsibility of evaluating the script output and risks associated with the use of the script. In exchange for using the script, you agree not to hold zeusbottrading TradingView user liable for any possible claim for damages arising from any decision you make based on use of the script.

Macro Score - DFMA-BasedA "macro score", as defined here, is created by giving various weights to different signals and adding them together to get one smooth score. Positive or negative values are assigned to each of the signals depending on if the statement is true or false (e.g. DPO > 0: +1, DPO < 0: -1). This manner of strategy allows for a subset of the available signals to be present at one time as opposed to every technical signal having to be active in order for a long/short signal to trigger.
The DFMA - Democratic Fibonacci Moving Average - is a separate indicator that we have released that takes 10 different Fibonacci MAs (lengths of 3 to 233, at Fibonacci intervals) and averages them to form the DFMA line. This helps by creating a consensus on the trend based on moving averages alone. Crossovers of the DFMA with the various Fib MA lengths as well as a cross of the price source and these lines can provide adequate long and short signals.
This strategy has the signals and weights pre-determined in the code. Heaviest weights have been given to crosses of the DFMA line/Fib MA (233) as well as the crosses of the Fib MA (3)/DFMA. Additionally, there are thresholds for DPO ( Detrended Price Oscillator , above or below 0), CMO ( Chande Momentum Oscillator , above or below 0), Jurik Volatility Bands (above or below 0), and Stoch RSI (above or below 50). These foursignals hold a lighter weight than the MA cross signals.
The macro score itself is printed in an underlay as a white line that goes between -10 and 10 for this strategy. In addition to the macro score line, a blue momentum line (sourced by the macro score itself) has been included. A crossover/crossunder of the macro score and the macro momentum line is included into the long/short signal syntax in addition to a threshold for the macro score (-5/5).
Take profit, stop loss, and trailing percentages are also included, found at the bottom of the Input tab under “TT and TTP” as well as “Stop Loss”. Make sure to understand the TP/SL ratio that you desire before use, as the desired hit rate/profitability percentage will be affected accordingly. This strategy does NOT guarantee future returns. Apply caution in trading regardless of discretionary or algorithmic. Understand the concepts of risk/reward and the intricacies of each strategy choice before utilizing them in your personal trading.
Profitview Settings:
If you wish to utilize Profitview’s automation system, find the included “Profitview Settings” under the Input tab of the strategy settings menu. If not, skip this section entirely as it can be left blank. Options will be “OPEN LONG TITLE”, “OPEN SHORT TITLE”, “CLOSE LONG TITLE”, and “CLOSE SHORT TITLE”. If you wished to trade SOL, for example, you would put “SOL LONG”, “SOL SHORT”, “SOL CLOSE LONG”, and “SOL CLOSE SHORT” in these areas. Within your Profitview extension, ensure that your Alerts all match these titles. To set an alert for use with Profitview, go to the “Alerts” tab in TradingView, then create an alert. Make sure that your desired asset and timeframe are currently displayed on your screen when creating the alert. Under the “Condition” option of the alert, select the strategy, then select the expiration time. If using TradingView Premium, this can be open-ended. Otherwise, select your desired expiration time and date. This can be updated whenever desired to ensure the strategy does not expire. Under “Alert actions”, nothing necessarily needs to be selected unless so desired. Leave the “Alert name” option empty. For the “Message”, delete the generated message and replace it with {{strategy.order.alert_message}} and nothing else.
Default Properties, for AVAX 20M:
DPO - 40, uncentered
CMO - 25, open
K/D - 3/3
RSI Stoch Length - 3
Stoch Length - 4
Stoch Source - open
JVB Length - 25
JVB Smoothing - 2
DFMA source - close
Macro Length - 13
TP % - 1.5%
TTP % - 0.005%
SL % - 2%

[Strategy]Turtle's 20day High Low Break StrategyJapanese below / 日本語説明は下記
Overview
I have made this strategy mimicking the legendary traders group, Turtle’s 20days high low break strategy with more options available for take profit(TP) and stop loss(SL) conditions.
The main component of the strategy is same as my indicator, Previous N days/weeks/months high/low(see the link below) and with this strategy, you can backtest previous N days high/low break strategy.
Unlike the indicator, you can specify another previous N days high/low as TP condition. This is because Turtle used 10days low as TP condition for 20days high break buy strategy, according to articles/books about them.
ATR and other factors which is said to be used in their original strategy are not included in this strategy.
Previous N Days/Weeks/Months High Low
What is Turtle?
Turtle is the group of traders founded by Richard Dennis and William Eckhardt to prove their theory that good traders can be trained or not.
It is said that Turtle had made more than 175 million dollars over 5 years and some of the traders has become fund managers or successful individual traders even after the experiment.
What is this strategy like?
The strategy generates long entries once prices break previous N days highs and short entries when previous N days lows broken.
N is user input so you can adjust it for your own strategy.
As mentioned above, you can also specify another set of different previous N days high/low for TP conditions.
e.g. 55 days high(low) break for entry and 20days low(high) break for take profit condition.
How to use it?
What this strategy shows is almost same as the indicator, Previous N days/weeks/months high/low.
It displays previous N days/weeks/months highs and lows and you can set up entry condition based on previous N days high/low.
Previous N weeks/months highs/lows can be used as take profit points when you develop your own strategy based on this.
See the parameters below for the rest of the details.
Parameters
TP condition:
You can select from “Pips”, “When opposite entries” or “Previous high low break”.
When “When opposite entries” selected, the strategy exits the open positions when opposite directional entries happened. e.g. Long positions will be closed when short entries made.
If you would like to exit positions with specific previous N days highs/lows, you can enter N in Previous N days High/Low for TP field with “Previous high low break” selected.
SL condition:
You can select from “Pips” or “Swing High/Low”.
If “Swing High/Low” selected, left bars and right bars need input to determine swing high/low.
Note: If you select “pips” in TP/SL conditions, it currently works only for forex pairs.
What timeframe is the best for this strategy?
As this strategy is for swing trading, longer timeframes are the best.
Base on my quick check upon strategy’s performance over USD pairs in forex, daily timeframe works best, however, it could fit in with lower timeframes such as 4H and 1H by adjusting TP/SL conditions.
Look at the sample result below. The result shows the strategy’s performance for USDJPY for over 40 years on Daily timeframe and it performs fairly good with more than 2 profit factor over long period of time with up-trending equity curve.
It is just a simulation but the data shows Turtle’s strategy still works.
=================
概要
伝説のトレーダー集団タートルの20日高値・安値ブレイク手法を模倣して作成したストラテジーです。
利益確定や損切り条件を設定可能なようにして、より柔軟性を持たせています。
ストラテジーの主要な構造は過去にリリースしたインジケーターPrevious N days/weeks/months high/lowと同じです(下記リンク参照)。
このストラテジーを使うと、過去N日高値・安値のブレイク手法のバックテストを行うことが可能です。
また、前述のインジケーターとは異なり、このストラテジーでは利益確定条件のために、もう一つ別の過去N日高値・安値を設定することができます。これはタートルが20日高値のブレイクで買いエントリーを行う場合、10日安値ブレイクを手仕舞いの基準として使っていたことからです。
タートルのオリジナル手法ではATRやその他の要素も用いられていたようですが、このストラテジーには含まれていません。
Previous N Days/Weeks/Months High Low
タートルとは何か?
タートルとは、「優れたトレーダーは育成可能か?」の問いを証明するために、投資家リチャード・デニス氏とウィリアム・エックハート氏によって組織されたトレーダー集団です。
タートルは5年間に渡って1億7千5百万ドル以上を稼ぎ出したと言われており、この実験終了後にはヘッジファンドを運営する者や個人投資家として成功したトレーダーを輩出したことで知られています。
このストラテジーの特徴
このストラテジーは、価格が過去N日高値をブレイクした時にロングエントリーを、過去N日安値をブレイクした時にショートエントリーを実行します。
Nはパラメーターで指定可能なので、皆さんの独自の手法開発のために調整することができます。
また、前述の通り、利益確定条件としてエントリー条件とは別の過去N日高値・安値を指定することが可能です。
例:エントリーには55日の高値・安値のブレイクを用い、決済には20日高値・安値のブレイクを用いるなど。
使い方
このストラテジーは前述のインジケーターとほぼ同じ内容のラインを表示します。
過去N日、N週間、Nヶ月の高値・安値を表示でき、エントリーの条件として過去N日高値・安値を指定することができます。
過去N週・Nヶ月高値・安値ラインは利益確定の目安に用いるなど、皆さんが独自の手法を構築するときの参考として使ってください。
その他のパラメーターについては以下の詳細を参照ください。
パラメーター:
TP condition(利益確定条件):
“Pips(Pips指定)”, “When opposite entries(逆方向エントリー時)” or “Previous N days high low break(過去N日高値・安値)”から選択することができます。
“When opposite entries” を選択した場合、現在のポジションは、現在ポジションとは逆方向のエントリー条件が満たされた時に、決済されます。
例: ロングポジションはショートのエントリーが実行されると同時に決済される。
特定の過去N日高値・安値ブレイクを決済条件としたい場合は、“Previous N days high low break”を選択の上、該当するN日を”Previous N days High/Low for TP”の項目に入力してください。
SL condition(損切り基準):
“Pips(Pips指定)”、“Swing High/Low(スウィングハイ・ロー)”から選択することができます。
“Swing High/Low”選択時は、高値・安値決定に必要な左右のバーの本数を指定します。
注:TP、SL条件でPipsを選択した場合は、現時点では為替通貨ペアのみに機能します。
このストラテジーに最適の時間軸は?
当ストラテジーはスウィングトレードの手法となっているため、長期の時間軸が適しています。
為替のドルストレートペアでの結果を見てみると日足が最も適していますが、利益確定や損切り条件を調整することで、4時間足や1時間足向きにもアレンジできると思います。
上に示したストラテジーの例は、ドル円の日足における過去40年間以上でのバックテストの結果ですが、これだけの長期に渡って右上がりのエクイティカーブとともにプロフィットファクター2近くを維持するなど、かなり良い結果と言えるのではないでしょうか。
これは一つのシミュレーション結果に過ぎませんが、データを見る限りタートルの手法は現在でも機能すると言えるでしょう。

Wunder Trend Reversal botWunder Trend Reversal bot
1. Wunder Trend Reversal Bot - this has only one goal to find a reversal of the trend.
2. The strategy determines, based on the specified value for the filter, a market reversal based on the price actions of the previous bars.
3. A short EMA is used to filter false signals after the reversal signal was received. Crossing the EMA and changing its direction confirms the trend change.
4. There are 2 ways to calculate stop loss and take profit. You can choose one of them:
- Classic stop loss and take profit in a fixed percentage
- ATR stop loss and take pro
5. ATR uses risk reward (R:R) to calculate take profit. The script calculates the risk-reward based on a certain stop loss level and uses it to calculate the take profit
6. A function for calculating risk on the portfolio (your deposit) has been added to the script. When this option is enabled, you get a calculation of the entry amount in dollars relative to your Stop Loss. In the settings, you can select the risk percentage on your portfolio. The loss will be calculated from the amount that will be displayed on the chart.
For example. Deposit - $1000, you set the risk to 1%. SL 5%. Entry volume will be $200. The loss at SL will be $10.10$ this is your 1% risk or 1% of the deposit.
Important! The risk per trade must be less than the Stop Loss value. If the risk is greater than SL, then you should use leverage.
The amount of funds entering the trade is calculated in dollars. This option was created if you want to send the dollar amount from Tradingview to the exchange. However, putting your volume in dollars you get the incorrect net profit and drawdown indication in the backtest results, as TradingView calculates the backtest volume in contracts.
To display the correct net profit and drawdown values in Tradingview Backtest results, use the ”Volume in contracts” option.

[-_-] Level Breakout, Auto Backtesting StrategyDescription:
A Long only strategy based on breakout from a certain level formed by High price. It has auto-backtesting capabilities (you set ranges for the three main parameters: Lookback, TP and SL; the strategy then goes through different combinations of those parameters and displays a table with results that you can sort by Percentage of profitable trades AND/OR Net profit AND/OR Number of trades). So you can, for example, sort only by Net profit to find combination of parameters that gives highest net profit, or sort by Net profit and Percentage profitable to find a combination of parameters that gives the best balance between profitability and profit. The auto-backtesting also takes into account the commission which is set in % in the inputs (make sure to set the same value in properties of the strategy so that auto-backtesting and real backtesting results match).
NOTE: auto-backtesting only find the best combinations and displays them in a table, you will then need to manually set the Lookback, TP and SL inputs for real backtesting to match.
Parameters:
- Lookback -> # of bars for filtering signals; recommended range from 2 to 5
- TP (%) -> take profit; recommended range from 5 to 10
- SL (%) -> stop loss; recommended range from 1 to 5
- Commission (%) -> commission per trade
- Min/Max Lookback -> lookback range for auto-backtesting
- Min/Max TP -> take profit range for auto-backtesting
- Min/Max SL -> stop loss range for auto-backtesting
- Percentage profitable -> sort by percentage of profitable trades
- Net profit -> sort by net profit
- Number of trades -> sort by number of trades

ETHUSDT Long-Short using EMA,OBV,ADX,LinearReg,DXY(No repaint)This script strategy is used to follow the trending EMA with a delta difference (Price-EMA) to know when to enter and with 5 variables mentioned below, stop loss is below EMA line all the time in long and above EMA line in short, is like a trailing stop after candle is closed. Hard stop is also placed to prevent big candles movements, also correlation between VIX and ETH when the correlation is <-0.2 the position can be opened.
Indicators used:
EMA , OBV , ADX , Linear regression and Dollar Index trending, Leverage is available for Long and Short positions.
LONG
When Price is above EMA and price-ema difference is smaller than "Long delta Price/MA"
OBV(4hrs) is above OBV-EMA(110)
Linear regression is strong
ADX is strong >50
DXY is trending down
SHORT
When Price is below EMA and ema-price difference is smaller than "Long delta Price/MA"
OBV(4hrs) is below OBV-EMA(110)
Linear regression is weak
ADX is weak <50
DXY is trending up
BINANCE:ETHUSDT 30 minutes Timeframe
Cyatophilum Universal Oscillator TraderAn indicator to backtest and create an infinite number of strategies using any external indicator.
═════════════════════════════════════════════════════════════════════════
█ HOW IT WORKS
The indicator allows you to create your oscillator strategy and get backtest results from the Strategy Tester.
You can also create alerts for each of the strategy events.
█ HOW TO USE
Choose a strategy direction long or short that you want to create.
Always use regular candle type.
Configure your entry condition . To use any other indicator as source, it needs to be added to the chart first.
If you have the basic (free) TradingView plan, you can only have 1 indicator on your chart, and cannot use this external source feature. For this case, the indicator has a list of built-in oscillator (that can be increased upon request).
Then choose your condition: Cross over, Greater than, Pullback, Turning up, etc.
You now have your entry and should already see trades on the chart!
Next you can fine tune your entry condition or move to the risk management and filters.
Configure your stop loss
Use the stop loss feature to exit a trade at a certain loss.
You can also create a trailing stop using price % movement or ATR.
Configure your profit target
Use the Take Profit feature to set a target in percentage of price. You can also make it trail.
Configure your safety orders
This indicator has a safety orders feature to reduce the risk of your trade. See more below.
Check your backtest parameters
Make sure that the initial capital and order size make sense. Since it is a pyramiding strategy with safety orders, the sum of all deals should not be bigger than the initial capital.
If you use % equity as order size, please note that it will create compounding.
Check the fees, by default they are set to 0.1%.
I also recommend to set a slippage that corresponds to your exchange's spread.
█ FEATURES
• Strategy direction
Configure to go long or short.
• Entry Conditions
- External Oscillator source
- Built-in Oscillator (for basic plans)
- Base Condition for entry (Less/Greater than, Crossing Up/Down, Pullback Bull/Bear, Turning Up/Down, etc. More can be added later on)
- Additional Momentum Condition: Oscillator should be rising/falling for x number of bars
- Addition Threshold Condition: Oscillator should be Greater/Lowser than x
• Trend Filter
Filter Trades using 1 or 2 moving averages (MTF), based on Slop Change or Price Cross. Trend line is green = only longs, red = only shorts.
• Entry Filters
- Volume filter to remove low volume entries
- Overbought/Oversold filters
- Flat market Filter
• Stop Loss and Take Profit
Configure your stop loss and take profit for long and short trades.
You can also make a trailing take profit and trailing stop.
• DCA (Safety orders)
Create up to 100 safety orders with configurable options for step and volume scaling, take profit from total volume, base and safety order size.
• Backtest Settings
Choose a backtest period, longs or shorts, wether to use limit orders or not.
Graphics
A Backtest Results panel with additional information from the strategy tester.
A lightweight mode to remove background plots and make the indicator load faster.
█ ALERTS
The indicator is using the alert() calls: it only uses 1 alert slot to send order messages for each event (Long/Short entry, stop loss, take profit, safety order, exit timer). This means basic-free TV plans can create 1 complete strategy.
To set your alert messages, open the indicator settings and scroll to the bottom of the "inputs" tab.
Create your alert after you set the messages in the indicator settings, and make sure "Any alert() function call" is set in the alert option.
Use placeholders to automatically replace values in your alert messages like price, target profit, order size etc. (see the indicator inputs).
█ BACKTEST RESULTS
The backtest settings can be seen in the 'Properties' tab of the backtest report below.
Please read the author instructions below for access.

Chandelier Exit ZLSMA StrategyIntroduction
Heyo guys, I recently checked out some eye-catching trading strategy videos on YT and found one to test.
This indicator is based on the video.
Usage
The recommended timeframe is 5 min.
Signals
Long Entry => L Label
Price crosses above ZLSMA and Chandelier Exit shows Buy
Long Exit => green circle
Price crosses below ZLSMA
Short Entry => S Label
Price crosses below ZLSMA and Chandelier Exit shows Sell
Short Exit => orange circle
Prices crosses above ZLSMA
Ty for checking this out. Enjoy!
--
Credits to
@netweaver2011 - ZLSMA
@everget – Chandelier Exit
