Stochastic ChannelsDonchain trend following system with overbought/ oversold areas inspired by stochastic. Multiplier to get non repainting HTF capability. features a smoothed price as well as moving average of the smoothed price, also inspired by the stochastic indicators %K and %D. This and slow stochastics compliment each other nicely.
%D line colored by direction.
Filled color areas represent overbought/oversold.
Shows breakouts as well as giving targets and entries in rangebound markets.
Stochastic-Oscillator

4x Stochastic Dingue4 Stochastic indicator into 1.
Different lengths produce short-term and long-term indicators that can help with finding the trend and impulses within the trend.
It can also find reversal points when all 4 are at the extreme at the same time. Ex. All 4 Stoch are above 90 or under 10 !! This could signal a bottom or top is soon to happen. (This is not always true as it depends on many factors.)
Many visual options make it even more customizable. Fill between Stoch, background colors, Crosses.
Divergences are not always accurate, depending on settings and timeframe, but they can be useful in certain situations.
---------------------
In closing, no indicator can give perfect signals, you need to use them in conjunction with other information to make better decisions.
I hope you like my indicators and that they help your trading.
If you have any questions please ask.
Thank you.

Stochastic + Keltner Channels for ScalpingSimple arrow indicator, indicating the direction go the next slight movement. This indicator will work on any time frame or market.
How does this indicator work?
It will use Stochastic and Keltner Channels to detect potential reversals depending on the frequency you choose in the indicator's settings. The higher the frequency, the fewer candles will be used in the calculation.
When to use this indicator?
It will work better in higher time frames for low volatility indicators. You can mix with other indicators like RSI or ADX. This way, you will be able to check if the time selected frame has enough volatility to move the price enough to cover the spreads and fees of your broker.
When to exit the trade after the signal from this indicator?
A good target would be for 1x ATR value and stop-loss 2x the ATR value. Doing trailing stop will reduce your risk and secure some profits, but make sure to use values for possible fakeouts
Can this indicator be used alone as the main source of entry signal for the trades?
You can use it alone, but I recommend mixing with other trend-based indicators, like Moving Averages, so you get the best results. Since it's for scalping purposes, small moments, and reversals, it doesn't have the trend filter, but it can work trading in favor of a significant trend as well
this is a better version of my other script Scalping Arrows


Contrarian Scalping Counter Trend Bb Envelope Adx and StochasticContrarian Scalping is an trading strategy designed to take advanted of a counter-trend.
The advantage of these strrategies types is that they have a good profitability but with do not great gain (in relation at the time frame).
Indicators used:
Bollinger
Envelope
ADX
Stochastic
Rules for entry
For short: close of the price is above upper band from bb and envelope, adx is below 30 and stochastic is above 50
For long: close of the price is below lower band from bb and envelope, adx is below 30 and stochastic is below 50
Rules for exit
For short: either close of the candle is below lower band of bb or enveloper or stochastic is below 50
For long: either close o the candle is above upper band of bb or envelope or stochastic is above 50
If there are any questions let me know !

Indicador OMEP S============
ENGLISH
============
- Description:
This is an upgraded version of my previous indicator "OMEP" (feel free to check my profile to try it).
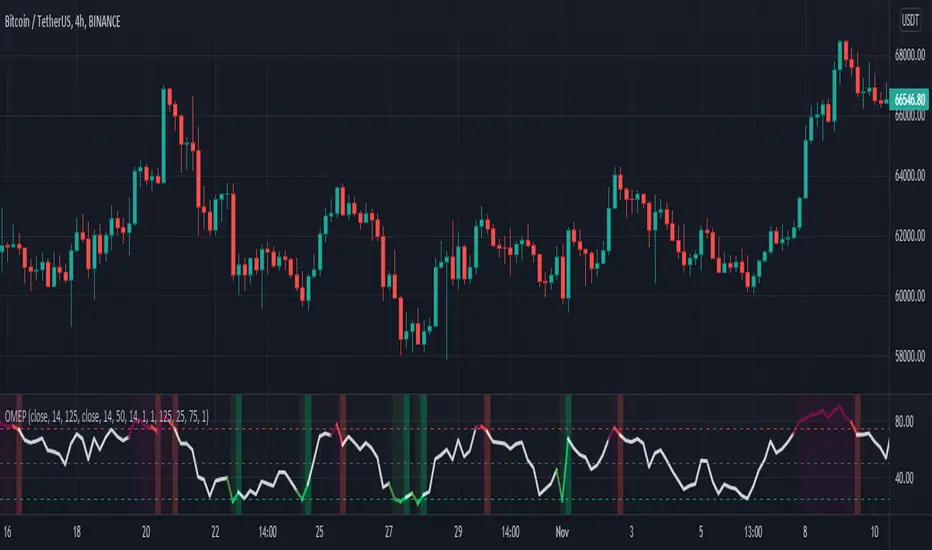
The OMEP is a momentum oscillator calculated by the combination (average) of RSI , MFI and STOCHASTIC to detect overbought and oversold levels.
The idea that the combination eliminates weaknesses and enhances strengths.
In this upgraded version (OMEP S) a signal line has been added to generate more accurate entry/exit signals, also 2 kind of triggers can be configured for futher customization, default settings have been updated for this version.
Consider the OMEP S as an advanced Stochastic.
- Usage:
You can use it as an RSI / MFI , when the OMEP is in the bottom area is considered OVERSOLD, when is in the upper area is considered OVERBOUGHT.
Thanks to the signal line added to this version you can use any Stochastic strategy aswell, in fact, you can customize visual alerts (background color changes) on crossovers (inside overbought and oversold areas) for faster signals and a more conservative option which shows the alers when both lines have left the area.
- Visual:
For ease of use i've added 3 horizontal lines, which are fully customizable:
Upper line: overbought level.
Mid line: just a reference line but can be used to enter/exit aswell like with some RSI strategies.
Bottom line: oversold level.
The color of the background changes depending on the location of the lines AND the chosen trigger (crossover or zone):
On crossover there're 2 colors for oversold and 2 colors for overbought: green when oversold and lime on crossover inside oversold area, maroon when overbought and red on crossover inside overbought area.
For the area trigger there're 3 colors: first color works the same, but a second light green/light marron shows when the OMEP line has already left the area and then the lime/red when both are out.
Therefore, in this second mode you can think about taking a position when the color starts to become lighter before both lines leave the area.
- Customization:
By default RSI , MFI and STOCHASTIC are hidden, only OMEP and SIGNAL lines are visible, but you can turn on/off and customize colors for any of them too.
Settings for all indicators and their relevance in the average calculation are configurable aswell, default values have been proved to work better on daily with a strategy tester., BUT also on lower timeframes if you take higher ones in mind (e.g. do not buy in 1H if it is overbought in 4H).
- Recommendations:
Higher timeframes are better, 1D is recommended to detect peaks and bottoms, 4H can be used for faster trades.
It was tested on various cryptocurrencies, if you have patience you can just buy the dips (5-10% each position) on daily.
Suggestions are welcome!
============
ESPAÑOL
============
- Descripción:
Ésta es una versión mejorada de mi anterior indicador "OMEP" (no dudes en echar un ojo a mi perfil para probarlo).
El OMEP es un oscilador de momento calculado por la combinación (media) de RSI , MFI y ESTOCÁSTICO para detectar niveles de sobrecompra y sobreventa.
La idea es que su combinación elimine debilidades y mejore sus fortalezas.
En ésta versión actualizada (OMEP S) se ha añadido una línea de señal para generar puntos de entrada/salida más precisas, también se pueden configurar 2 tipos de señales para una mayor personalización, los ajustes por defecto han sido actualizados para esta versión.
Considera el OMEP S como un Estocástico avanzado.
- Uso:
Se puede utilizar como un RSI / MFI , cuando el OMEP está en la zona inferior se considera SOBREVENDIDO, cuando está en la zona superior se considera SOBRECOMPRADO.
Gracias a la línea de señal añadida a esta versión puedes utilizar cualquier estrategia que aplicarías a un Estocástico, de hecho, puedes personalizar las alertas visuales (cambios de color en el fondo del indicador) en los cruces (dentro de las áreas de sobrecompra y sobreventa) para obtener señales más rápidas y una opción más conservadora que muestra las alertas cuando ambas líneas han abandonado la zona.
- Visual:
Para facilitar el uso he añadido 3 líneas horizontales, que son totalmente personalizables:
Línea superior: nivel de sobrecompra.
Línea media: sólo una línea de referencia, pero se puede utilizar para entrar/salir como como con algunas estrategias RSI .
Línea inferior: nivel de sobreventa.
El color del fondo cambia en función de la ubicación de las líneas Y de la señal elegida (cruce o zona):
En el cruce hay 2 colores para la sobreventa y 2 colores para la sobrecompra: verde cuando hay sobreventa y lima en el cruce dentro de la zona de sobreventa, granate cuando hay sobrecompra y rojo en el cruce dentro de la zona de sobrecompra.
Para la señal área hay 3 colores: el primer color funciona igual, pero un segundo verde claro/granate claro muestra cuando la línea OMEP ya ha salido del área y luego el lima/rojo cuando ambos están fuera.
Por lo tanto, en éste segundo modo puedes ir pensando en tomar una posición cuando el color empieza a tornarse claro antes incluso de que ambas líneas salgan del área.
- Personalización:
Por defecto RSI , MFI y ESTOCÁSTICO están ocultos, sólo la línea OMEP es visible, pero puedes activar/desactivar y personalizar los colores para cualquiera de ellos.
Los ajustes para todos los indicadores y su relevancia en el cálculo de la media son configurables también, los valores por defecto se han demostrado que funcionan mejor en diario con un tester de estrategias, PERO también en los marcos de tiempo más bajos si se tiene en cuenta los superiores (ej: no entres en compra en 1H si en 4H está sobrecomprado).
- Recomendaciones:
Los marcos de tiempo más altos son mejores, 1D se recomienda para detectar suelos y techos, 4H se puede utilizar para operaciones más rápidas.
Fue probado en varias criptomonedas, si tienes paciencia puedes comprar las caídas (5-10% cada posición) en el diario.
¡las sugerencias son bienvenidas!

Indicador OMEP============
ENGLISH
============
- Description:
The OMEP is a momentum oscillator calculated by the combination (average) of RSI , MFI and STOCHASTIC to detect overbought and oversold levels.
The idea that the combination eliminates weaknesses and enhances strengths.
- Usage:
You can use it as an RSI / MFI , when the OMEP is in the bottom area is considered OVERSOLD, when is in the upper area is considered OVERBOUGHT.
- Visual:
For ease of use i've added 3 horizontal lines, which are fully customizable:
Upper line: overbought level.
Mid line: just a reference line but can be used to enter/exit aswell like with some RSI strategies.
Bottom line: oversold level.
The color of the line and background changes:
Green: oversold.
Lime: OMEP just left oversold area and triggers an entry/long.
Maroon: overbought.
Red: OMEP just left overboughtarea and triggers an exit/short.
- Customization:
By default RSI , MFI and STOCHASTIC are hidden, only OMEP line is visible, but you can turn on/off and customize colors for any of them too.
Settings for all indicators and their relevance in the average calculation are configurable aswell, but default values have been proved to work better on daily with a strategy tester.
- Recommendations:
Higher timeframes are better 1D is recommended to detect peaks and bottoms, 4H can be used for faster trades.
It was tested on various cryptocurrencies, if you have patience you can just buy the dips (5-10% each position) on daily.
Suggestions are welcome!
============
ESPAÑOL
============
Descripción:
El OMEP es un oscilador de momento calculado por la combinación (media) de RSI , MFI y ESTOCÁSTICO para detectar niveles de sobrecompra y sobreventa.
La idea es que su combinación elimine debilidades y mejore sus fortalezas.
Uso:
Se puede utilizar como un RSI / MFI , cuando el OMEP está en la zona inferior se considera SOBREVENDIDO, cuando está en la zona superior se considera SOBRECOMPRADO.
- Visual:
Para facilitar el uso he añadido 3 líneas horizontales, que son totalmente personalizables:
Línea superior: nivel de sobrecompra.
Línea media: sólo una línea de referencia, pero se puede utilizar para entrar/salir como como con algunas estrategias RSI .
Línea inferior: nivel de sobreventa.
El color de la línea y del fondo cambia:
Verde: sobreventa.
Lima: OMEP acaba de salir de la zona de sobreventa y activa una entrada/long.
Granate: sobrecompra.
Rojo: El OMEP acaba de salir de la zona de sobrecompra y provoca una salida/short.
- Personalización:
Por defecto RSI , MFI y ESTOCÁSTICO están ocultos, sólo la línea OMEP es visible, pero puedes activar/desactivar y personalizar los colores para cualquiera de ellos.
Los ajustes para todos los indicadores y su relevancia en el cálculo de la media son configurables también, pero los valores por defecto han demostrado la mejor efectividad en temporalidad de 1D.
- Recomendaciones:
Las temporalidades mayores son mejores, se recomienda 1D para detectar suelos y techos, en 4H se puede usar para operaciones más rápidas.
Se ha probado en varias criptomonedas, si tienes paciencia puedes comprar los dips (5-10% cada posición) en diario.
¡Las sugerencias son bienvenidas!
[JL] Stochastic Divergence AlertCompare two cross area:
k is increasing, low is lower and previous k is less than bottom level then it is bottom divergence
k is decrease, high is higher and previous k is more than top level then it is top divergence
With long term moving average(400), seems that Stochastic Divergence is more accurate than RSI Divergence on 1m chart.

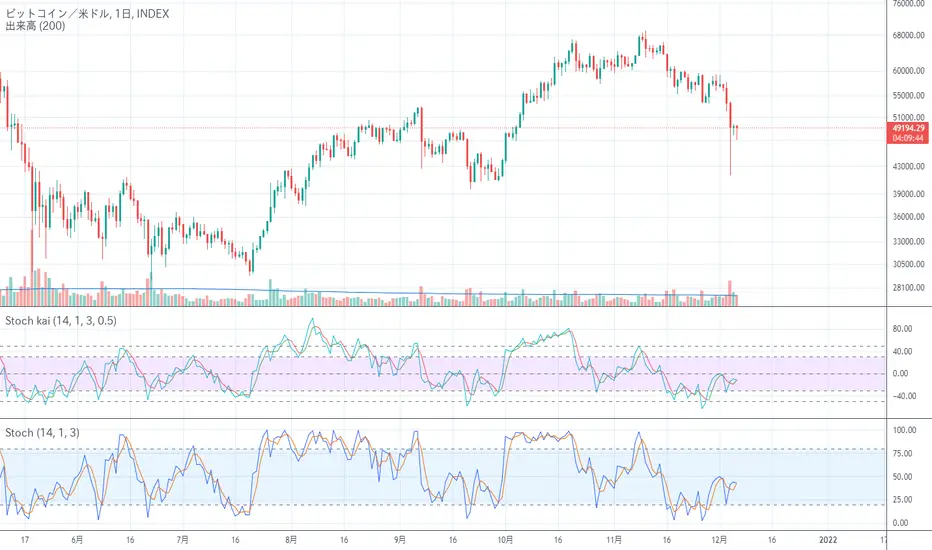
Stochastic kai ストキャス改Stochastic oscillator is a good indicator in the range market, but in the trend market, the value is saturated and sticks to the upper or lower side, so it is difficult to handle, so I tried to improve it.
I tried to make it difficult to saturate by adding trends. (Although there are limits ...)
I think the usage is the same as Stochastic Oscillator
レンジ相場ではストキャスティクスは良いインジケーターなのですが、トレンド相場では値が飽和して上の方か下の方に貼りついて扱いにくいので改良してみました。
トレンドを加味し飽和しにくくしてみました。(限界はありますが・・・)
使い方はストキャスティクスと同じで良いと思います
Stochastic Spread AnalyzerA comparative version of the previously published Stochastic Structure Analyzer. It incorporates the 3-TF stochastics against both price and OBV values of the spread.

Simple EMA20 Strategy + StochasticThis is a Trend Following Strategy.
The intent of this strategy is to catchthe price as it trends higher than the 20-period EMA and sell immediately after the price closes below it.
I have implemented calculations from Stochastic to make sure the price is coming from an oversold area.
There is also a check to see if the 20-period EMA is trending higher than before.

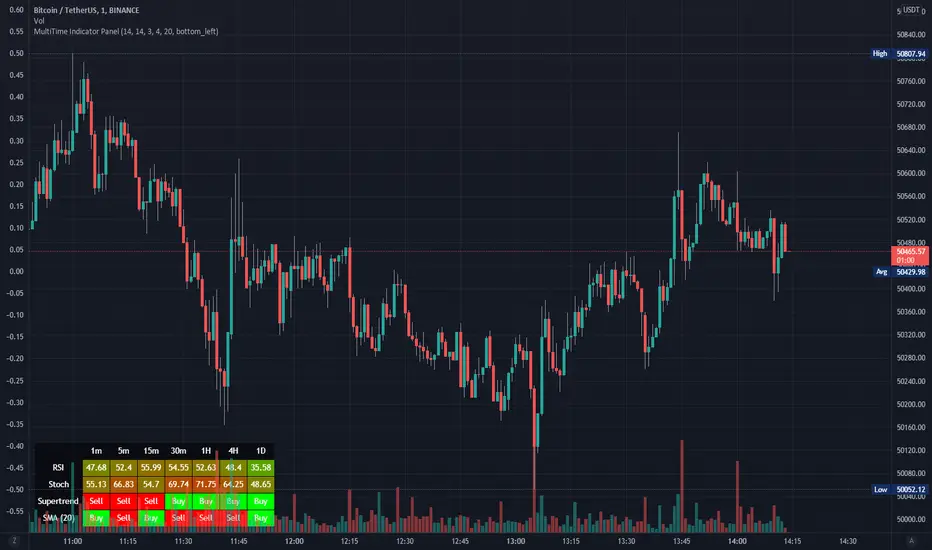
RSI & Stoch MultiTimeThis indicator renders a table with 2 rows and 7 columns displaying the values of RSI and Stoch over different time periods. This works best on 1m charts due to a bug with the time periods I haven't yet solved.
Stochastic Colored Zones - [hessen.trading]NASDAQ:TSLA
Dieses Script zeigt den Stochastic-Oszillator an.
Der Unterschied zum Standard Indikator ist, die farbliche Kennzeichnung der Bereiche über und unter 50

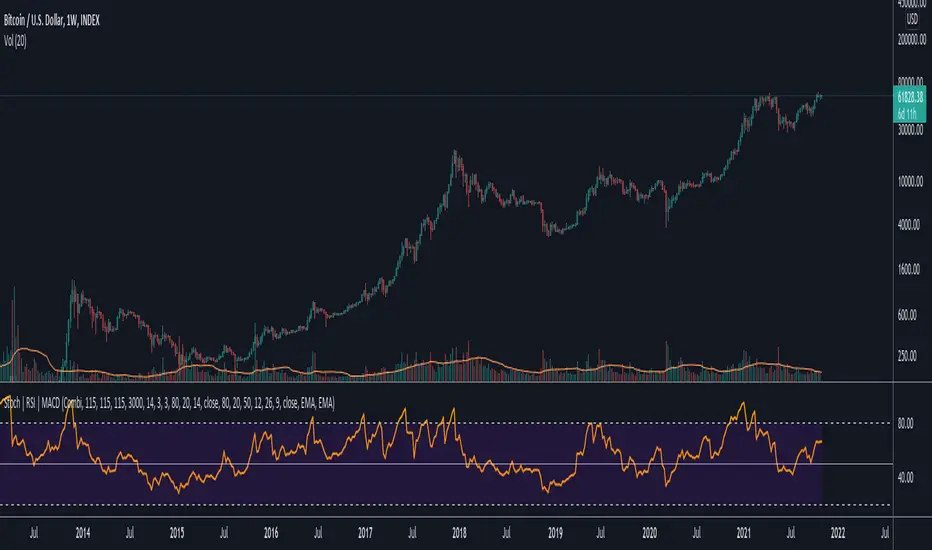
Data Trader Stoch | RSI | MACD Strategy IndicatorImplementation of Data Trader's strategy, described in the youtube video, "Highly Profitable Stochastic + RSI + MACD Trading Strategy (Proven 100x)"
Also see Algovibes' video, "Highly Profitable Stochastic + RSI + MACD Trading Strategy? Testing Data Traders strategy in Python"
Note: Despite the claims, it generates barely, if any, signals, certainly in the crypto markets
If there are any mistakes, give feedback in the comments, and I'll fix
### Strategy Summary ###
# Long Signals #
Stoch K and D are oversold
RSI above midline
MACD above signal line
# Short Signals #
Stoch K and D are overbought
RSI below midline
MACD below signal line
# Stop loss and Take Profit #
Stop loss
Longs: below last swing low
Shorts: above last swing high
Take profit at 1.5x stop loss
NEXT Stochastic 3xVW (Triple Volume Weighted)Overview:
This responsive version of the Stochastic oscillator modifies and extends the original to incorporate volume. It does so on 2 levels: by using Volume-Weighted Moving Average (VWMA) as input and applying a triple volume weighting filter within the internal algorithm, intelligently blending volume with what is otherwise pure momentum/distribution analysis. The result is more binary-like curve behavior (%K and %D oscillator lines), whose polarizing movement acts as both a signal and filter.
Below is a screenshot comparing NEXT Stochastic 3xVW with default settings to the original Stochastic oscillator on NQ M1 chart.
Application and Strategy Ideas:
NEXT Stochastic 3xVW is intended to be used like the original Stochastic oscillator within the context of technical analysis: identifying overvalued (above upper limit) and undervalued (below lower limit) price action, as well as establishing a bias baseline (bullish if over 50; bearish if under 50). Higher NEXT Stochastic 3xVW bottoms compared to lower price bottoms signify bullish divergence; lower NEXT Stochastic 3xVW tops compared to higher price tops signify bearish divergence. Trading %K/%D line crossing is also a popular strategy, with %K crossing over %D indicating bullish sentiment and %K crossing under %D indicating bearish sentiment.
Below is a screenshot showing NEXT Stochastic 3xVW overbought/oversold intraday strategy on SPY M1 chart. NEXT Stochastic 3xVW is set to 5,10,1,3 with long signal issued at lower limit of 30 and short at upper limit of 70.
Input Parameters:
VWMA Length - controls the averaging length of the volume-weighted moving average (based on close price and volume); used as Stochastic input
%K Length - volume-driven averaging length of the %K oscillator line - this is the faster of the two Stochastic lines
%K Smoothing - volume-driven smoothing factor of the %K line
%D Smoothing - volume-driven averaging length of the %D oscillator line (a %K derivative, post smoothing) - this is the slower of the two Stochastic lines
Upper Limit - the NEXT Stochastic 3xVW level above which market is considered overbought, default is 80
Base Bias - the NEXT Stochastic 3xVW level above which market bias is considered bullish, and below bearish
Lower Limit - the NEXT Stochastic 3xVW level below which market is considered oversold, default is 20
Signals and Alerts:
Discover and visualize NEXT Stochastic 3xVW strategies using the companion NEXT Strategy Visualizer indicator. While the %K/%D cross alerts can be set via NEXT Stochastic 3xVW indicator, the Strategy Visualizer will only plot long/short signals when %K or %D cross over or under overbought/oversold levels (as hown in the above SPY M1 screenshot). That being said, the next version of the Strategy Visualizer will also support %K/%D crosses.
Here is how to set NEXT Stochastic 3xVW %K/%D crossing alerts: open a chart, attach NEXT Stochastic 3xVW, and right-click on chart -> Add Alert. Condition: Next Stochastic >> %K >> Crossing >> Next Stochastic >> %D

Combo 4+ KDJ STO RSI EMA3 Visual Trend Pine V5@RL! English !
Combo 4+ KDJ STO RSI EMA3 Visual Trend Pine V5 @ RL
Combo 4+ KDJ STO RSI EMA3 Visual Trend Pine V5 @ RL is a visual trend following indicator that groups and combines four trend following indicators. It is compiled in PINE Script Version V5 language.
• STOCH: Stochastic oscillator.
• RSI Divergence: Relative Strength Index Divergence. RSI Divergence is a difference between a fast and a slow RSI.
• KDJ: KDJ Indicator. (trend following indicator).
• EMA Triple: 3 exponential moving averages (Default display).
This indicator is intended to help beginners (and also the more experienced ones) to trade in the right direction of the market trend. It allows you to avoid the mistakes of always trading against the trend.
The calculation codes of the different indicators used are standard public codes used in the usual TradingView coding for these indicators.
The STO indicator calculation script is taken from TradingView's standard STOCH calculation.
The RSI indicator calculation script is a replica of the one created by @Shizaru.
The KDJ indicator calculation script is a replica of the one created by @iamaltcoin.
The Triple EMA indicator calculation script is a replica of the one created by @jwilcharts.
This indicator can be configured to your liking. It can even be used several times on the same graph (multi-instance), with different configurations or display of another indicator among the four that compose it, according to your needs or your tastes.
A single plot, among the 4 indicators that make it up, can be displayed at a time, but either with its own trend or with the trend of the 4 (3 by default) combined indicators (sell=green or buy=red, background color).
Trend indications (potential sell or buy areas) are displayed as a background color (bullish: green or bearish: red) when at least three of the four indicators (3 by default and configurable from 1 to 4) assume that the market is moving in the same direction. These trend indications can be configured and displayed, either only for the signal of the selected indicator and displayed, or for the signals of the four indicators together and combined (logical AND).
You can tune the input, style and visibility settings of each indicator to match your own preferences or habits.
A 'buy stop' or 'sell stop' signal is displayed (layouts) in the form of a colored square (green for 'stop buy' and red for 'stop sell'. These 'stop' signals can be configured and displayed, either only for the indicator chosen, or for the four indicators together and combined (logical OR).
Note that the presence of a Stop Long signal cancels the background color of the Long trend (green).
Likewise, the presence of a Stop Short signal cancels out the background color of the Short trend (red).
It is also made up of 3 labels:
• Trend Label
• signal Stop Label (signals Stop buy or sell )
• Info Label (Names of Long / Short / Stop Long / Stop Short indicators, and / Open / Close / High / Low ).
Each label is configurable (visibility and position on the graph).
• Trend label: indicates the number of indicators suggesting the same trend (Long or Short) as well as a strength index (PWR) of this trend: For example: 3 indicators in Short trend, 1 indicator in Long trend and 1 indicator in neutral trend will give: PWR SHORT = 2/4. (3 Short indicators - 1 Long indicator = 2 Pwr Short). And if PWR = 0 then the display is "Wait and See". It also indicates which current indicator is displayed and the display mode used (combined 1 to 4 indicators or not combined ).
• Signal Stop Label: Indicates a possible stop of the current trend.
• Label Info (Simple or Full) gives trend info for each of the 4 indicators and OHLC info for the chart (in “Full” mode).
It is possible to display this indicator several times on a chart (up to 3 indicators max with the Basic TradingView Plan and more with the paid plans), with different configurations: For example:
• 1-Stochastic - 2/4 Combined Signals - no Label displayed
• 1-RSI - Combined Signals 3/4 - Stop Label only displayed
• 1-KDJ - Combined Signals 4/4 - the 3 Labels displayed
• 1-EMA'3 - Non-combined signals (EMA only) - Trend Label displayed
Some indicators have filters / thresholds that can be configured according to your convenience and experience!
The choice of indicator colors is suitable for a graph with a "dark" theme, which you will probably need to modify for visual comfort, if you are using a "Light" mode or a custom mode.
This script is an indicator that you can run on standard chart types. It also works on non-standard chart types but the results will be skewed and different.
Non-standard charts are:
• Heikin Ashi (HA)
• Renko
• Kagi
• Point & Figure
• Range
As a reminder: No indicator is capable of providing accurate signals 100% of the time. Every now and then, even the best will fail, leaving you with a losing deal. Whichever indicator you base yourself on, remember to follow the basic rules of risk management and capital allocation.
BINANCE:BTCUSDT
**********************************************************************************************************************************************************************************************************************************************************************************
! Français !
Combo 4+ KDJ STO RSI EMA3 Visual Trend Pine V5@RL
Combo 4+ KDJ STO RSI EMA3 Visual Trend Pine V5@RL est un indicateur visuel de suivi de tendance qui regroupe et combine quatre indicateurs de suivi de tendance. Il est compilé en langage PINE Script Version V5.
• STOCH : Stochastique.
• RSI Divergence : Relative Strength Index Divergence. La Divergence RSI est une différence entre un RSI rapide et un RSI lent.
• KDJ : KDJ Indicateur. (indicateur de suivi de tendance).
• EMA Triple : 3 moyennes mobiles exponentielles (Affichage par défaut).
Cet indicateur est destiné à aider les débutants (et aussi les plus confirmé) à trader à dans le bon sens de la tendance du marché. Il permet d'éviter les erreurs qui consistent à toujours trader à contre tendance.
Les codes de calcul des différents indicateurs utilisés sont des codes publics standards utilisés dans le codage habituel de TradingView pour ces indicateurs !
Le script de calcul de l’indicateur STO est issu du calcul standard du STOCH de TradingView.
Le script de calcul de l’indicateur RSI Div est une réplique de celui créé par @Shizaru.
Le script de calcul de l’indicateur KDJ est une réplique de celui créé par @iamaltcoin.
Le script de calcul de l’indicateur Triple EMA est une réplique de celui créé par @jwilcharts
Cet indicateur peut être configuré à votre convenance. Il peut même être utilisé plusieurs fois sur le même graphique (multi-instance), avec des configurations différentes ou affichage d’un autre indicateur parmi les quatre qui le composent, selon vos besoins ou vos goûts.
Un seul tracé, parmi les 4 indicateurs qui le composent, peut être affiché à la fois mais, soit avec sa propre tendance soit avec la tendance des 4 (3 par défaut) indicateurs combinés (couleur de fond vente=vert ou achat=rouge).
Les indications de tendance (zones de vente ou d’achat potentielles) sont affichés sous la forme de couleur de fond (Haussier : vert ou baissier : rouge) lorsque au moins trois des quatre indicateurs (3 par défaut et configurable de 1 à 4) supposent que le marché évolue dans la même direction. Ces indications de tendance peuvent être configuré et affichés, soit uniquement pour le signal de l’indicateur choisi et affiché, soit pour les signaux des quatre indicateurs ensemble et combinés (ET logique).
Vous pouvez accorder les paramètres d’entrée, de style et de visibilité de chacun des indicateurs pour correspondre à vos propres préférences ou habitudes.
Un signal ‘stop achat’ ou ‘stop vente’ est affiché (layouts) sous la forme d’un carré de couleur (vert pour ‘stop achat’ et rouge pour ‘stop vente’. Ces signaux ‘stop’ peuvent être configuré et affichés, soit uniquement pour l’indicateur choisi, soit pour les quatre indicateurs ensemble et combinés (OU logique).
A noter que la présence d’un signal Stop Long annule la couleur de fond de la tendance Long (vert).
De même, la présence d’un signal Stop Short annule la couleur de fond de la tendance Short (rouge).
Il est aussi composé de 3 étiquettes (Labels) :
• Trend Label (infos de tendance)
• Signal Stop Label (signaux « Stop » achat ou vente)
• Infos Label (Noms des indicateurs Long/Short/Stop Long/Stop Short,
et /Open/Close/High/Low )
Chaque label est configurable (visibilité et position sur le graphique).
• Label Trend : indique le nombre d’indicateurs suggérant une même tendance (Long ou Short) ainsi qu’un indice de force (PWR) de cette tendance :
Par exemple : 3 indicateurs en tendance Short, 1 indicateur en tendance Long et 1 indicateur en tendance neutre donnera :
PWR SHORT = 2/4. (3 indicateurs Short – 1 indicateur Long=2 Pwr Short).
Et si PWR=0 alors l’affichage est « Wait and See » (Attendre et Observer).
Il indique aussi quel indicateur actuel est affiché et le mode d’affichage utilisé (combiné 1 à 4 indicateurs ou non combiné ).
• Signal Stop Label : Indique un possible arrêt de la tendance en cours.
• Infos Label (Simple ou complet) donne les infos de tendance de chacun des 4 indicateurs et les infos OHLC du graphique (en mode « Complet »).
Il est possible d’afficher ce même indicateur plusieurs fois sur un graphique (jusqu’à 3 indicateurs max avec le Plan Basic TradingView et plus avec les plans payants), avec des configurations différentes :
Par exemple :
• 1-Stochastique – Signaux Combinés 2/4 – aucun Label affiché
• 1-RSI – Signaux Combinés 3/4 – Label Stop uniquement affiché
• 1-KDJ – Signaux Combinés 4/4 – les 3 Labels affichés
• 1-EMA’3 - Signaux Non combinés (EMA seuls) – Trend Label affiché
Certains indicateurs ont des filtres/seuils (Thresholds) configurables selon votre convenance et votre expérience !
Le choix des couleurs de l’indicateur est adapté pour un graphique avec thème « sombre », qu’il vous faudra probablement modifier pour le confort visuel, si vous utilisez un mode « Clair » ou un mode personnalisé.
Ce script est un indicateur que vous pouvez exécuter sur des types de graphiques standard. Il fonctionne aussi sur des types de graphiques non-standard mais les résultats seront faussés et différents.
Les graphiques Non-standard sont :
• Heikin Ashi (HA)
• Renko
• Kagi
• Point & Figure
• Range
Pour rappel : Aucun indicateur n’est capable de fournir des signaux précis 100% du temps. De temps en temps, même les meilleurs échoueront, vous laissant avec une affaire perdante. Quel que soit l’indicateur sur lequel vous vous basez, n’oubliez pas de suivre les règles de base de gestion des risques et de répartition du capital.
BINANCE:BTCUSDT

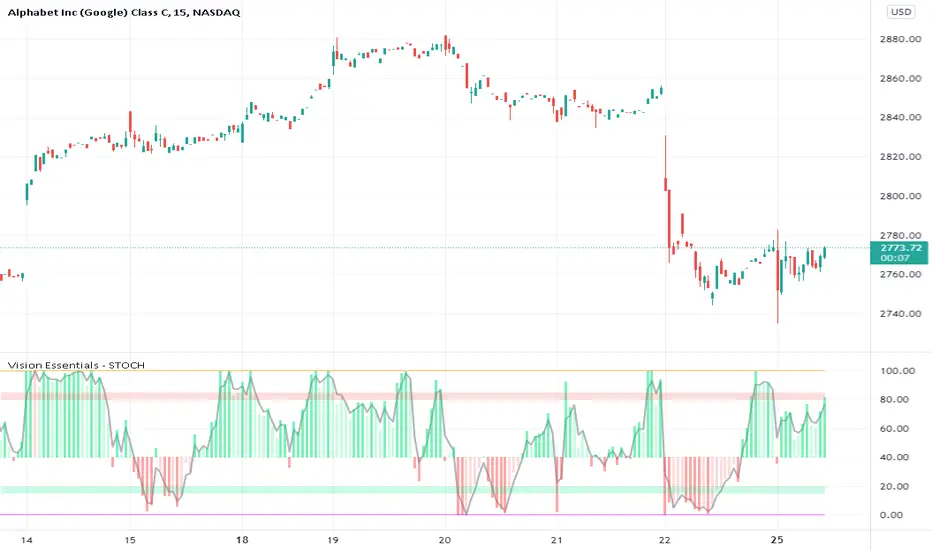
Vision Essentials - STOCHVision Essentials - STOCH is the third indicator in our Essentials Pack. It's a fully customizable STOCHASTIC based indicator with various tweaks & perks the Vision team feels provides helpful visual feedback to the trader.
What makes this indicator different?
The most obvious is the visual lack of a %K and %D line. We provide a single line that is the average of those 2 calculations at the given time. We feel this helps traders from hyper focusing on crossovers, and gives attention to the historical metrics of highs/lows, and the key levels of the stochastic.
We provide a histogram style output at the stoch base of 40 for capturing the various swings occurring while above or below the base line.
We output the key levels via the user defined values to draw horizontal boxes automatically for users. This prevents you from having to steadily update your manual chart drawing if you're tracking key levels.
We output recent highs & lows of the averaged stochastic values. These values are length controlled via the indicator settings.
How do I use this indicator?
To best use this indicator it's highly recommended that you have an understanding of the stochastic oscillator. There are lots of great educational ideas here on TradingView which we recommend absorbing. We highly recommend you start with this article directly from the TradingView Help Center
Settings
Stoch Source - The source series the stoch is based on
Stoch Peak - Define the upper key level of the stoch
Stoch Bottom - Define the lower key level of the stoch
Stoch Line Width - Control the thickness of the Stoch Avg Line
High/Low Distance - Define the distance for the indicator to identify recent highs and lows
Stoch K Length - The length used for %K
Stoch K Smoothing - The length used for %K smoothing
Stoch D Smoothing - The length of %D which is an average of %K
Stoch Avg Color - The color & opacity of the Stoch Avg Line
Recent Low Color & Recent High Color - The colors of the recent highs and lows
Stoch Bottom & Stock Peak Colors - The colors of the horizontal boxes drawn at key levels
Visual Settings+ - The histogram colors of above 40.0 bullish/bearish movement
Visual Settings- - The histogram colors of below 4.0. bullish/bearish movement
GEMA-Indicador por Neil-------------------
DESCRIPTION
GEMA-INDICATOR is a indicator based on SMA, EMA, WMA, RMA that considers elements such as ADX, DMI, RSI, stochastic, Stoploss, Takeprofit, angles and values at present point.
HOW DOES IT WORK
The component works as an assistant to which you configure the previous elements and you see the performance that it offers you, in such a way that you pass that configuration to GEMA-INDICATOR so that you can receive alerts and do visual trading with notifications or automated trading by sending messages to platforms like 3Commas.
WHY USE IT
The resource operates with one of the most important strategies in the market, which is the price tracking line, which means that if prices go up, we follow it, if prices go down, we follow it; in this way you do not need to make large investments as is often the case with pure BOTs, which require large reserves for security orders.
HOW TO USE IT
Press the "Indicators" option, go to the "Public Library" segment, write the name "GEMA-Indicador por Neil", double click on the record in question and you will have it added in your work panel, now, it only remains to use it and configure its parameters.
-------------------
DESCRIPCIÓN
GEMA-INDICADOR en un indicador basado en SMA, EMA, WMA, RMA que considera elementos como ADX, DMI, RSI, Estocastico, Stoploss, Takeprofit, ángulos y valores a punto presente.
COMO FUNCIONA
El componente funciona como un asistente al que vas configurando lo elementos anteriores y vas viendo el rendimiento que te ofrece, de manera tal, que pases esa configuración a GEMA-INDICADOR para que puedas recibir alertas y hagas trading visual con notificaciones o trading automatizado enviando mensajes a plataformas como 3Commas.
POR QUÉ USARLO
El recurso opera con una de las estrategias mas importantes del mercado, que es la linea de seguimiento de precio, lo que significa que si los precios suben, lo seguimos, si los precios bajan, lo seguimos; de esta manera no necesita realizar grandes inversiones como suele ocurrir con los BOT puros, que exigen grandes reservas para las ordenes de seguridad.
COMO USARLO
Presione la opción "Indicadores", ubíquese en el segmento "Libreria Publica", escriba el nombre "GEMA-Indicador por Neil", haga doble clic sobre el registro en cuestión y lo tendrá agregado en su panel de trabajo, ahora, solo resta usarlo y configurar sus paramertos.

Dagger V1 indicator & alerterThe "Dagger V1 strategy" strategy is used for the backtest of the "Dagger V1 indicator & alerter" indicator. Their algorithm is identical. Further, all descriptions of the settings are the same for the strategy and the indicator.
Dagger is used for trading on the cryptocurrency spot market, but it can also be used for any other fairly volatile pairs.
Dagger shows the best results on the H1 timeframe, but you can experiment with other timeframes.
The logic of Dagger's work is based on the search for the optimal entry point into the market and the best moment to close a deal. Stochastic oscillator and exponential moving EMA are used for this. Also, the exit from the transaction can be optimized using several parameters.
The strategy can use trailing up to one or more red bars in order not to miss the sharp growth of the currency.

Multi-Length Stochastic Average [LuxAlgo]This indicator returns the average of stochastic oscillators with periods ranging from 4 to length . This allows for a slightly more reactive oscillator as well as having information regarding the position of the price relative to rolling maximums/minimums of different periods.
We introduce settings that allow for pre and post-smoothing, with selectable smoothing methods and periods for both steps.
Settings
Length: Period of the indicator, determine the maximum period of the stochastic oscillator used in the average
Source: Source input of the indicator
Pre-Smoothing (1st Input): Degree of smoothing applied to the source input
Pre-Smoothing (2nd Input): Pre-Smoothing Method
Post-Smoothing (1st Input): Degree of smoothing applied to the final oscillator output
Post-Smoothing (2nd Input): Post-Smoothing Method
Smoothing methods include a simple moving average, a triangular moving average, and a least-squares moving average (this method can induce overshoots during the post-smoothing step). The user can also select "None".
Usages
The "multi-length" aspect of technical indicators is something that hasn't been deeply explored yet such indicators can give us information regarding both short-term and long-term information which was the motivation for the creation of the indicator.
The Multi-length Stochastic Average allows us to quantify the price position relative to a multitude of highest/lowest levels.
In the example above the oscillator returns the average of stochastic oscillators with periods ranging from 4 to 20, as well as multiple rolling minimums with periods ranging from 4 to 20. We can see that when the price is equal to all rolling minimums the oscillator is equal to 0, the oscillator would return 100 if the price were equal to all rolling maximums with periods in that same range.
The oscillator can be interpreted like any scaled oscillator and can be used to estimate trend direction as well as trend strength.
Here we only make of use pre-smoothing by using a period 20 simple moving average. The indicator graphical elements such as colors/circles can help us determine potential directions trends might take.
Circles are displayed when the oscillator crosses over/under the 20/80 level. Such conditions offer better timing than waiting for the oscillator to be greater/lower than 50 and are less subjective to noise than simply looking at the direction taken by the oscillator. However, it can suffer from potential retracements in a trend more easily, this is illustrated in the chart above.

CashTrap Oscilator |HFX|CashTrap oscillator, this oscillator occupies the RSI oscillator and the Stochastic.
When the oscillator turns green, look for purchases.
When the oscillator turns red, look for sales.
For best results, use in conjunction with the CashTrap indicator.

Ultimate Triple Supertrend Strategy [PrismBot] [Lite]Initial Release on Prism Core 1.7.r493
Included in this Ultimate Supertrend Lite Strategy:
✔️ Tweak a multitude of specific settings (MA lengths, R:R, SL distance etc)
✔️ Enable advanced setup filters
✔️ Use money management and risk calculations
✔️ Draw trade info directly to chart (eg. SL size in percent, win rate etc)
✔️ Use various filters (eg. time filter, date filter, MA slope angle etc)
✔️ Manage risk per position when auto-trading forex through AutoView
✔️ Choose from various alert conditions!
✔️ Sync to any bot or algorithmic trading system
Some details about this strategy:
This strategy is a triple Supertrend strategy that includes multi-timeframe analysis built-in to the supertrend function. You also have a multitude of strategies to choose from, such as the newest addition to Prism Core - Stochastic. Our stochastic strategies includes Standard / Strict Standard which buys when overbought and sells when oversold, and a couple of %K cross strategies as well.
There are also many other filters such as RSI, ADX, and more, as well as built-in DCA (dollar cost averaging), position sizing, take profit and stoplosses, and so much more.

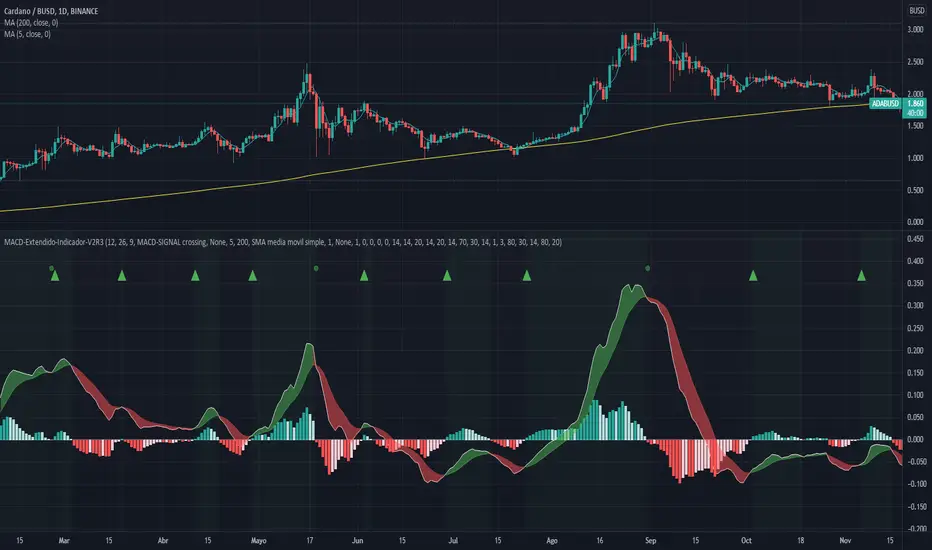
MACD-Extendido-Indicador por NeilMACD-Extendida-Estrategia
--------------------------------
DESCRIPTION
Resource that identifies entry and exit operations using the indicator
Average Convergence and Divergence Movements (MACD) and 5 strategies
INTERESTING
Novel strategies are implemented such as:
1. Overbought and oversold band to avoid horizontal movements
2. Control inputs and outputs at positions opposite the histogram line
3. Make a profit (take profit) without prior purchase orders
HOW DOES IT WORK (STRATEGIES)
1) Overbought and oversold:
Allows you to define an overbought upper band
Allows you to define an oversold ower band
Operations that occur within the band are ignored
2) Place of next operation (either side):
Indicates that the next operation can occur on either side of the histogram
3) Place of next operation (opposite side):
Indicates that the next operation must occur on the opposite side of the histogram
4) Take profit:
It allows defining the deviation in favor to execute a take profit.
It does not place a buy order at a distant point, instead it looks back and if the shift meets the expected deviation, take profit is executed
5) Loss control (stop loss):
It allows to define the deviation against to execute a stop loss.
It does not place a stop order at a distant point, instead it looks back and if the displacement meets the expected deviation the stop loss is executed
How to use it:
Press the "Indicators" option, go to the "Public Librarian" segment, write the name "MACD-Extendido-Indicador Neil", double-click on the record in question and you will have it added in your work panel, now, just It remains to be used to identify the inputs and outputs and you can do it visually or by defining the automatic notification alerts.
DESCRIPCION
Recurso que identifica operaciones de entradas y salida haciendo uso del indicador
Media Móvil de Convergencia/Divergencia (MACD) y 5 estrategias
NOVEDADES
Se implementan estrategias novedosas como:
1. Banda de sobrecompra y sobreventa para esquivar movimientos horizontales
2. Control de entradas y salidas en posiciones contrarias a la línea del histograma
3. Toma de ganancias (take profit) sin ordenes de compra previa
COMO FUNCIONA (ESTRATEGIAS)
1) Sobrecompra y Sobreventa:
Permite definir una banda superior de sobrecompra
Permite definir una banda inferior de sobreventa
Operaciones que ocurren dentro de la banda son ignoradas
2) Lugar de próxima operación (cualquier lado):
Indica que la próxima operación puede ocurrir en cualquier lado del histograma
3) Lugar de próxima operación (lado opuesto):
Indica que la próxima operación debe ocurrir en el lado opuesto del histograma
4) Toma de ganancias (take profit):
Permite definir la desviación a favor para ejecutar una toma de ganancia.
No coloca una orden de compra en un punto distante, en su lugar mira hacia atrás y si el desplazamiento cumple con la desviación esperada se ejecuta la toma de ganancia
5) Control de pérdida (stop loss):
Permite definir la desviación en contra para ejecutar una parada de pérdida.
No coloca una orden de parada en un punto distante, en su lugar mira hacia atrás y si el desplazamiento cumple con la desviación esperada se ejecuta la parada de la pérdida
Como usarlo:
Presione la opción "Indicadores", ubíquese en el segmento "Libreria Publica", escriba el nombre "MACD-Extendido-Indicador por Neil", haga doble clic sobre el registro en cuestión y lo tendrá agregado en su panel de trabajo, ahora, solo resta usarlo para identificar las entradas y salidas y puede hacerlo de forma visual o definiendo las alertas de notificación automática.