Vol Buy/Sell %s, CMF, and Stocahstic Osc & UOPlots % Buy / Sell Volume , Chaikin Money Flow , Stochastic Oscillator, and Ultimate Oscillator on same axis, bound -1 to 1.
Show Volume Percentage, displaying buying as green and positive, selling as red and negative.
Showing the CMF, with green / red fill for positive / negative values.
Modified Stochastic Oscillator, converting bounds to -1 and 1, moving overbought/sold to -0.6 and 0.6, accordingly. Green fill (buy signal) with %D below -0.6 and %K lower than %D. Red fill (sell signal) with %D above 0.6 and %K higher than %D. Fill is between %D and bound, to be more visible.
Modified Ultimate Oscillator, converting bounds to -1 and 1, moving overbought/sold to -0.6 and 0.6, accordingly.
Stochastic-Oscillator

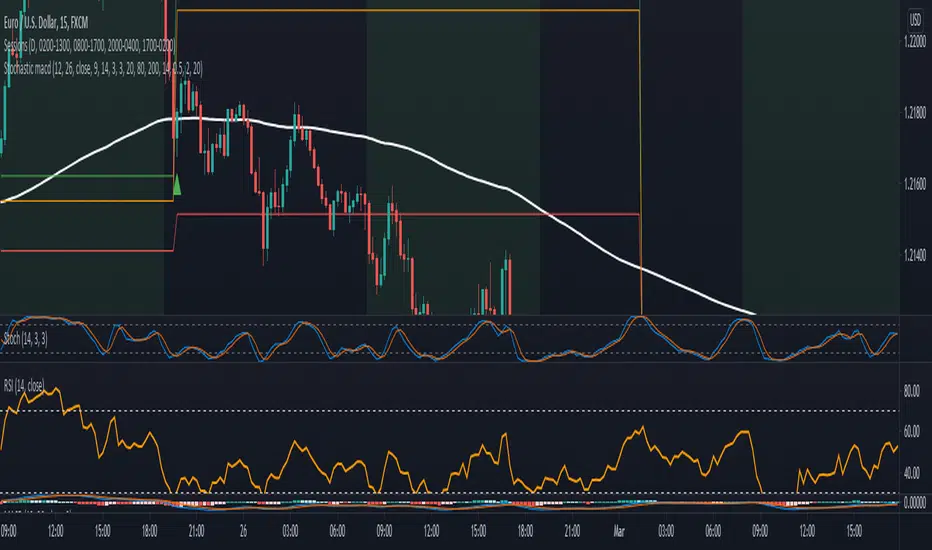
Stochastic with MACD filter + SL/TP + AlertsLong Arrow : close of the candle is above ema + Stochastic is oversold + MACD is below 0 + Stochastic cross up
Short Arrow : close of candle is below ema + Stochastic is overbought + MACD is above 0 + Stochastic cross down
Also added SL, 1:1 and TP where SL can be varied by ATR value and TP is set to 2:1 RR but it can be varied too.
It is not meant to take every single trade even though that might already be profitable.
For higher winrate look for the higher timeframe trend for example when trading the 15min look if the Daily 8ema is going up or down.
Also only take trades when there is either a hidden divergence on RSI or a smaller normal divergence.
The I take the normal divergenes alo when there is no higher high like an M or lower low for longs like a W these tend to work out pretty good too.
Alerts are in it too.
Have Fun :)
Uber Stochastic Index v2 + HistogramRealized how useful a histogram could be for a Stochastic, so I added it to my Uber Stochastic. It actually has two histograms - one on the primary stochastic, and one on a stochastic of the stochastic. So you can histogram while you histogram and stoch while you stoch.
The second stoch is actually really useful sometimes as a early warning but can get ugly on some settings. The histograms are also quite fast on fast settings.
What separates the Uber from the standard stoch? Well, you get 7 K stochastics, technically, to weigh together into one. Looks like one, but I assure you its 7 complete stochastics. You can have a long term stochastic with short term influence or a short term with long term influence, or have one thats all-encompassing.
Why histograms? Stochastic is already read similar to MACD, with crossover signals derived from two lines reflected in one another, one slower then the other. It just makes sense. This way, with a slower running histogram, you can more readily "see" it close in. After all, the best trades are rarely made when the stochastic crosses, but rather as it approaches crossing.
I included a lot of settings for max tweaking. The histograms seem to shift in size considerably depending how you have it set, hence the resolution settings for each. I actually recommend setting the 2nd histogram to inverted resolution, that way you can see them more clearly, but you will also see them on both sides of 0.
And yes, I offset the stochastic so the histogram would look right.
"Wealth beyond measure, Outlander" -Unknown Dunmer
Stochastic 90 30 30This is a modified version of the KD indicator, in which %K is sma30 of 90-bar stochastic and %D is sma30 of %K. Instead of using %K as sma3 of 14- or 9-bar stochastic and %D as sma3 of %K, this modification reduces the sensitivity of the indicator, providing a better trading signal for a longer trading timeframe. The indicator also provides an entry signal when %K < 50 and %K crossovers %D.
The indicator provides the best signal when using together with the turbulence indicator.

Medium Term Weighted Stochastic (STPMT) by DGTLa Stochastique Pondérée Moyen Terme (STPMT) , or Mᴇᴅɪᴜᴍ Tᴇʀᴍ Wᴇɪɢʜᴛᴇᴅ Sᴛᴏᴄʜᴀꜱᴛɪᴄꜱ created by Eric Lefort in 1999, a French trader and author of trading books
█ The STPMT indicator is a tool which concerns itself with both the direction and the timing of the market. The STPMT indicator helps the trader with:
The general trend by observing the level around which the indicator oscillates
The changes of direction in the market
The timing to open or close a position by observing the oscillations and by observing the relative position of the STPMT versus its moving average
STPMT Calculation
stpmt = (4,1 * stoch(5, 3) + 2,5 * stoch(14, 3) + stoch(45, 14) + 4 * stoch(75, 20)) / 11.6
Where the first argument of the stoch function representation above is period (length) of K and second argument smoothing period of K. The result series is then plotted as red line and its moving average as blue line. By default disabled gray lines are the components of the STPMT
The oscillations of the STPMT around its moving average define the timing to open a position as crossing of STMP line and moving average line in case when both trends have same direction. The moving average determines the direction.
Long examples
█ Tʜᴇ CYCLE Iɴᴅɪᴄᴀᴛᴏʀ is derived from the STPMT. It is
cycle = stpmt – stpmt moving average
It is indicates more clearly all buy and sell opportunities. On the other hand it does not give any information on market direction. The Cycle indicator is a great help in timing as it allows the trader to more easily see the median length of an oscillation around the average point. In this way the traders can simply use the time axis to identify both a favorable price and a favorable moment. The Cycle Indicator is presented as histogram
The Lefort indicators are not a trading strategy. They are tools for different purposes which can be combined and which can serve for trading all instruments (stocks, market indices, forex, commodities…) in a variety of time frames. Hence they can be used for both day trading and swing trading.
👉 For whom that would like simple version of the Cycle indicator on top of the main price chart with signals as presented below.
Please note that in the following code STMP moving average direction is not considered and will plot signals regardless of the direction of STMP moving average. It is not a non-repainting version too.
here is pine code for the overlay version
// © dgtrd
//@version=4
study("Medium Term Weighted Stochastic (STPMT) by DGT", "STPMT ʙʏ DGT ☼☾", true, format.price, 2, resolution="")
i_maLen = input(9 , "Stoch MA Length", minval=1)
i_periodK1 = input(5 , "K1" , minval=1)
i_smoothK1 = input(3 , "Smooth K1", minval=1)
i_weightK1 = input(4.1 , "Weight K1", minval=1, step=.1)
i_periodK2 = input(14 , "K2" , minval=1)
i_smoothK2 = input(3 , "Smooth K2", minval=1)
i_weightK2 = input(2.5 , "Weight K2", minval=1, step=.1)
i_periodK3 = input(45 , "K3" , minval=1)
i_smoothK3 = input(14 , "Smooth K3", minval=1)
i_weightK3 = input(1. , "Weight K3", minval=1, step=.1)
i_periodK4 = input(75 , "K4" , minval=1)
i_smoothK4 = input(20 , "Smooth K4", minval=1)
i_weightK4 = input(4. , "Weight K4", minval=1, step=.1)
i_data = input(false, "Components of the STPMT")
//------------------------------------------------------------------------------
// stochastic function
f_stoch(_periodK, _smoothK) => sma(stoch(close, high, low, _periodK), _smoothK)
//------------------------------------------------------------------------------
// calculations
// La Stochastique Pondérée Moyen Terme (STPMT) or Medium Term Weighted Stochastics calculation
stpmt = (i_weightK1 * f_stoch(i_periodK1, i_smoothK1) + i_weightK2 * f_stoch(i_periodK2, i_smoothK2) + i_weightK3 * f_stoch(i_periodK3, i_smoothK3) + i_weightK4 * f_stoch(i_periodK4, i_smoothK4)) / (i_weightK1 + i_weightK2 + i_weightK3 + i_weightK4)
stpmt_ma = sma(stpmt, i_maLen) // STPMT Moving Average
cycle = stpmt - stpmt_ma // Cycle Indicator
//------------------------------------------------------------------------------
// plotting
plotarrow(change(sign(cycle)), "STPMT Signals", color.green, color.red, 0, maxheight=41)
alertcondition(cross(cycle, 0), title="Trading Opportunity", message="STPMT Cycle : Probable Trade Opportunity {{exchange}}:{{ticker}}-> Price = {{close}}, Time = {{time}}")

StochasticUser request. A tuned version of the built-in Stochastic indicator with the following options included:
K-D Histogram
K/D Crossovers
K/D Ribbon
Bands breakouts highlighting
Middle line crossovers background

The WWG Plan Indicator V2█ OVERALL
This indicator was specifically created for the Walsh Wealth Group.
In short it is a fusion of some of the most basic and widely used indicators to show overbought patterns and trend reversals.
Its best usage is with LTF scalping and agressive profit taking but can also be used to find HTF dips and buy-zones.
█ FEATURES
Buy Signal (Buy):
Printed only with all confirmations triggered
Small Buy Signal (B1 & B2)
Printed if some of the confirmations are triggered and can be treated as DCA entries or for further
confirmation with other indicators and basic TA.
Crayons (Color Bars):
Blue: RSI is oversold
Olive: RSI and Stoch RSI are oversold
Yellow: RSI, Stoch RSI are oversold and lower Bollinger Bands are crossed by Low
Orange: RSI, Stoch RSI and CCI are oversold
Trailing SL:
If activated in the config, a trailing SL can be displayed on the chart based on ATR.
█ SETTINGS
The underlying indicators used are RSI, Stoch RSI, Bollinger Bands, MACD and CCI.
All possible configs can be changed in the config settings.
█ GENERAL INFORMATION
Depending on the settings, the indicator performance will be highly affected.
This indicator is only displaying highly oversold areas and events of trend reversal it is not a *God*-Signal and will print false positives.
█ ALERTS
An alert for the main buy-signal is implemented and can be used via the TV alert functionality.

Stochastic with Lines - ChartWhat is Stochastic with Lines - Chart and why do you need it?
I use it for chart analysis to identify key K/D levels from which bullish / bearish market structure continues to develop.
Chart means that every K/D cross above/below the signal lines will be notified on your Chart and not on the stocahstic oscillator. To see them on your chart please choose "Stochastic with Lines - Default" in my library.
Once K or the D line cross over or under your upper or lower signal line you will see background colors which you can adjust in the settings menu.
This small indicator is for a larger project which will be uploaded in several days/weeks.

Stochastic with Lines - DefaultWhat is Stochastic with Lines - Default and why do you need it?
I use it for chart analysis to identify key K/D levels from which bullish / bearish market structure continues to develop.
Default means that every K/D cross above/below the signal lines will be notified on your Stochastic Indicator and not on your chart. To see them on your chart please choose "Stochastic with Lines - Chart" in my library.
Once K or the D line cross over or under your upper or lower signal line you will see background colors which you can adjust in the settings menu.
This small indicator is for a larger project which will be uploaded in several days/weeks.

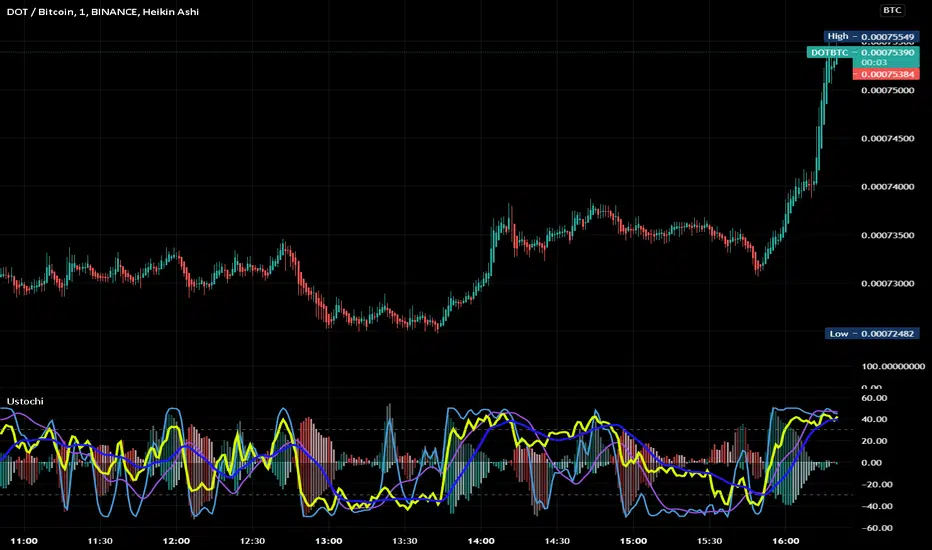
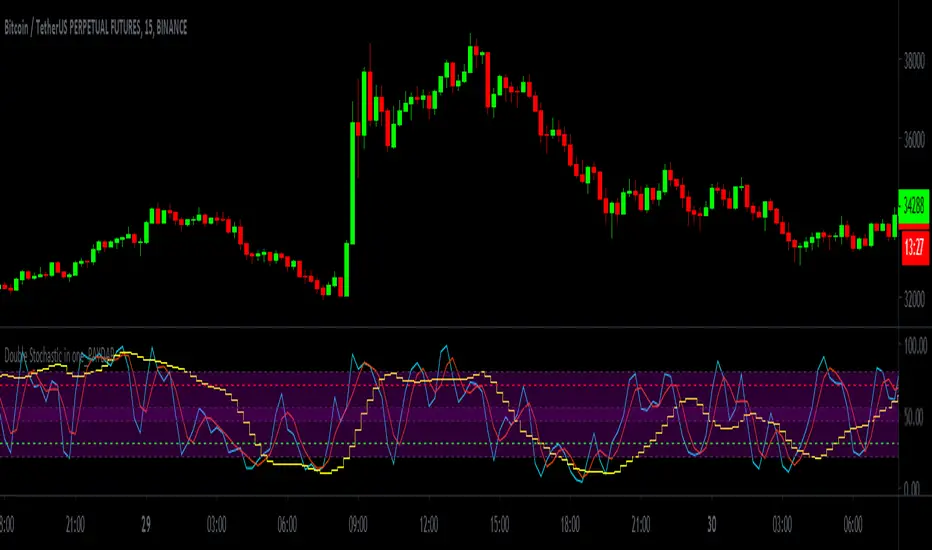
Double Stochastic in one_PAYDARDouble Stochastic in one_PAYDAR
Hello dear friends;
Double Stochastic in one_PAYDAR function:
It actually means that I have used two stochastic oscillators in one oscillator with several lines in different degrees,
First Stochastic: or "Fast Stochastic", as its name implies, is a stochastic oscillator with fast parameters and is capable of detecting small oscillations and small trends.
Second Stochastic : or "slow stochastic" means a stochastic oscillator with slow parameters and is capable of detecting slightly larger fluctuations and trends.
(Of course, here I just put parameter D, because I did not want it to be crowded.)
*** This system just Suggests you for points. ***
_____________________________________________________________________________
How to use this system ( just Suggests you) :
Buy: Whenever the first stochastic (fast stochastic ) crosses in the range of 20 or below and moves upwards, and at the same time the second stochastic (slow stochastic ) moves or crosses the green 30 line, a good time To buy or take a long position.
Sell: Whenever the first stochastic (fast stochastic ) crosses in the range of 80 or above and moves down, and at the same time the second stochastic (slow stochastic ) moves or crosses the red 70 line, a good time For sale or short position.
_____________________________________________________________________________
*** This system just Suggests you for points. ***
My suggestion is not to use this system alone and conclude about entry and exit points according to charts, news, market fluctuations and trend direction.
This system was created by Stochastic Oscillator, which is public and open source on the TradingView site.
***I used the Stochastic Oscillator as a public domain and open source on the TradingView site***
In fast stochastics the values of the parameters are set as fast motion and in slow stochastics the values of the parameters are set as slow motion. In fact, these values of the parameters according to the function and price movement in the candles are fast and slow, and I have determined these values at my suggestion, which, of course, I have consulted with several people.
For easier use and personalization for each person, I have left access to the parameters in this system and you can easily change the parameters as you like and use it optimally for yourself.
Of course, my suggestion is to use the numbers and values of the parameters I have written.
I have put different values, which I think will be very useful for trading swings and even below the daily, but you can change the values of different parameters to your liking.
This oscillator is made of a stochastic oscillator that is open source and public on the TradingView site , of course, due to the changes I have made in the parameter values and the inclusion of two stochastics in one oscillator.
*** In this system, the main and basic oscillators is used, It is available as open source and public on the TradingView site ***
Please comment on the use of this oscillator as well as how to use it and your experiences, I will definitely welcome comments and criticisms.
I am very grateful and very loyal to TradingView ,
Be successful and profitable.
scalping against trapped countertrendAbstract
This script attempts to find the end of countertrend.
This script uses oscillators to measure long term and short period trends. When the long term trend keeps positive and clear short term period is over, this script provides a buy signal.
This script does not contain pullback, cut loss and re-enter. You need to add it manually.
Introduction
Many traders want to buy when long term trend is bullish and short term pullback is over.
This is because we can take advantage to the emotion of countertrend traders.
Countertrend traders realizes their profit is finite and therefore want to protect their profit well and limit their loss.
This script is inspired by a searchable trading strategy video.
The video mentioned 4 points.
(1) long term trend. The video did not spend much ink on this point. You can use any method to observe.
(2) clear pullback bar (at least 50% body)
(3) weak bar after clear pullback
(4) entry trigger buy stop
This script attempts to quantize these points to determine trading direction.
This script is originally designed for timeframes lower than examples in the video but you can apply it on any timeframe.
Computing and Adjusting
(1) long term trend
This script uses smoothed stochastic.
(2) clear pullback bar
Since this script is originally designed for timeframes lower than examples in the video, so the condition becomes:
RSI is low enough
(3) weak bar after clear pullback
RSI goes back from low level.
(4) entry trigger buy stop
This script does not include this condition.
You can decide enter when buy stop or pullback.
Parameters
x_src : the value for computing oscillators
x_len_a : how many bars for measuring short term trend
x_len_b : how many bars for measuring long term trend
x_k_b : smooth long term trend, the average value of stochastic values
x_changk = check if clear short term pullback appears recently. 1 means do not use, larger numbers means how long of periods to check.
x_rsi_ct : threshold of short term pullback clear
x_rsi_ft : threshold of short term pullback end
Reading numbers in Strategy Tester
Most possible loss :
(1) to find rational pullback. Generally 1/3 to 2/3 atr.
(2) to find cut loss distance. Generally 1 to 2 atr.
Most possible profit :
to find if trading the opposite direction against this script is profitable.
Conclusion
This script can suggest us trading direction.
Waiting for pullback can reduce risk, compared to buy stop.
This script does not provide good signals in sideways markets.
Reference
A searchable trading strategy video

TopTenAlgo 6. Trading IndexEN: Trend & Trading Index Oscillator is an indicator developed using Stochastic which makes your day trading easier. Is it to measure price swings with a more sensitive and close to zero error margin, and is the price movement and the direction of the trend compatible? is the ideal guide to look at. The oscillator consists of a 5 step system. Depressions below -0.85 are measured to determine the intake region (Lowlander 2) at the bottom of the step. At the top of the step, enthusiastic movements above 0.90 are detected to determine the sales region(Highlander 2). The buffer zone is the BALANCE "0" zone and its highlander "0. 40 zone close to enthusiasm, and the Lowlander "-0.50" zone close to depression.
This algorithm is prepared with @Top10Algo ... Study modify...
TR: Trend & Trading Index Osiatörü Stochastic kullanırak geliştirilen ve gün içi al satlarınızı kolaylaştıran bir göstergedir. Fiyat salınımlarını daha hassas ve sıfıra yakın bir hatalama payıyla ölçmek ve fiyat hareketi ile trendin yönü uyumlu mu? bakmak için en ideal yol göstericidir. Osilatör 5 basamaklı bir sistemden oluşmaktadır. Basamağın en altında alım bögesini belirlemek için -0.85 değerinin altındaki depresyonlar(Lowlander 2) ölçülür. Basamağın en üstünde ise satış bölgesini belirlemek için 0.90 değerinin üstündeki coşkulu hareketler (Highlander 2) tespit edilir. Ara bölge ise BALANCE “0” bögesi ve onun coşkuya yakın Highlander 1 “0.40" bölgesi ile depresyona yakın Lowlander 1 “-0.50" bölgesi yer alır.
Bu algoritma @Top10Algo ile beraber hazırlanmıştır... Çalışma Prensipleri modifiye edildi...

Multi-Timeframe Stoch RSIGood evening folks!
Today I want to share with you a simple variant of the Stochastic-RSI built-in indicator.
Nothing too complex: by enabling the relative checkbox and setting the desired (k, d or the RSI ) source and timeframes, you can see higher timeframes data plotted on your screen.
Everything you need to do is enabling the indicator on the lowest timeframe (in this case 15 minutes), then you will see in YELLOW the information retrieved from the next higher timeframe (in this case 30 minutes) and in RED the information retrieved from the highest timeframe (in this case 45 minutes).
IT'S IMPORTANT THAT YOU DISPLAY THE INDICATOR ON THE LOWEST TIMEFRAME!
You can play with the overbought and oversold heights in order to have the best configuration you want (in oversold conditions is suggested to buy while in overbought conditions is suggested to sell)
The higher timeframes data are retrieved avoiding repainting since the method used for taking them is the 10th method described in this PineCoders Article , so, if you want to enable alerts, you SHOULD ignore the disclaimer message related to it without any problem.
Good Trading!

TradingView Alerts to MT4 MT5 - Forex, indices, commoditiesHowdy Algo-Traders! This example script has been created for educational purposes - to present how to use and automatically execute TradingView Alerts on real markets.
I'm posting this script today for a reason. TradingView has just released a new feature of the PineScript language - ALERT() function. Why is it important? It is finally possible to set alerts inside PineScript strategy-type script, without the need to convert the script into study-type. You may say triggering alerts straight from strategies was possible in PineScript before (since June 2020), but it had its limitations. Starting today you can attach alert to any custom event you might want to include in your PineScript code.
With the new feature, it is easier not only to execute strategies, but to maintain codebase - having to update 2 versions of the code with each single modification was... ahem... inconvenient. Moreover, the need to convert strategy into study also meant it was required to rip the code from all strategy...() calls, which carried a lot of useful information, like entry price, position size, and more, definitely influencing results calculated by strategy backtest. So the strategy without these features very likely produced different results than with them. While it was possible to convert these features into study with some advanced "coding gymnastics", it was also quite difficult to test whether those gymnastics didn't introduce serious, bankrupting bugs.
//////
How does this new feature work? It is really simple. On your custom events in the code like "GoLong" or "GoShort", create a string variable containing all the values you need inside your alert and this string variable will be your alert's message. Then, invoke brand new alert() function and that's it (see lines 67 onwards in the script). Set it up in CreateAlert popup and enjoy. Alerts will trigger on candle close as freq= parameter specifies. Detailed specification of the new alert() function can be found in TradingView's PineScript Reference (www.tradingview.com), but there's nothing more than message= and freq= parameters. Nothing else is needed, it is very simple. Yet powerful :)
//////
Alert syntax in this script is prepared to work with TradingConnector. Strategy here is not too complex, but also not the most basic one: it includes full exits, partial exits, stop-losses and it also utilizes dynamic variables calculated by the code (such as stop-loss price). This is only an example use case, because you could handle variety of other functionalities as well: conditional entries, pending entries, pyramiding, hedging, moving stop-loss to break-even, delivering alerts to multiple brokers and more.
//////
This script is a spin-off from my previous work, posted over a year ago here: Some comments on strategy parameters have been discussed there, but let me copy-paste most important points:
* Commission is taken into consideration.
* Slippage is intentionally left at 0. Due to shorter than 1 second delivery time of TradingConnector, slippage is practically non-existing.
* This strategy is NON-REPAINTING and uses NO TRAILING-STOP or any other feature known to be causing problems.
* The strategy was backtested on EURUSD 6h timeframe, will perform differently on other markets and timeframes.
Despite the fact this strategy seems to be still profitable, it is not guaranteed it will continue to perform well in the future. Remember the no.1 rule of backtesting - no matter how profitable and good looking a script is, it only tells about the past. There is zero guarantee the same strategy will get similar results in the future.
Full specs of TradingView alerts and how to set them up can be found here: www.tradingview.com

Precise_SignalThis signal combines a portion of Chris Moody's 2014 SlingShot and my 2017 MTF Indicators. Both of our prior scripts over indicated Buy and Sell Points. This signal indicates a buy or sell point much less than our prior scripts did but with absolute precision.
I would say it is 100% accurate, but that is because I am yet to find a timeframe and symbol where the Buy signal failed to see the equity move up or the Sell signal failed to see the equity move down over the next 5 bars. I have tested 2000 charts so far. To be safe, I would rather state this indicator is accurate nearly 100% of the time.
The indicator is made up of 2 main portions and both of them have to agree on a buy or sell in order to indicate such with a vertical green or maroon bar beneath the chart. If there is a failure to agree, nothing is signaled.
Indicator 1 combines a stochastic of a 3 hour chart and a daily chart to determine when the stochastics are in agreement on direction. When there is agreement, both of them MUST cross from a buy state to a sell state and vice versa at exactly the same time. This is difficult to achieve and it is already rare for this occurrence to produce a signal. When a signal is produce it is combine with Chris Moody's 2014 SlingShot Indicator which conservatively determines Buy and Sell signals based on EMAs and market direction. Signals from his SlingShot are infrequent.
BUY Signal
When my MTF signals Buy at the same time that the SlingShot signals a Buy, a vertical green bar will appear in the window containing this script. The vertical bar is based on the close price of the equity and is only final when the close price is final. A BUY signal means the equity will move up potentially as early as the next bar and achieve a higher value from the close price on the signal bar.
SELL Signal
Likewise, a sell signal from the MTF at the same time as a sell signal from the SlingShot will create a maroon bar in the window containing this script. The vertical bar is based on the close price of the equity and is only final when the close price is final. A SELL signal means the equity will move down potentially as early as the next bar and achieve a lower value from the close price on the signal bar.
The default values for this script are hard-coded into this script. You can edit any of the value you would like to play with other timeframes, stochastic, and moving average lengths.
I have played with these values and have hard-coded the ones that are most accurate. Please let me know if you find others that work.
Hopefully this becomes an extra tool in your technical trading toolkit.

Catana Stochastic 4 in 1Catana Stochastic 4 in 1
Description
Catana Stochastic 4 in 1 is an excellent indicator to identify when the price trend of an asset, be it bullish or bearish, begins to run out. If an operator can identify that moment, he will be in optimal conditions to issue the corresponding market orders and to be able to take full advantage of the next price movement.
This indicator is represented by lines ranging between 80 and 20. These lines are called K and D.
Strategy
Overbought. When the blue and red lines are overbought, that is, at 80% of the indicator, it is a sell signal. The confirmation to enter into operation is given when the blue line crosses the red line.
Oversold. When the blue and red lines are oversold, that is, at 20% of the indicator, it is a buy signal. The confirmation to enter into operation is given when the blue line crosses the red line.

Sniper StochasticHow to use?
1) If the color is blueish, bull is dominating the market.
a) Thus look for long position by waiting for the stochastics' cross over from oversold region (or any other skills that you have which is related to stochastic i.e. divergence trading)
b) If there is dark-blue highlight at lower quadrant, it means bull's power is really strong and stable.
2) If the color is yellowish, bear is dominating the market.
a) Thus look for short position by waiting for the stochastics' cross over from overbought region.(or any other skills that you have which is related to stochastic i.e divergence trading)
b) If there is dark-red highlight at upper quadrant, it means bear's power is really strong and stable.
3) If you use multiple time frame analysis for trading, if the higher time frame's pane color is blueish, you can look for buy opportunity at lower time frame.

Stochastic with Outlier Labels/MTFTL;DR This indicator is an update to a simple stochastic ('Stoch_MTF' by binarytrader666) that provides a novel outlier highlighting feature
Improvements on stochastic:
1. Novel outlier highlighting that points out crosses that are the Nth consecutive cross or greater.
2. Allowing for multiple timeframes to be shown on the same chart
3. Highlighting/Labelling crosses and providing labels for alerts
A cross of the stochastics in the high or low zones establishes a trend. Successive crosses in the same region seem to indicate a continuation of that trend. The outlier functionality here provides a signal for when X number of crosses have been in the same trend, signaling further strength of that signal.
I also provided the necessary code for converting this to a strategy if you so wish at the bottom.
MA, Stochastic, RSI w SnowflakeDesigned PresentationThis script provides basic moving average SMA and WMA crosses to trigger the buy or sell signals for bot trades whilst displaying snowflakes. It also has the ability to let the user display more significant price action by judging the length of the space between the SMA and WMA, after filtering using the Stochastic and RSI. Only more significant breaks of these moving average crosses are displayed to the user when optimised which avoids noise and messy signals.
It will also display Stochastic and RSI over bought and over sold with the moving average difference that deems to be bullish (e.g. having a K, D RSI and MA crossing outside of 30-70 range).
Notation
Snow Flakes - the crossing of the moving averages
Aqua Snow Flakes - Trending up
Red Snow Flakes - Trending down
Stars - The crossing of the two moving averages with RSI validation
Blue Stars - Trending up w RSI Overbought
Yellow Stars - Trending down w RSI Oversold
Cross - Stochastic and RSI over bought/over sold
Pink - Pricing up
Blue - Pricing down
This only shows the smaller movement of the trends for a minimum TP
Settings:
K, D - Overbought Oversold numbers of your choice
RSI - Over bought / Over sold numbers of your choice
SMA - numbers of your choice for the closes
WMA - numbers of your choice for the closes
Usage & Details:
I make this chart for simple trades automating with the bots, so you may find too many alerts; they are for my personal private use and under my instructions outside of Trading View. Please don't try to hurt your wallets.
Knowing when a Stochastic and RSI crossing with significance on the stochastic and RSI can be of great help to a trader. Many times over bough and over sold range may not be broken with significant force and the move is therefore weaker and possibly not worth trading. They're marked (or will be marked) in triangles anyways depends on my mood.
There will be few more updates, but I may or may not publish it.
As well, you are welcome message me for the usage of this chart, but I am not friendly after feeling harassed by the moderators of this website. If you really want to make me a vendor, feel free to message me.

StochasticMore colorful than the built-in Stochastic.
My suggestion is to use it for checking divergences between K line with the price only, so I hide the signal D line as default, as the crossover between K line and D line, and the overbought and oversold area are not so reliable.
(JS) Double StochasticThe idea for this indicator came from looking at the Stochastic RSI. The Stochastic RSI takes the RSI reading then applies the Stochastic formula to it - an indicator on top of an indicator. Using this logic, I decided to try using a Stochastic on the existing Stochastic in order to smooth it out - hence the "Double Stochastic". I have also added the option to add RSI on to the indicator as well (with smoothing if you'd like).
Resolution:
I added this so you can look at the reading on any time frame.
K & D:
This is the standard K% and D% used with the Stochastic indicator - the numbers modify the length of their calculations.
Smooth:
This is the smoothing calculation, also from the normal Stochastic indicator.
Use Second Stochastic:
This adds a second Stochastic on to the chart for analysis.
K & D 2:
This is the parameters used to calculate the second K% and D% lines.
Smooth 2:
This is the smoothing interval for the second K% and D% lines.
Use K% and D%:
The default for this is to have it on. What it means is that you wish to see both the K% and D% lines (watching for a cross). If you turn this off, the plot switches to a K% & D% difference line. It is just one line that plots the distance between the two.
SMA Length Using Difference:
If this is on, then you can smooth the difference plot with an SMA, obviously if you just want the raw difference to plot, then set this to 1.
Use RSI:
Since both RSI and Stochastic use a 0-100 scale, I added the ability to plot the RSI along with the Stochastic. This will not plot if you are using the Difference plot, being that plot isn't on a 0-100 scale.
Smooth RSI:
I also added the ability to smooth the RSI if you'd like, you can turn this off for the standard RSI reading.
RSI Length:
This is the period of bars used to calculate the RSI.
RSI Smoothing Length:
This is the smoothing interval if you'd like to apply a moving average on the regular RSI reading.
RSI Smoothing Use EMA:
This makes the RSI smoothing use an EMA, when off an SMA is used instead.
RSI Source:
And finally, this is the source used to calculate the RSI value.
I hope that you all may find this useful, I have been using it myself with a lot of success. Any questions, please leave them in the comments, thanks!

[MACLEN] HODL ZONE RENKO
PLEASE READ!
Trade at your own risk. Please read about renko charts before using this indicator. This indicator is for educational purposes only.
This Indicator is only valid in renko charts with 1 second timeframe. For BTCUSDT . With the traditional method and the size box of 80.
With this indicator we can detect zones of buy and sell. Even that is not recommended to use leverage, I use it to find an entry and use only small leverages. It could be also used to accumulate and HODL bitcoin .
Please, comment anything.
POR FAVOR LEER!
Tradea bajo tu propio riesgo. Por favor lee sobre las graficas renko antes de usar este indicador. Este indicador es solamente con fines educativos.
Este indicador es válido solamente en graficas renko con un timeframe de 1 segundo. Para BTCUSDT . Con cajas del método tradicional de un tamaño de 80.
Con este indicador podemos detectar zonas de compra y venta. A pesar de que no es recomendable usar apalancamiento, yo lo uso para encontrar entradas y solo uso apalancamientos pequeños. También podría usarse para acumular y holdear bitcoin .
Por favor, escríbeme cualquier duda o comentario.

Cash Trap Oscillator 2.0This script uses a DMI, Stochastic , and one RSI , when they are all overbought or oversold (also applying price action and looking for bounce points) we can obtain a greater probability that the price will go in the direction we expect
This script is compact, which can be very useful for many traders. For Best Results, Collect Minimum of 4 Confirmations.
Default values
DMI:
Lenght=10
Stolenght=3
Stochastic:
K=5
D=1
Smooth=1
RSI:
Lenght=4
The indicators configured in this way can bring greater efficiency, do not confront only them, also use price action or other confirmat
They are arranged in a graph, such that the DMI has the oversold at 10 and the overbought at 90, the stochastic oversold at 120 and overbought at 180 and the RSI at oversold at 220 and overbought at 280, you can configure them your way taking into account that the DMI range is from 0-100, stochastic 100-200 and RSI 200-300.
