SMA-Extendido-Estrategia por NeilDescription:
Strategy that identifies entry and exit operations, using 3 moving averages and 5 strategies. New strategies are implemented such as the prediction of closing operations, independent of the events that justify entry operations.
How does it work:
1) Long strategy: if SMA5 crosses up to SMA200 and SMA200 is bullish, a buy operation begins, if SMA5 crosses down to SMA200 and SMA200 is bearish, a sale begins.
2) Short strategy with smooth filtering of operations: if SMA5 crosses up to SMA20 and SMA20 is bullish and (SMA5 are above SMA200) a buy operation is initiated. If SMA5 crosses down to SMA20 and SMA20 is bearish and (SMA5 are below SMA200) a sell trade is initiated
3) Short strategy with strong filtering of operations: if SMA5 crosses up to SMA20 and SMA20 is bullish and (SMA5 and SMA20 are above SMA200 and SMA200 is bullish) a buy is initiated, in other words, buy operations occur only if SMA5 and SMA20 are above SMA200; if SMA5 crosses down to SMA20 and SMA20 is bearish and (SMA5 and SMA20 are below SMA200 and SMA200 is bearish) a sell is initiated, that is, sell operations occur only if SMA5 and SMA20 are below SMA200
4) Short strategy without filtering operations: if SMA5 crosses up to SMA20 and SMA20 is bullish, a buy is initiated (the location of MA200 does not matter). If SMA5 crosses down to SMA20 and SMA20 is bearish, a sell is initiated (it does not matter where the MA200 is located)
5) Prediction of closing operations: the algorithm evaluates potential closing operations differently and considers the following rules: If there is an active buy trade and SMA5 crosses down to SMA20, we close the current buy (the location of the SMA200 does not matter). If there is an active sell trade and SMA5 crosses up to SMA20, we close the sale in progress (the location of the SMA200 does not matter)
How to use it:
Press the "Indicators" option, go to the "Public Librarian" segment, write the name "SMA-Extendido-Estrategia por Neil", double-click on the record in question and you will have it added in your work panel, now, just It remains to be used to identify the inputs and outputs and you can do it visually or by defining the automatic notification alerts.
Simple Moving Average (SMA)

Confluence TradingThis indicator makes use of the Kumo Cloud, 3EMA and ADX/DI+/DI- indicators. While these can be used separately (green bars show where to long and red bars show where to short), this indicator also shows how their use together can create a more precise estimate on when to enter and exit the market. It is interesting to note that while each of the three indicators individually can predict movements and trend reversals early, having their signals converge into one makes a slower prediction but also a more accurate one. It is a great visual representation of why combining multiple trading techniques or analysis increases odds of winning trades (confluence trading). Do feel free to message me if you wish for me to add any other indicator to the mix or to fix any bugs. The ADX indicator makes use of robertkowalski's code.

Multi-timeframe MAs + Stoch RSI SignalsHello traders,
I welcome you to my first published script on TradingView: “Multi-timeframe Moving Averages + Stochastic RSI”.
The script is based on a simple formula: Buy signals are generated when a fast moving average is above a slower moving average (uptrend) and the Stochastic RSI K line is crossing above the oversold level (entry).
Sell signals are generated when a fast moving average is below a slower moving average (downtrend) and the Stochastic RSI K line is crossing below the overbought level (entry).
This indicator works best in strong trends!
**Please note the above example has repainting turned on which may produce unrealistic results when viewing historical data. See below for more information regarding this and how you can turn it off.**
The user has the following inputs:
- Option to change the Stochastic RSI settings, including the oversold and overbought levels.
- Option to enter any value for both the Fast Moving Average and the Slow Moving Average.
- Option to change between EMA or SMA for each moving average.
- Multiple time frames to choose from, as well as the ability to selectively turn off individual time frames (both plots and alerts).
(Default time frames are 1 hour, 4 hour, and Daily. You can have a 4th time frame by changing your current time frame to something lower than the other 3 time frames)
- Turn on/off repainting: If repainting is turned on you will get an alert and buy/sell signal on chart immediately when condition is met, however the signal may disappear from chart if the condition reverses during the same candle.
If repainting is turned off, the indicator will wait for the candle to close before issuing the alert and painting the signal on chart.
For higher time frames, the indicator will wait for the candle in the higher time frame to close before issuing a signal if repaint is turned off. Default is set to Repaint on, so please be aware of this if you do not want repainting.
How to use alerts:
- Before you do anything, make sure your current time frame is the lowest time frame you’d like alerts on, as you will still receive alerts for the higher time frames you selected in settings.
- Once you have all the settings changed to how you like, save your chart first. Then right click on any of the indicator’s buy/sell signals on the chart and click “Add Alert on MAs + Stoch RSI”.
- Make sure “Any alert() function call” is selected under the Condition.
- You can delete or change the text in “Alert name” if you want as the alert message is already built into the indicator, and it will tell you in the alert message which asset and time frame to buy or sell.
Other things to note:
- The indicator will not display the buy/sell signals of lower time frames when you are on a higher time frame. This was done purposely to reduce clutter on the chart when you switch to higher time frames.
- While the alert message will tell you which time frame a signal was generated, the plots on the chart will instead show “Buy/Sell TF1, or TF2, or TF3”.
If the signal is from the current time frame that the alert was created on, then it will simply show “Buy” or “Sell”.
Hope you guys enjoy using this one, please drop a like if you found it useful. If anyone wants to modify my script in any way, please just credit me for the original work when you publish the script. Good luck!

SNL Popular Moving Averages MTFSNL△ Popular Moving Averages MTF
Short title: PopMAs
These are popular moving averages used by various traders and they are multi-timeframe, i.e. you can see
the 200 day SMA on a 15 minute chart.
Four moving averages are also included for the current timeframe (20, 50, 100 and 200 EMA).
Not all moving averages are enabled by default. You can turn individual moving averges on or off in the
"Style" tab of the indicator's settings.
The way I see moving averages is that they do not represent a magic mathematical truth, but are simply the
result of many people agreeing on the same parameters. I guess the origin were five working days in a week
and therefore a month would be four times five, i.e. a 20 day SMA. 200 days are probably an estimate of
the work days in a year and the 50 day SMA represents a quarter year.
There are many indicators on TradingView that offer various adjustable moving averages, including
combinations and multi-timeframe. But my interest was to have an indicator with the most popular moving
averages and it should be multi-timeframe capable. By design I did not want to make the periods adjustable,
but you could add this easily if you like.
Here are some examples of poplular moving averages:
20 unit EMA : support on 4h BTC chart, Carl the Moon
20, 50, 100, 200 day SMA : classic trading all charts, Benjamin Cowen, Tone Vays
20, 50, 100, 200 week SMA: Benjamin Cowen
21 week EMA: well known BTC support, Benjamin Cowen
800 hour EMA: Traders Reality -> not possible in TradingView, represented as 33 day EMA
Known problems:
- I have not found a way to turn off floating labels according to a plot's state chosen in the "Style"
tab. So you will still see the label floating around even if you have turned off the moving average's
line. But you can always turn of all the floating labels in the settings.
- I have observed unexpected differences on multi-timeframe values: For example, looking at the true 20
week SMA on a weekly BTC chart showed a present time value of 43821 USD, but the value was 43908 USD
for the result of this call used in this script: security(syminfo.tickerid, "W", sma(close, 20))
The difference went away when switching my chart to weekly and back to 15 minutes.
Please comment if you know of other moving averages that are often and successfully used or if you find
that one of the included moving averages is irrelevant and should be removed from this script.
And I would very much appreciate any input regarding the mentioned known problems.

Bollinger Bands + Moving Average (BBMA Oma Ally)Found this strategy in babypips forums.babypips.com
This strategy using BB and MA
BBMA Oma Ally Trading Technique
I’m just sharing this Forex Technique that helping me making positive result.
In BBMA, BB (Bollinger Bands) act as Dynamic Support and Resistance.
SETTING OF BBMA - BOLLINGER BANDS
Period : 20
Deviations : 2
Shift : 0
Apply to : Close
Style : Dodge Blue
MA (Moving Average) are used to detect potential entry point.
SETTING OF BBMA - MOVING AVERAGE
Ma5 Hi
Period : 5
Ma Method : Linear Weighted
Apply to : High
Style : Red
Ma10 Hi
Period : 10
Ma Method : Linear Weighted
Apply to : High
Style : Yellow
Ma5 Low
Period : 5
Ma Method : Linear Weighted
Apply to : Low
Style : Magenta
Ma10 Low
Period : 10
Ma Method : Linear Weighted
Apply to : Low
Style : White
Ma50
Period : 50
Ma Method : Exponential
Apply to : Close
Style : Lime
.
EXTREM (SIGNAL)
Extrem is an early signal to say the Market journey is beginning to end - but not yet confirmed
Will only confirm when there is a reversal candle.
Extrem is not valid when there is a CS momentum, although Ma outside BB.
CHARACTERISTICS OF EXTREM
Ma out of Top / Low BB (will not valid if there is cs momentum, although Ma is outside BB)
Reverse candle must exist, as it indicates the journey of a Market is ending (not necessarily 1 or 2 cs)
Retest candle (entry point)
Entry at Highest or Lowest volume
Entry retest candle at Ma5 or body candle
MHV (LOSS VOLUME MARKET) (SETUP)
It is a setup for the beginning of long distance Market journey
This setup gives a validation for the Extrem signal earlier
It is to show the loss of strength for the market.
MHV is valid once CSA (direction candle) appear
***If the candle close NOT above or below Top / Low BB after the first Reentry, after MHV there is a directional candlestick, then there will be a reentry and after the reentry there is no momentum “COMPULSORY TP”
CHARACTERISTICS OF MHV :
Candle CANNOT close above or below Top / Low BB
Must have reverse candle, because reverse candle is confirming the end of the journey (Marking at candle body)
Retest candle (entry point) at Ma5 or highest volume / lowest at that current time
Must happen after Extrem
TYPES OF MHV
5 types but i can only post 1 photo. So sorry i cant give more on this.
RE-ENTRY
CHARACTERISTICS OF REENTRY
Candle close can not pass Ma5 / Ma10
It will be strong when the candle close does not pass Ma5 / Ma10 and also Mid BB
Candle close did not come in. He found Ma5 / Ma10 and mid BB at that Time would make the re-entry stronger
If there is a re-entry in Ma5 / Ma10 and mid BB, the minimum of 3 drops of candles or increments (follow TF) re-entry will be strong
Following market trend, then just search for re-entry and entry
Wait for the second candle, because the first candle validates the reentry and the second candle is for entry

Pi Cycle bitcoin bottomFull credits go to the owner, but for reasons i cannot diclose.
Introduction
With the adoption of cryptographic assets reaching new heights, it is undeniably important to continuously expand and improve current indicators just like how these assets update with new lines of code over time.
Philip Swift’s Pi-Cycle Top Indicator has effectively signaled market and local tops to within 3 days, with the most recent occurrence being on May 12th 2021.
If it were possible to find the cycle/local top of each cycle, a similar analogy could be used to pinpoint the bottom of Bitcoin’s price.
These Pi-Cycle indicators are merely just two moving averages which, when divided by each other, are equal to the value of π.
π = Long MA / Short MA
350/111 = 3.153; as per the existing Bitcoin Pi-Cycle Top indicator.
Pi-Cycle Bottom for Bitcoin
At first, the existing “Pi moving average” pair (350/111) was realigned to see whether they cross at the bottom of the Bitcoin price.
They did not, only to be a lagging indicator in both 2015 and 2018 cycle bottoms.
A possible pair was discovered when the short MA was set to 150:
π = Long MA / 150
Long MA = π * 150
Long MA = 471 (rounded to the nearest whole number)
This resulted in a Pi MA pair of 471/150.
Using the multiple x0.745 of the 471-day SMA and the 150-day EMA (exponential average to take into account of short term volatility ), the price of Bitcoin bottoms at where they two moving averages cross:
When the 150-day EMA crossed below the 471 SMA *0.475, Bitcoin’s price had bottomed for the market cycle.
Over the last two market cycles, this indicator has been accurate to within 3 days also.

Trend Background by Alejandro PThis indicator is a comprehensive trend indicator designed to help traders filter market conditions for their trading.
The indicator has the option to use a classic Simple Moving Average as a trend filer or a more advanced Simple Moving Average Slope.
The indicator can also use the Aroon indicator as the trend filter and both the SMA and Aroon can be used together to only trade in strong trends.
The Simple Moving Average Slope and the Aroon filters can allow you to filter our 3 market conditions. 1- Upwards Trend, 2- Downwards Trend, 3- Ranging
By tuning these filters to your strategy you can make sure you are only taking trades when the trend is on your side and you can even filter out ranging market conditions to trade the best strategies depending on the market conditions.
Technical details:
If the Simple Moving Average filter is on and the Slope filter if off the indicator will determine the trend by where the price is relative to the moving average. If the price is higher than the SMA then the trend will be bullish, if the price is below the SMA the trend will be bearish.
If SMA filter and Slope FIlter are both on then the trend es defined by the slope of the SMA, this means that if the SMA slope is increasing then the trend will be bullish, if the slow is negative then it will be bearish, but if the slope is within a certain percentile that is classified as neutral then there will be no trend or a neutral market.
If the Aroon filter is enabled this will calculate the trend by the percent of candles with new highs or lows in a similar way as the SMA slope filter works
If both filters are enabled then both filters will have to coincide for a bull or bear trend to be determined.

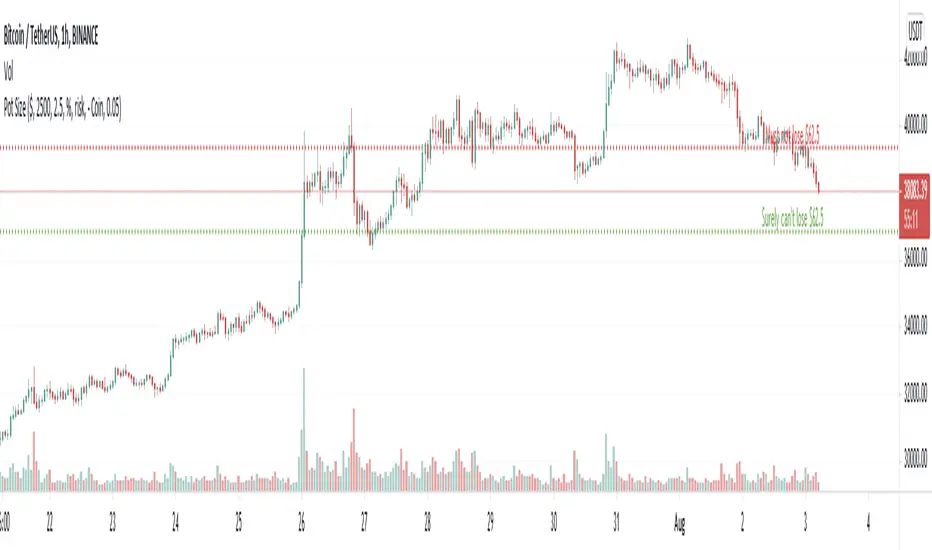
Pot SizeA little FREE script - which may help people set their trade size and stop levels for bitcoin trades.
NOTE :- This script conveys information that requires "indicator arguments" to be turned on.
TO USE :- To adjust to your requirements, click the cog wheel next to the indicator, and adjust "POT SIZE" (how much dollar you have), "RISK %" (the percentage of your dollar portfolio you would like to risk on this trade) and "BITCOIN AMOUNT" - until the short and long 'stop' lines are in the right place in your estimation, for a stop loss that represents the risk you want in relation to the current price for this trade.
The script takes its reference from the closing price; and doesn't include calculations for spread, fees, true range, and volatility etc. That is left open for anyone to add that if they wish. Anyone using this has to make their own adjustments for such considerations not being in this script and therefore make their own compensations.
Anyone wanting to change anything (because values don't go far enough for you) but doesn't know pinescript, can change the numbers next to "defval", "minval", "maxval", and "step" to their suiting in the script itself.
If you use this, you have to work out for yourself if it is useful for you or not. If you depend on it, you must have your own confidence that the calculations in it are acceptable and correct for your use, and you should check yourself and seek advice before trusting it. I convey no confidence in these calculations or this script, and they must be assumed to be acceptable by you if you use it.
Thanks
M
Money Flow Index 5 min Strategy1 - Apply the 3 period Money Flow Index indicator to the 5 minute chart, using 0 and 100 as our oversold and overbought boundaries
2 - Wait for the MFI to reach overbought levels, that indicates the presence of "big sharks" in the market. Price needs to hold up
the first two MFI overbought occurrences of the day to be considered as a bullish entry signal.*
3 - We buy when the MFI = 100 and the next candle is a bullish candle with short wicks.
4 - We place our Stop Loss below the low of the trading day and we Take Profit during the first 60 minutes after taking the trade.
The logic above can be used in a mirrored fashion to take short entries, this is a custom parameter that can be modified from
the strategy Inputs panel.
* I'm using a SMA filter to avoid buying when the price is declining. Time frame was better at 15 min according to my test.

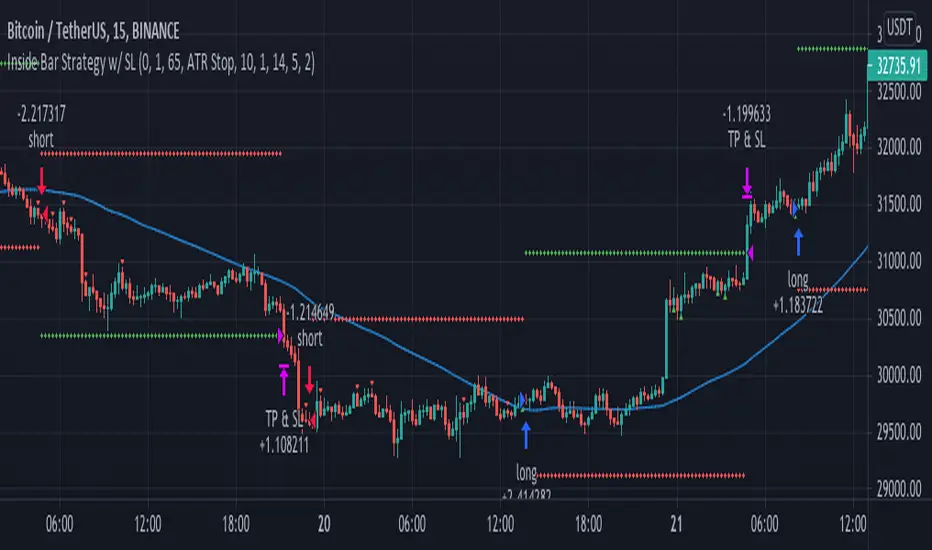
Inside Bar Strategy w/ SL"Inside bars are a two -bar pattern. They can indicate either a continuation of the
existing move or a reversal. A continuation occurs when there is no significant
support or resistance level in sight, while a reversal occurs close to a strong sup-
port or resistance level...
...A lot of traders are aware of inside bars but few manage to make money with
them. Why is this so? It goes back to interpreting price action. A lot of traders look
to trade in geometric ways. What I mean is that they search for fancy shapes on a
chart and think that this is what represents true price action.
This is not the case. A shape is just a shape. The formation by itself means
nothing unless underlying order flow backs it up. This is why it’s extremely
important that you look for inside bars when a trend is already in place.
The best place to look for them is in the beginning of trends."
Six Moving Averages Study (use as a manual strategy indicator)I made this based on a really interesting conversation I had with a good friend of mine who ran a long/short hedge fund for seven years and worked at a major hedge fund as a manager for 20 years before that. This is an unconventional approach and I would not recommend it for bots, but it has worked unbelievably well for me over the last few weeks in a mixed market.
The first thing to know is that this indicator is supposed to work on a one minute chart and not a one hour, but TradingView will not allow 1m indicators to be published so we have to work around that a little bit. This is an ultra fast day trading strategy so be prepared for a wild ride if you use it on crypto like I do! Make sure you use it on a one minute chart.
The idea here is that you get six SMA curves which are:
1m 50 period
1m 100 period
1m 200 period
5m 50 period
5m 100 period
5m 200 period
The 1m 50 period is a little thicker because it's the most important MA in this algo. As price golden crosses each line it becomes a stronger buy signal, with added weight on the 1m 50 period MA. If price crosses all six I consider it a strong buy signal though your mileage may vary.
*** NOTE *** The screenshot is from a 1h chart which again, is not the correct way to use this. PLEASE don't use it on a one hour chart.

MA CloudMA Cloud - a highly configurable cloud for Moving Averages
Creates a cloud from max. 5 Moving Averages.
Users can freely decide, for each average wether it should be SMA,EMA or WMA and also for the time period.
They shades and colors can be freely chose for each combination of MA's, giving you a maximum freedom to configure your cloud.

SMA StrategySMA Strategy for going long or short when a short sma crosses a long sma. This script was published by CaptJava. I added to it the ability to select a back testing date range and choose to go long, short or swap orders. You can enter automated trading buy and sell messages in the properties and then put {{strategy.order.alert_message}} in your webhook alert message and it will dynamically populate your buy or sell message.

Mean AnglesThis indicator plots the trend of the angles made by the chosen means. This trend when analysed over multiple timeframes as well as different lengths can give an indication of the trend in short medium and long term.
For example, in any particular timeframe, when the 20 EMA turns a negative arctan, it signifies that on a shorter timeframe (than the current timeframe) is turning downwards in price. When 50, 100 and 200 EMA turn negative, it confirms the trend reversal. Similarly the 20 EMA will be the first one to turn "Up" or positive to indicate a possible trend reversal on the upside.
The angle of the means will oscillate between +pi/2 and -pi/2.
0 means - EMA is flat
+pi/2 means - almost vertical price rise
-pi/2 means - almost vertical price fall
Between -pi/2 and 0 means EMA is sloped downwards. Moving from -pi/2 to 0 means EMA slope is turning up. Moving from 0 to -pi/2 means EMA slope is falling down even lower and faster.
Between 0 and +pi/2 means EMA is slopped upwards. Moving from +pi/2 to 0 means EMA slope is falling down. Moving from 0 to +pi/2 means EMA slope is turning up even higher and faster.

Tocorin_MTF_MA7 MAs (SMA or EMA) can be displayed in each period.
MTF display is performed only at 5m, 1h, and 4h.
The upper MAs to be displayed are as follows
5m: 1h, 4h, and 1D
1h: 4h and 1D
4h: 1D
The MA line style is stepline and circles to make it easier to see.
You can change it in the settings as you wish.
--
各時間足で 7本の MA(SMA or EMA) 表示が可能です。
5m, 1h, 4h の時だけ MTF 表示を行います。
表示する上位 MA は下記の通り
5m: 1h と 4h と 1D
1h: 4h と 1D
4h: 1D
見やすくするためにMA の線のスタイルを stepline と circles にしています。
設定で任意に変更してください。

GMMAs v2.0 CRYPTO [badshah_e_alam]Hello Traders ,
The GMMAs v2.0 CRYPTO strategy stands for gap modified moving averages designed for cryptos. This is a non Repainting Indicator.
This strategy version is a advanced and modified to one of my previously published indicator named as "gap modified moving average".
I am using my Modified Moving Average indicator for a while. I always wanted to add some more information to moving
averages and made some modification to Moving averages.
The additional Information I have added to the Moving Average helps it to act more quickly based on the price of that
particular asset.
How is strategy gives signals?
when the GMMA'w cross over or cross under the GMMA'y than a trade is taken depending on the filter status.
Info about the settings :
The default setting is for 11m ETHUSD , it works with other cryptos and other timeframe as well . For other timeframes it need to be fine tuned and need little change.
The first category is for the selection of Moving average to be modified and the source to be used for that moving average .
I have added seven moving averages to choose between. SMA works good for me , you can choose and play with other MAs.
following are the option to choose MAs
1.EMA
2.SMA
3.HMA
4.RMA
5.WMA
6.VWMA
7.SWMA
Next option in setting is GMMA'y and GMMA'w :
these two settings define the length and lookback period of the MA you have choosed above.
The length is similar to the length of the moving average chosen to be modified.
The lookback option will look for that number of bars for the modification.
GMMA'w is more sensitive than the GMMA'y. So make sure that the setting input of the GMMA'y is significantly larger than the
GMMA'w.
FILTER:
I have added TradingView inbuilt SUPERTREND as a filter in the strategy, it works very good in filtering out false trades
you can enable/disable it in the settings.
EXIT strategy:
The exit Strategy is based on ATR, Take profit and SL are decided by the ATR in the SL/TP setting option. You can change the RR ratio in the setting.
The backtest settings are as follow:
Initial capital:10k
Initial Commission = 0.000
Initial Pyramiding = 0
Reference :
Thanks to pinecoders and Tradingview community.
my previous gap modified moving average version is :https://in.tradingview.com/script/e3WestBa-Gap-Modified-Moving-Average/
watermark added from:
color gradient framework picked from :https://in.tradingview.com/script/hqH4YIFa-Color-Gradient-Framework-PineCoders/
DISCLAIMER
Any and all liability for risks resulting from investment transactions or other asset dispositions carried out by the user based on information received or a market analysis is expressly excluded by me.
All the information made available here is generally provided to serve as an example only, without obligation and without specific recommendations for action. It does not constitute and cannot replace investment advice. We therefore recommend that you contact your personal financial advisor before carrying out specific transactions and investments.
Do your own research and Risk management before taking any trade.

Stochastic RSI + WMA + SMA strat// "...an entry signal it's a cross down or up on
// the stochastics. if you're in a downtrend
// on the hourly time frame you
// must also be in a downtrend on the five
// minute so the five period has to be below the 144
// as long as the five period is still trading below
// the 144 period on both the hourly and the five minutes
// we are looking for these short signals crosses down
// in the overbought region of the stochastic. Viceversa for longs"
// Works well with a wide stop with 20 bars lookback
// for the SL level and a 2:1 reward ratio Take Profit .
// These parameters can be modified in the Inputs section of the strategy panel.

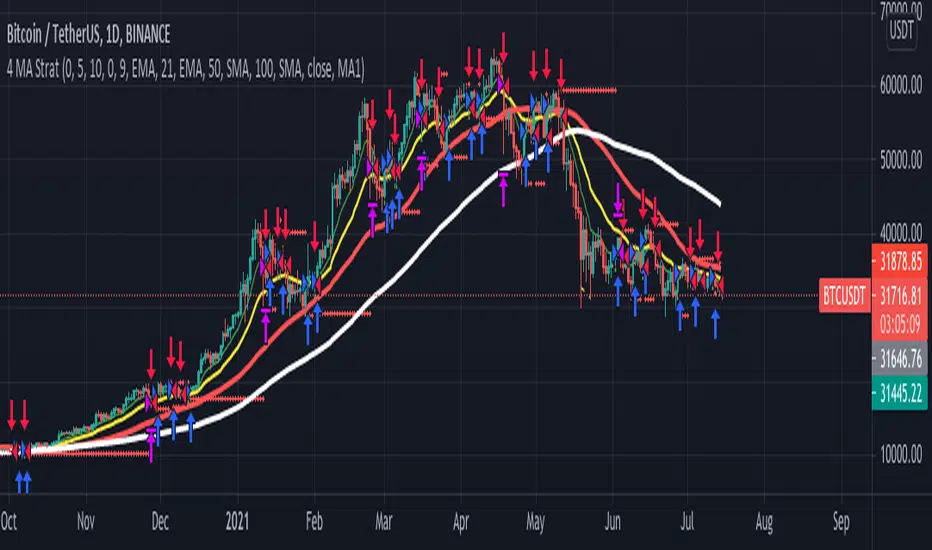
4 MA Strategy + Position Management// This is a simple crossover Moving Average strategy, good for long term crypto trades.
// It buys when the MA "X" crosses up the MA "Y", viceversa for shorts.
// Both MAs are selectable from the Inputs section in the front panel.
// There is also a Position Management option thats
// sizes positions to have the same USD risk (using leverage) on each trade,
// based on the percentage distance to the stop loss level.
// If you turn this option on you will see how the profit
// grows exponentially while the drawdown percentage almost remains the same.
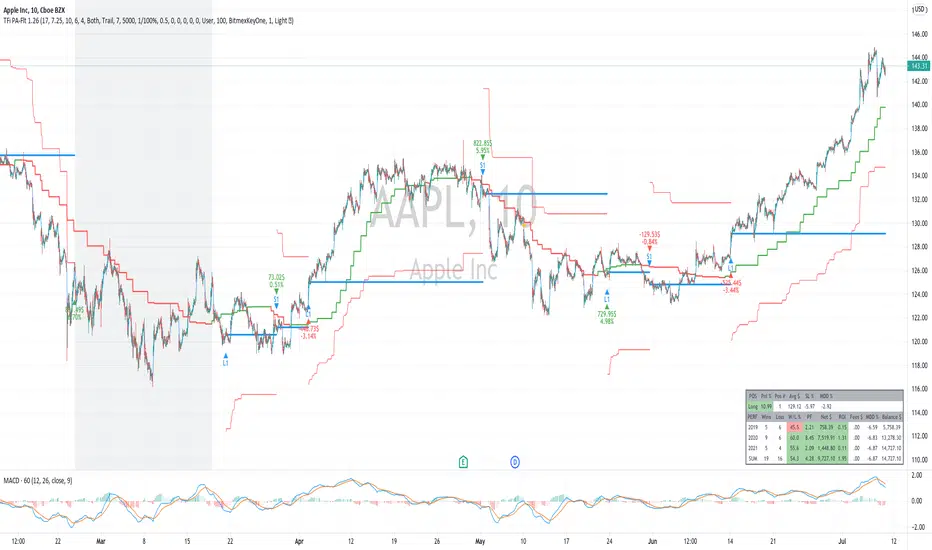
TFi Price Action Resampling Filter V1 - FULLThe script is resampling the price based on its range/price-action and creates an alternative filter to smoothen price movements.
Overview of features:
Optional stop-loss
Optional flags to control the position entry
Optional flags to control the position exit
Built-in backtesting engine with start balance, position size and pyramiding; each year will be evaluated separately
Inputs for a percentage entry and exit slippage, entry/exit and daily funding fees
Configurable alerts, which follow the exact position of the entry/exit marker
Alert messages contain predefined trading instruction to execute orders via Alertatron or TradeFab's proprietary trading server, or can be defined by the user
The script renders a performance/status table, which shows the current position status and result of the built-in trading simulation results.
It shows the following statistic values:
Current position PnL - also background turns green if position is in profit and red if in loss
Average entry price and number of positions
Current percentage distance to the optional stop-loss level
Current Maximum Draw Down
Number of wins and losses and the win/loss ratio per year and overall
Profit and loss amount, paid fees per year and overall
Profit-ratio and Maximum Draw Down per year and overall
Balance and ROI per year and overall
HYE Mean Reversion SMAIndicator version of the strategy "HYE Mean Reversion SMA "
"Long", "Short", "Exit Long" and "Exit Short" alarms added.
Use with "Once Per Bar Close".

HYE Mean Reversion SMA [Strategy]An RSI filtered version of PJ Sutherland's Jaws Mean Reversion algorithm.
"Long" on the close when;
1-) 2 period simple moving average closes 3% or more below the 5 period simple moving average,
2-) 5 period exponential average of the 2 period RSI is below 30.
"Exit Long" on the close when;
1-) 2 period simple moving average closes above the 5 period moving average.
"Short" on the close when;
1-) 2 period simple moving average closes 3% or more above the 5 period simple moving average,
2-) 5 period exponential average of the 2 period RSI is above 70.
"Exit Short" on the close when;
1-) 2 period simple moving average closes below the 5 period moving average.
*** You can change the needed percentage for long and short trades, periods of simple moving averages and RSI levels.
*** You can select the trend direction: "Long Only" , "Short Only" or "Both". Default is "Long Only".

Interest rateCompare the MAs of the three symbols.
Basically it can be applied to interest rates.
It also displays the long-short interest rate differential (Long-Short).

Alt Golden Ratio by USCG_VetPine Script math based on the medium article by Philip Swift.
Idea based from Willy Woo Charts.
Disclaimer: None of this Pine Script, Title, nor Description should be used for Financial Advice. For Education Purposes Only.
Purpose: Identify a Golden Ratio Cross of the 350 Daily MA vs the 111 Daily MA with Multiplier to theorize where local valuation tops or bottoms could be approximated. NOT FINANCIAL ADVICE!
Parameters:
DMA A: short Daily Moving Average
DMA B: long Daily Moving Average
Golden Ratio: point where short Daily Moving Average crosses value assigned in parameter.
Indicators:
S2: Cross of DMA A vs DMA B in upward direction (approximate local top)
Sn: additional approximate top indicators
Sell1: first approximate local bottom
Selln: additional approximate local bottom indicators
GR: Golden-Ratio Cross of DMA A
