3kilos BTC 15mThe "3kilos BTC 15m" is a comprehensive trading strategy designed to work on a 15-minute timeframe for Bitcoin (BTC) or other cryptocurrencies. This strategy combines multiple indicators, including Triple Exponential Moving Averages (TEMA), Average True Range (ATR), and Heikin-Ashi candlesticks, to generate buy and sell signals. It also incorporates risk management features like take profit and stop loss.
Indicators
Triple Exponential Moving Averages (TEMA): Three TEMA lines are used with different lengths and sources:
Short TEMA (Red) based on highs
Long TEMA 1 (Blue) based on lows
Long TEMA 2 (Green) based on closing prices
Average True Range (ATR): Custom ATR calculation with EMA smoothing is used for volatility measurement.
Supertrend: Calculated using ATR and a multiplier to determine the trend direction.
Simple Moving Average (SMA): Applied to the short TEMA to smooth out its values.
Heikin-Ashi Close: Used for additional trend confirmation.
Entry & Exit Conditions
Long Entry: Triggered when the short TEMA is above both long TEMA lines, the Supertrend is bullish, the short TEMA is above its SMA, and the Heikin-Ashi close is higher than the previous close.
Short Entry: Triggered when the short TEMA is below both long TEMA lines, the Supertrend is bearish, the short TEMA is below its SMA, and the Heikin-Ashi close is lower than the previous close.
Take Profit and Stop Loss: Both are calculated as a percentage of the entry price, and they are set for both long and short positions.
Risk Management
Take Profit: Set at 1% above the entry price for long positions and 1% below for short positions.
Stop Loss: Set at 3% below the entry price for long positions and 3% above for short positions.
Commission and Pyramiding
Commission: A 0.07% commission is accounted for in the strategy.
Pyramiding: The strategy does not allow pyramiding.
Note
This strategy is designed for educational purposes and should not be considered as financial advice. Always do your own research and consider consulting a financial advisor before engaging in trading.
Simple Moving Average (SMA)

EMA x 3 MAsThis indicator can be used for moving average strategies based on a EMA trigger over MAs (SMAs) : MA1 , MA2 , MA3 .
Based on those crossings, the background color will change for the upcoming candle showing green for upper crossing change (the more MA are crossed, the darker is the background). Order and priority of background colors :
1/ EMA x MA1
2/ EMA x MA2 (if EMA x MA1 confirmed)
3/ EMA x MA3 (if EMA x MA1and EMA x MA2 confirmed)
EMA and MAs can also be tuned with your own values in the parameters, therefore allowing you to try different strategies and to use the EMA and MAs as support/resistance indication.
You can set up the background and lines colors in the Style in the parameters.

MA Directional Table"MA Directional Table" primary objective is to analyze the direction of the trend based on two Moving Averages (MA) for various timeframes and customizing the inputs to match your preferred style.
Features:
Moving Average Type: You can select which type of Moving Average to use (SMA, EMA, VWMA).
Moving Average Lengths: You can set the lengths for the short-term and long-term moving averages.
Table Position: The indicator provides a table which can be placed at the top or bottom, and to the left or right of the chart. It shows the trend status for multiple timeframes (1 min, 5 min, 15 min, 1 hour, 4 hours, 1 day).
Table Orientation: The table can be oriented either horizontally or vertically.
Price Condition: Optionally, the table color can be set to yellow if the current price deviates from the Moving Average trend and crosses MA1.
Cloud Settings: You can opt to show a cloud between the two moving averages. The color of the cloud changes based on the direction of the trend (bullish or bearish).
Extra MA: Optionally, an extra Moving Average can be plotted on the chart.

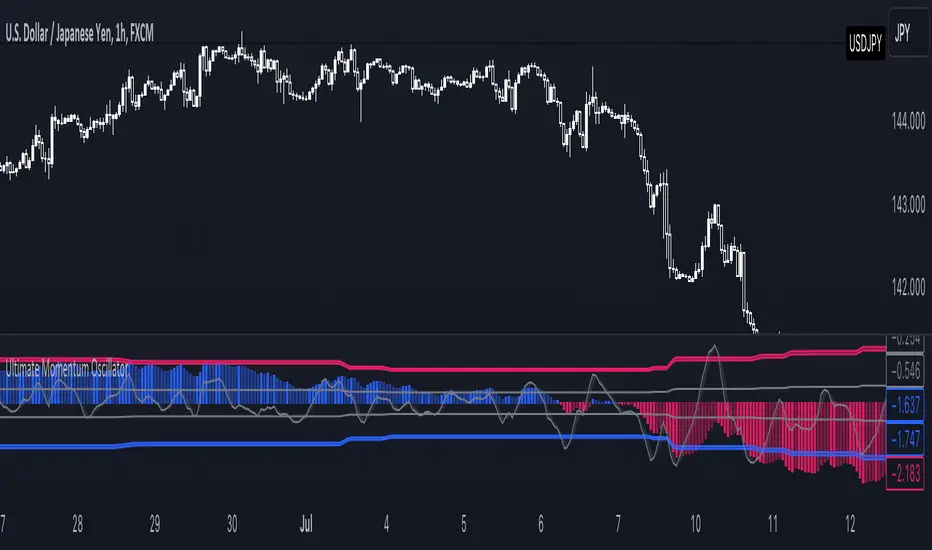
Ultimate Momentum OscillatorThe Ultimate Momentum Oscillator is a tool designed to help traders identify the current trend direction and the momentum of the prices.
This oscillator is composed of one histogram and one line, paired with the two overbought and the two oversold levels.
The histogram is a trend-based algorithm that allows the user to read the market bias with multiple trend lengths combined.
The line is a momentum-based formula that allows traders to identify potential reversal and the speed of the price.
This tool can be used to:
- Identify the current trend direction
- Identify the momentum of the price
- Identify oversold and overbought levels
Average Range LinesThis Average Range Lines indicator identifies high and low price levels based on a chosen time period (day, week, month, etc.) and then uses a simple moving average over the length of the lookback period chosen to project support and resistance levels, otherwise referred to as average range. The calculation of these levels are slightly different than Average True Range and I have found this to be more accurate for intraday price bounces.
Lines are plotted and labeled on the chart based on the following methodology:
+3.0: 3x the average high over the chosen timeframe and lookback period.
+2.5: 2.5x the average high over the chosen timeframe and lookback period.
+2.0: 2x the average high over the chosen timeframe and lookback period.
+1.5: 1.5x the average high over the chosen timeframe and lookback period.
+1.0: The average high over the chosen timeframe and lookback period.
+0.5: One-half the average high over the chosen timeframe and lookback period.
Open: Opening price for the chosen time period.
-0.5: One-half the average low over the chosen timeframe and lookback period.
-1.0: The average low over the chosen timeframe and lookback period.
-1.5: 1.5x the average low over the chosen timeframe and lookback period.
-2.0: 2x the average low over the chosen timeframe and lookback period.
-2.5: 2.5x the average low over the chosen timeframe and lookback period.
-3.0: 3x the average low over the chosen timeframe and lookback period.
Look for price to find support or resistance at these levels for either entries or to take profit. When price crosses the +/- 2.0 or beyond, the likelihood of a reversal is very high, especially if set to weekly and monthly levels.
This indicator can be used/viewed on any timeframe. For intraday trading and viewing on a 15 minute or less timeframe, I recommend using the 4 hour, 1 day, and/or 1 week levels. For swing trading and viewing on a 30 minute or higher timeframe, I recommend using the 1 week, 1 month, or longer timeframes. I don’t believe this would be useful on a 1 hour or less timeframe, but let me know if the comments if you find otherwise.
Based on my testing, recommended lookback periods by timeframe include:
Timeframe: 4 hour; Lookback period: 60 (recommend viewing on a 5 minute or less timeframe)
Timeframe: 1 day; Lookback period: 10 (also check out 25 if your chart doesn’t show good support/resistance at 10 days lookback – I have found 25 to be useful on charts like SPX)
Timeframe: 1 week; Lookback period: 14
Timeframe: 1 month; Lookback period: 10
The line style and colors are all editable. You can apply a global coloring scheme in the event you want to add this indicator to your chart multiple times with different time frames like I do for the weekly and monthly.
I appreciate your comments/feedback on this indicator to improve. Also let me know if you find this useful, and what settings/ticker you find it works best with!
Also check out my profile for more indicators!

Trended and BlendedWhat up guys and welcome to the CoffeeShop. This is your host and "baristo", Eric.
This is a simple little set of 3 moving averages. Smoothed moving averages that you can use in the 10 /28 strategy, or any other strategy you choose.
Among themselves there is nothing special about these moving averages, but because of their settings they will help you find entries for long and short positions and for divergence trading.
These moving averages have conditional colors built into the code, using the pinescript "color from gradient" feature.
All three moving averages, are green when they are all lined up in a bullish form.
All three are red when they're all lined up in a bearish form.
And they are colored Gray when price action and the moving averages are mixed up in any way.
But this is not enough to help you determine whether you have a true trend or not also it is not enough to tell you whether you have a strong or weak trend so there's more.
Add to this color command, the candles are colored ONLY when there is a true uptrend or downtrend.
If you believe for any reason that price action is telling you this is going to a a short term trend, you can
wait for your long or short color confirmations and then drop down to a lower timeframe to make your trades.
STRONG TREND:
for a strong uptrend you would look for the candles to close bullish above all three green moving averages that were already lined up. This would be a strong uptrend. If price action closed below all three downward lined up moving averages they were all red and your candle is red then you have a strong downtrend.
Week Trend
However if your candle closes bearish and it closes red below a mixed set of moving averages then you have a week downtrend.
The same applies if you have a bullish closing candle but your fast and medium moving average are facing up however they are below your slow moving average. You may have a green line up however if you're moving averages are mixed up then you have a weak trend.
Summary
In short a strong trend is when you close above or below moving averages that are lined up in the same direction and they are not mixed in any way. A weak trend is when you close above or below your fast and medium moving averages as they're lined up in that same direction however they are on the wrong side of your third moving average.
When you have a weak trend you should be scalping and when you have a strong trend you should be able to ride that trend more appropriately.

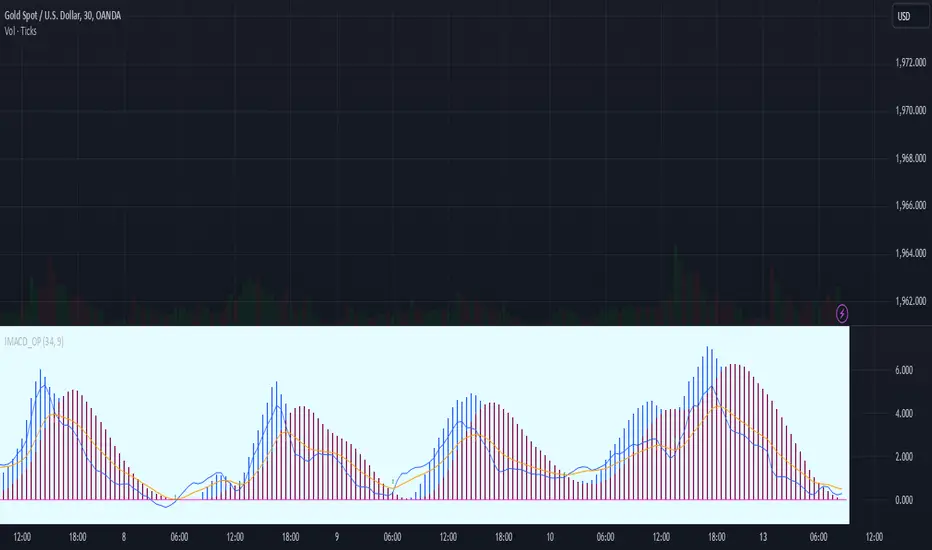
Impulse MACD buy OwlPixelDescription:
The Impulse MACD Buy Indicator, developed by OwlPixel, is a powerful trading tool for traders using TradingView's Pine Script version 5. This indicator aims to provide valuable insights for identifying potential buy signals in the market using the popular MACD (Moving Average Convergence Divergence) oscillator.
Key Features:
MACD Analysis: The indicator displays the MACD line (blue) and the signal line (orange) on the chart, helping traders assess the momentum and trend direction of an asset.
Impulse Histo: The Impulse Histo (blue histogram) visualizes the difference between the MACD line and the signal line, making it easier to spot changes in market strength and potential trend reversals.
Impulse MACD CD Signal: This histogram (maroon color) highlights the divergence between the Impulse Histo and the signal line, providing further insights into trend shifts.
Background Boxes: The indicator features three rows of different colored background boxes that represent distinct market conditions - an uptrend (light green), a downtrend (light red), and a neutral trend (light yellow).
Crossover Points: Buy signals are marked with green circles when the MACD line crosses above the signal line, suggesting potential entry points for long positions.
Demand and Supply Bars: The demand (lime/green) and supply (red/orange) bars are intensified, aiding traders in identifying possible reversal areas.
Stop Loss and Take Profit:
The Impulse MACD Buy Indicator automatically calculates Stop Loss (SL) and Take Profit (TP) levels for buy signals. The SL level is set at the highest of the last three candles, while the TP level is determined by a user-defined percentage of the closing price. This information helps traders manage risk and optimize their profit potential.
Usage:
Apply the Impulse MACD Buy Indicator to your TradingView chart by copying the provided Pine Script into the Pine Editor.
Configure the input parameters, such as the MA Length and Signal Length, to suit your trading preferences.
Observe the MACD line, signal line, and histograms to gain insights into market momentum and trends.
Identify buy signals when the MACD line crosses above the signal line, signaled by green circles.
Utilize the provided Stop Loss and Take Profit levels for risk management and exit strategies.
Please note that this indicator is for informational purposes only and should be used in conjunction with other analysis techniques to make well-informed trading decisions. Happy trading!
Quantitative Trend Strategy- Uptrend longTrend Strategy #1
Indicators:
1. SMA
2. Pivot high/low functions derived from SMA
3. Step lines to plot support and resistance based on the pivot points
4. If the close is over the resistance line, green arrows plot above, and vice versa for red arrows below support.
Strategy:
1. Long Only
2. Mutable 2% TP/1.5% SL
3. 0.01% commission
4. When the close is greater than the pivot point of the sma pivot high, and the close is greater than the resistance step line, a long position is opened.
*At times, the 2% take profit may not trigger IF; the conditions for reentry are met at the time of candle closure + no exit conditions have been triggered.
5. If the position is in the green and the support step line crosses over the resistance step line, positions are exited.
How to use it and what makes it unique:
Use this strategy to trade an up-trending market using a simple moving average to determine the trend. This strategy is meant to capture a good risk/reward in a bullish market while staying active in an appropriate fashion. This strategy is unique due to it's inclusion of the step line function with statistics derived from myself.
This description tells the indicators combined to create a new strategy, with commissions and take profit/stop loss conditions included, and the process of strategy execution with a description on how to use it. If you have any questions feel free to PM me and boost if you enjoyed it. Thank you, pineUSERS!

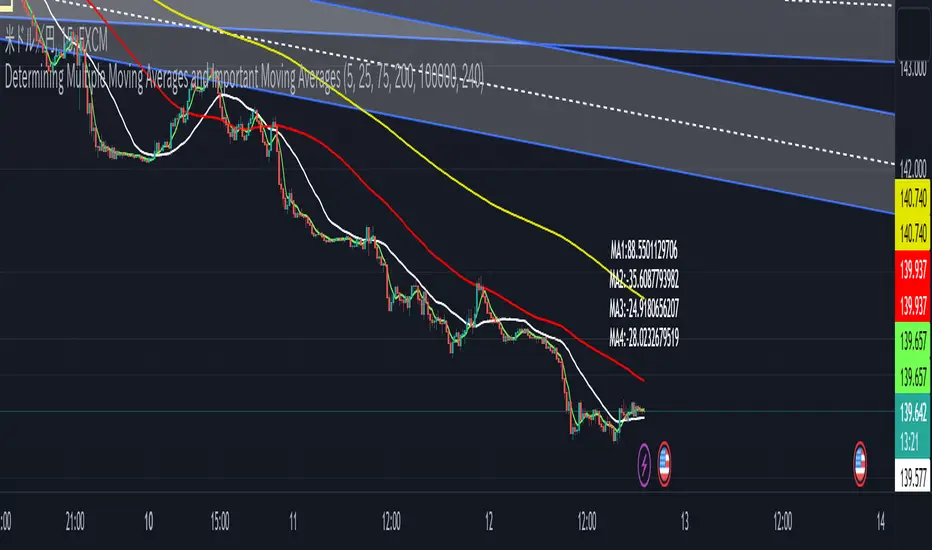
DMMAverages and IMAThis puts away multiple moving averages. The moving average line that this draws is calculated from the closing price, but it uses a slightly different method to determine if the moving average line is heard, and if the closing price is between the high and low moving averages, it counts. The ratio of each count is calculated and the rate of change (variance) is calculated. This value is used as the basis for the assistance. If the variance is high, it means that this average line is working. It also draws a label and displays its value. This value will change to the color of the moving average you are currently listening to. When you change the color yourself, it is indefinite.
Market Smith IndicatorsMarket Smith has a collection of tools that are useful for identifying stocks. On their charts they have a 21/50/200 day moving averages, high and low pivot points, a relative strength line, and a relative strength rating. This script contains indicators for the following:
21/50/200 Day Moving Averages
High and Low pivot points
A Relative Strength line
A Relative Strength rating
21/50/200 Day Moving Averages
The 21/50/200 Day moving averages are simple moving averages. They are visible in any chart increment but to use them properly you need to set you charts to be by day. Labels will appear on the right of the lines to show that they are representative of 21/50/200 day moving averages.
High and Low pivot points
The High and Low pivot points are green for high pivot points and red for low points. They are show in the Market Smith style with the numbers simply above the pivot points.
Relative Strength line
The Relative Strength line is a line that shows the strength of the stock compared to the S&P 500. In this case we utilize the SPX ticker to compare the stock to. This line is almost identical to the Market Smith tool and is an excellent tool to determine how a stock is doing compared to the market. When movements in the stock and shown with sideways trending of the RS line that means that the stock is following the market. When a stock is outperforming the market the RS line will follow.
Relative Strength rating
Thank you to ©Fred6724 for the RS Rating inspiration. They wrote excellent open source code for a RS Rating comparable to Market Smith. As the RS Rating in Market Smith is not open source it is difficult to know exactly how it is being calculated. After simplifying Fred's code and building upon a few ideas I had I compared the RS Rating to multiple Market Smith Ratings. The rating is close but often off by multiple points. If there is anyone who has a better idea on how to get this rating or how to improve on the code please send me a PM or fork this project. This rating is a good indicator to see how a certain stock compares to other stocks in the market. In Market Smith they are able to utilize their database to compare it to all other stocks. Since we do not have access to the same tools we are only able to compare it to the percentage of stocks above the 200, 150, 100, 50, and 20 day moving average.
Using these tools together are a small fraction what make people like Bill O'neill and Jim Roppel so successful. I plan on updating the RS Rating as I continue to work on this project so if there is anyone who has ideas then please send me a PM. Ultimately the goal of this project is to have a solution that is identical to Market Smith.

All in One EMA indicator with Average EMA Calculations The Indicator displays multiple exponential moving averages (EMAs) on the chart. The six available options will let you adjust and set ]exponential moving averages ( EMAS) as per your choice. Additionally I have added an Average ema which will calculate the average of all the emas that you have selected. This average ema works very strong and greatly to find potential zone of dynamic supports and resistance as well as to gauge the overall trend .. The average ema will also allow you to keep your chart clean and you wont have to add too many emas together.
The average of the selected EMAs are displayed as a single line. This helps identify trends and potential reversals in the market. i hope this indicator will help you with trading...
Plz use the chart BINANCE:LINKBTC as reference, for back testing and educational purposes only.
Thumbs up if you liked the script.
Happy trading..

twisted SMA strategy [4h] Hello
I would like to introduce a very simple strategy that uses a combination of 3 simple moving averages ( SMA 4 , SMA 9 , SMA 18 )
this is a classic combination showing the most probable trend directions
Crosses were marked on the basis of the color of the candles (bulish cross - blue / bearish cross - maroon)
ma 100 was used to determine the main trend, which is one of the most popular 4-hour candles
We define main trend while price crosses SMA100 ( for bullish trend I use green candle color )
The long position strategy was created in combination of 3 moving averages with Kaufman's adaptive moving average by alexgrover
The strategy is very accurate and is easy to use indicators
the strategy uses only Buy (Long) signals in a combination of crossovers of the SMA 4, SMA 9, SMA 18 and the Kaufman Adaptive Moving Average.
As a signal to close a long position, only the opposite signal of the intersection of 3 different moving averages is used
the current strategy is recommended for higher time zones (4h +) due to the strength of the closing candles, which translates into signal strength
works fascinatingly well for long-term bullish market assets (for example 4h Apple, Tesla charts)
Enjoy and trade safe ;)

REVE Cohorts - Range Extension Volume Expansion CohortsREVE Cohorts stands for Range Extensions Volume Expansions Cohorts.
Volume is divided in four cohorts, these are depicted in the middle band with colors and histogram spikes.
0-80 percent i.e. low volumes; these get a green color and a narrow histogram bar
80-120 percent, normal volumes, these get a blue color and a narrow histogram bar
120-200 percent, high volume, these get an orange color and a wide histogram bar
200 and more percent is extreme volume, maroon color and wide bar.
All histogram bars have the same length. They point to the exact candle where the volume occurs.
Range is divided in two cohorts, these are depicted as candles above and below the middle band.
0-120 percent: small and normal range, depicted as single size, square candles
120 percent and more, wide range depicted as double size, rectangular candles.
The range candles are placed and colored according to the Advanced Price Algorithm (published script). If the trend is up, the candles are in the uptrend area, which is above the volume band, , downtrend candles below in the downtrend area. Dark blue candles depict a price movement which confirms the uptrend, these are of course in the uptrend area. In this area are also light red candles with a blue border, these depict a faltering price movement countering the uptrend. In the downtrend area, which is below the volume band, are red candles which depict a price movement confirming the downtrend and light blue candles with a red border depicting price movement countering the downtrend. A trend in the Advanced Price Algorithm is in equal to the direction of a simple moving average with the same lookback. The indicator has the same lagging.as this SMA.
Signals are placed in the vacated spaces, e.g. during an uptrend the downtrend area is vacated.
There are six signals, which arise as follows:
1 Two blue triangles up on top of each other: high or extreme volume in combination with wide range confirming uptrend. This indicates strong and effective up pressure in uptrend
2 Two pink tringles down on top of each other: high or extreme volume in combination with wide range down confirming downtrend. This indicates strong and effective down pressure in downtrend
3 Blue square above pink down triangle down: extreme volume in combination with wide range countering uptrend. This indicates a change of heart, down trend is imminent, e.g. during a reversal pattern. Down Pressure in uptrend
4 Pink square below blue triangle up: extreme volume in combination with wide range countering downtrend. This indicates a change of heart, reversal to uptrend is imminent. Up Pressure in downtrend
5 single blue square: a. extreme volume in combination with small range confirming uptrend, b. extreme volume in combination with small range countering downtrend, c. high volume in combination with wide range countering uptrend. This indicates halting upward price movement, occurs often at tops or during distribution periods. Unresolved pressure in uptrend
6 Single pink square: a extreme volume in combination with small range confirming downtrend, b extreme volume in combination with small range countering uptrend, c high volume in combination with wide range countering downtrend. This indicated halting downward price movement. Occurs often at bottoms or during accumulation periods. Unresolved pressure in downtrend.
The signals 5 and 6 are introduced to prevent flipping of signals into their opposite when the lookback is changed. Now signals may only change from unresolved in directional or vice versa. Signals 3 and 4 were introduced to make sure that all occurrences of extreme volume will result in a signal. Occurrences of wide volume only partly lead to a signal.
Use of REVE Cohorts.
This is the indicator for volume-range analyses that I always wanted to have. Now that I managed to create it, I put it in all my charts, it is often the first part I look at, In my momentum investment system I use it primarily in the layout for following open positions. It helps me a lot to decide whether to close or hold a position. The advantage over my previous attempts to create a REVE indicator (published scripts), is that this version is concise because it reports and classifies all possible volumes and ranges, you see periods of drying out of volume, sequences of falter candles, occurrences of high morning volume, warning and confirming signals.. The assessment by script whether some volume should be considered low, normal, high or extreme gives an edge over using the standard volume bars.
Settings of REVE Cohorts
The default setting for lookback is ‘script sets lookback’ I put this in my indicators because I want them harmonized, the script sets lookback according to timeframe. The tooltip informs which lookback will be set at which timeframe, you can enable a feedback label to show the current lookback. If you switch ‘script sets lookback’ off, you can set your own preferred user lookback. The script self-adapts its settings in such a way that it will show up from the very first bar of historical chart data, it adds volume starting at the fourth bar.
You can switch off volume cohorts, only range candles will show while the middle band disappears. Signals will remain if volume is present in the data. Some Instruments have no volume data, e.g. SPX-S&P 500 Index,, then only range candles will be shown.
Colors can be adapted in the inputs. Because the script calculates matching colors with more transparency it is advised to use 100 percent opacity in these settings.
Take care, Eykpunter

Ratio To Average - The Quant ScienceRatio To Average - The Quant Science is a quantitative indicator that calculates the percentage ratio of the market price in relation to a reference average. The indicator allows the calculation of the ratio using four different types of averages: SMA, EMA, WMA, and HMA. The ratio is represented by a series of histograms that highlight periods when the ratio is positive (in green) and periods when the ratio is negative (in red).
What is the Ratio to Average?
The Ratio to Average is a measure that tracks the price movements with one of its averages, calculating how much the price is above or below its own average, in percentage terms.
USER INTERFACE
Lenght: it adjusts the number of bars to include in the calculation of the average.
Moving Average: it allows you to choose the type of average to use.
Color Up/Color Down : it allows you to choose the color of the indicator for positive and negative ratios.

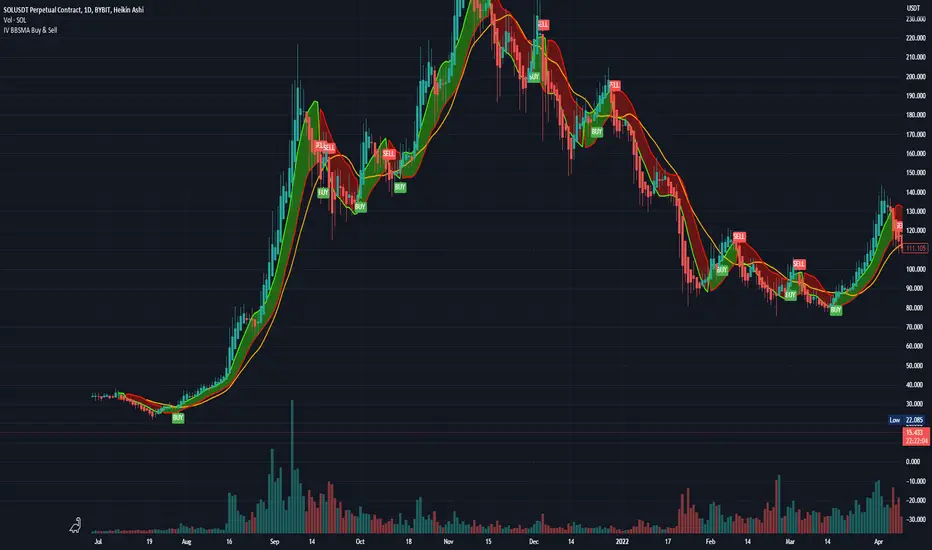
Bollinger Bands and SMA Channel Buy and Sell
This Indicator is a combination of a standard BB indicator incorporated with a SSL Channel by ErwinBeckers which is Simple Moving average with a length of set at 10 (Default) and calculates the high and low set for the default 10 to form a Channel.
The Settings for the Bollinger Band is the standard settings on a normal Bollinger Band - Length 20, source close and Standard dev 2
The setting for the SMA is length 10 and the high and low calculated or that length to form a channel.
The SMA Channel gives a green line for the Up channel and the Red line for the down Channel.
The basis of the indicator is that the Candle close above the Basis line of the BB and the SMA green line will give a buy indicator
and the same for Sell indicator the candle close below the basis BB and the SMA line Red will give a Sell indicator.
Please note that this indicator is a mix of 2 basic indicators found in Trading view, giving Buy and Sell indicators to make things easier to not look for this visually.
This code will be open source for anyone to use or back test or use it for whatever they want.
This code is for my own personal trading and cannot be relied upon. This indicator cannot be used and cannot guarantee anything, and caution should always be taken when trading. Use this with other indicators to give certanty.
Again use this for Paper Trading only.
I want to thank TradingView for its platform that facilitates development and learning.
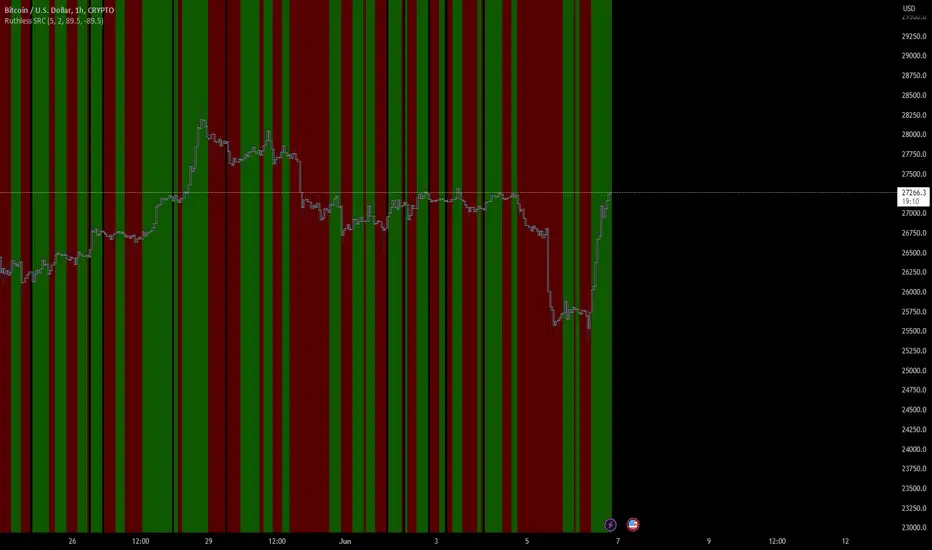
Ruthless Support and Resistance ConformationThe Ruthless Support and Resistance Conformation (SRC) indicator is designed to identify and confirm support and resistance levels in the price chart. It utilizes an exponential moving average (EMA) and calculates the angle between the current EMA value and a previous EMA value over a specified length.
The indicator visually represents the conformation of support and resistance levels by plotting colored backgrounds on the chart. When the angle of the EMA surpasses the upper threshold, indicating a strong upward movement, the background color turns red. Conversely, when the angle drops below the lower threshold, indicating a significant downward movement, the background color turns green. In areas where the angle remains within the thresholds, the background color is set to a lighter shade.
Traders can utilize this indicator to identify potential areas of support and resistance based on the conformation of the EMA angle. The upper threshold can indicate potential resistance levels, while the lower threshold can indicate potential support levels.
To provide additional clarity, the indicator also includes horizontal lines representing the upper and lower thresholds on the chart, allowing traders to visually gauge the conformation against these levels.
Please note that this indicator should be used in conjunction with other technical analysis tools and indicators to make well-informed trading decisions. It is recommended to customize the length, thresholds, and other parameters of the indicator based on individual trading strategies and preferences.
Planetary Tunings Moving AveragesThe Pine Script "Planetary Tunings Moving Averages" is a unique tool that plots moving averages (MAs) on a chart, representing the wavelengths of different planets as derived from the book Quadrivium. These wavelengths, also referred to as 'planetary tunings', are related to the orbital resonance of each planet.
Each planetary tuning value is first transformed into a whole number by multiplying it by 1000 and removing the decimal. This whole number is then used as the length parameter for a Simple Moving Average (SMA) function. This function calculates the average of the closing prices over the defined number of periods, thereby creating a moving average line on the chart.
The moving average lines are color-coded according to the planet they represent, allowing for quick and easy interpretation. For example, Mercury's moving average line is blue, Venus's line is orange, and so forth. These colors can be adjusted directly in the Pine Script code if desired.
Additionally, the script computes the mean of all these moving averages and plots it on the chart. This line provides an overall trend line, summarizing the collective behavior of all the planetary tuning moving averages.
The drawings in the chart are fib channels and fib circles that I use to capture liquidity in time.
Please note that this script is written for Pine Script Version 4. It's crucial to ensure your TradingView platform is compatible with this version. For any issues or further clarification, consider referring to TradingView's Pine Script documentation or its community forums.

Wyckoff Range StrategyThe Wyckoff Range Strategy is a trading strategy that aims to identify potential accumulation and distribution phases in the market using the principles of Wyckoff analysis. It also incorporates the detection of spring and upthrust patterns.
Here's a step-by-step explanation of how to use this strategy:
Understanding Accumulation and Distribution Phases:
Accumulation Phase: This is a period where smart money (large institutional traders) accumulates a particular asset at lower prices. It is characterized by a sideways or consolidating price action.
Distribution Phase: This is a period where smart money distributes or sells a particular asset at higher prices. It is also characterized by a sideways or consolidating price action.
Input Variables:
crossOverLength: This variable determines the length of the moving average crossover used to identify accumulation and distribution phases. You can adjust this value based on the market you are trading and the time frame you are analyzing.
stopPercentage: This variable determines the percentage used to calculate the stop loss level. It helps you define a predefined level at which you would exit a trade if the price moves against your position.
Strategy Conditions:
Enter Long: The strategy looks for a crossover of the close price above the SMA of the close price with a length of crossOverLength and a crossover of the low price above the SMA of the low price with a length of 20. This combination suggests the start of an accumulation phase and a potential buying opportunity.
Exit Long: The strategy looks for a crossunder of the close price below the SMA of the close price with a length of crossOverLength or a crossunder of the high price below the SMA of the high price with a length of 20. This combination suggests the end of an accumulation phase and a potential exit signal for long positions.
Enter Short: The strategy looks for a crossunder of the close price below the SMA of the close price with a length of crossOverLength and a crossunder of the high price below the SMA of the high price with a length of 20. This combination suggests the start of a distribution phase and a potential selling opportunity.
Exit Short: The strategy looks for a crossover of the close price above the SMA of the close price with a length of crossOverLength or a crossover of the low price above the SMA of the low price with a length of 20. This combination suggests the end of a distribution phase and a potential exit signal for short positions.
Stop Loss:
The strategy sets a stop loss level for both long and short positions. The stop loss level is calculated based on the stopPercentage variable, which represents the percentage of the current close price. If the price reaches the stop loss level, the strategy will automatically exit the position.
Plotting Wyckoff Schematics:
The strategy plots different shapes on the chart to indicate the identified phases and patterns. Green and red labels indicate the accumulation and distribution phases, respectively. Blue triangles indicate spring patterns, and orange triangles indicate upthrust patterns.
To use this strategy, you can follow these steps:
Jim Forte — Anatomy of a Trading Range
robertbrain.com/Bull...+a+Trading+Range.pdf

Inverted ProjectionThe "Inverted Projection" indicator calculates the Simple Moving Average (SMA) and draws lines representing an inverted projection. The indicator swaps the highs and lows of the projection to provide a unique perspective on price movement.
This indicator is a simple study that should not be taken seriously as a tool for predicting future price movements; it is purely intended for exploratory purposes.

The HoneyChai RSI by CoffeeShopCryptoHere is a fun new way to view the RSI. A new TradingView Indicator for you RSI enthusiasts. This is the Honey Chai RSI Indicator.
This indicator combines the RSI oscillator with additional features to enhance its functionality and visual study.
The purpose of this indicator is to provide a more comprehensive view of the RSI and aid in identifying trends, potential entry / exit points, and ranging conditions.
How it's Built.
The RSI:
The RSI is represented by its common line which you can turn on and off, as usual.
Japanese candlesticks:
In this indicator, are also Japanese candlesticks giving you their representation of the RSI. This provides a clearer visualization of the RSI movements across its Open, High, Low, and Close, unlike the OHLC of the Heiken Ashi candles in the Heiken Ashi Algo.
In addition to the RSI line and Japanese candles, there are two moving averages applied to the RSI value. For the purpose of keeping with my CoffeeShop theme, the High average line is the Honey Line and the Low average line is the Chai Line. The user can choose between Exponential Moving Average or Simple Moving average. These moving averages are calculated based on the high vs low values of the past RSI readings, with the high average acting as the leading line.
When the Honey line is above the Chai Line, it indicates an uptrend, whereas when the Honey Line is below the Chai Line, it suggests a downtrend.
If the price is moving up but the Honey line is still below the Chai line, you're technically still in a downtrend and you should trade this like a pullback.
Identifying Trends.
To identify short entries, you need to wait for the Japanese candles to open and close below the Honey line while the Honey line is below the Chai Line. Conversely, you wait for the Japanese candles to open and close above the Honey line while the Honey line is above the Chai Line. This confirmation helps in identifying potential reversal points.
Range Bound Market.
The indicator also incorporates a visual representation of a ranging area. The 60 and 40 levels of the RSI are visually differentiated to indicate this range. When the Japanese candles are opening and closing within this range and the RSI remains contained within these levels, it suggests that the price is likely in a ranging phase, and traders should wait for a breakout from this range before taking action.
In summary, this custom indicator provides a comprehensive view of the RSI oscillator by incorporating Japanese candlestick visuals, moving averages, and a visual representation of the ranging area. By analyzing these elements, traders can gain insights into trends, potential entry points, and ranging conditions in the market.
---------HOW TO TRADE-----------
LONGS AND SHORTS
An example on how to use this in a long trade is to wait for your moving averages to be high (yellow) over low (orange). For the purpose of the description in this indicator you're looking for the honey to be over the chai.
Even if the RSI and Japanese candles in the oscillator are falling, however the honey is above the Chai, you are still in an uptrend.
The positioning of the moving averages will always determine the direction of the overall price trend so in this position you're looking for long entries.
take a long position as an entry when the open and the close of the Japanese candle in the oscillator is above your honey line.
when you notice a bearish candle closing below the honey line in an uptrend position you can exit your trade.
Confluence for short trades would be just the opposite and using the moving averages in an upside down pattern. In other words the honey needs to be below the chai and your Japanese candle needs to be closing bearish however they open and the close of that candle needs to be below both of your moving averages. exit when you get a bullish candle closing in between the averages.
TRADING RANGES
Wait for your moving average to enter into the range bound 60/40 area as well as your Japanese candles to Wick above and below this area but not close above and below the area.
At this point you can mark off the high and the low of the range as it pertains to your price chart and start using your range trading strategy.

Crypto Trend IndicatorThe Crypto Trend Indicator is a trend-following indicator specifically designed to identify bullish and bearish trends in the price of Bitcoin, and other cryptocurrencies. This indicator doesn't provide explicit instructions on when to buy or sell, but rather offers an understanding of whether the trend is bullish or bearish. It's important to note that this indicator is only useful for trend trading.
The band is a visual representation of the 30-day and 60-day Exponential Moving Average (EMA). When the 30-day EMA is above the 60-day EMA, the trend is bullish and the band is green. When the 30-day EMA is below the 60-day EMA, the trend is bearish and the band is red. When the 30-day EMA starts to converge with the 60-day EMA, the trend is neutral and the band is grey.
The line is a visual representation of the 20-week Simple Moving Average (SMA) in the daily timeframe. "Bull" and "Bear" signals are generated when the 20-day EMA is either above or below the 20-week SMA, in conjunction with a bullish or bearish trend. When the band is green and the 20-day EMA is above the 20-week SMA, a “Bull” signal emerges. When the band is red and the 20-day EMA is below the 20-week SMA, a “Bear” signal emerges. The 20-week SMA can potentially also function as a leading indicator, as substantial price deviations from the SMA typically indicate an overextended market.
While this indicator has traditionally identified bullish and bearish trends in various cryptocurrency assets, past performance does not guarantee future results. Therefore, it is advisable to supplement this indicator with other technical tools. For instance, range-bound indicators can greatly improve the decision-making process when planning for entries and exits points.

RB_Dynamic_No_Trade_ZoneThis indicator provides dynamic range information to help traders identify when a value moves out of a certain zone. This can be useful in making trading decisions. When the value falls outside of the specified range, it may indicate a good time to enter or exit a trade

BUY/SELL + ADVANCE DECLINEThis script is a custom trading view indicator that helps to identify potential buy and sell signals based on the RSI (Relative Strength Index) and SMA (Simple Moving Average) indicators. The script also identifies potential reversals using a combination of RSI and price action. It plots buy, sell, and reversal signals on the chart along with an SMA line. Additionally, it provides alerts based on the buy, sell, and reversal conditions.
Changes made to the original script:
Fixed the undeclared identifier 'c' error by calculating the difference between the current closing price and the previous closing price: c = close - close .
Added an "ADD Value Floating Label" to the chart. The label shows the difference between the current and previous closing prices (ADD value) along with a "Bullish" or "Bearish" indicator based on the value of 'c'. The label is positioned at the top right of the visible chart area and remains static.
Here's a summary of the major components of the script:
Input settings: Define the input parameters for RSI and SMA.
Calculation of RSI and SMA: Compute the RSI and SMA values based on the input parameters.
Color definitions: Define colors for different conditions and levels.
Condition definitions: Define various conditions for buy, sell, reversal, and other criteria.
Buy and sell conditions: Determine buy and sell signals based on RSI, SMA, and price action.
Reversal conditions: Identify potential reversals using RSI and price action.
Plot signals: Display buy, sell, and reversal signals on the chart.
Bar colors: Color the bars based on the identified signals.
Plot SMA: Display the SMA line on the chart.
Alert conditions: Set up alerts for buy, sell, and reversal conditions.
ADD Value Floating Label: Add a label to the chart showing the ADD value and a "Bullish" or "Bearish" indicator.
