In den Scripts nach "macd" suchen

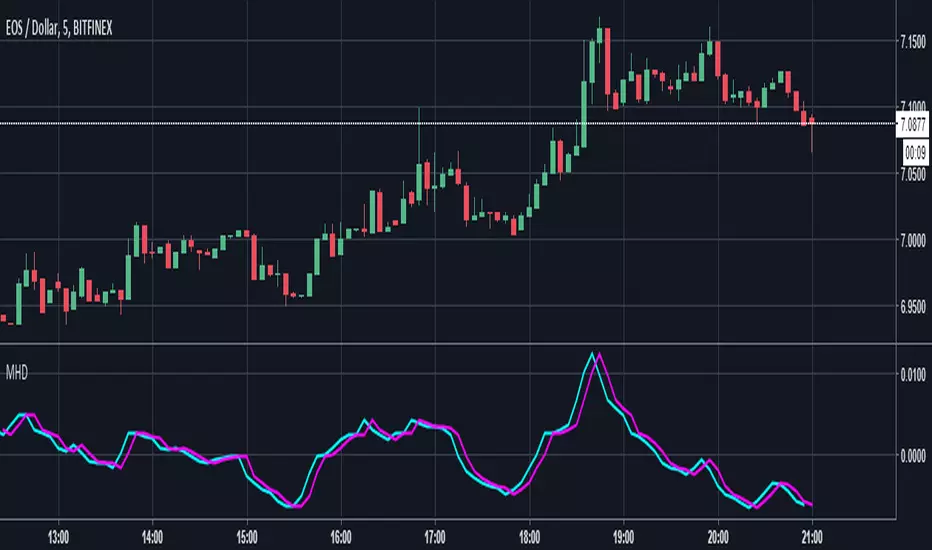
MACD Leader [ChuckBanger]MACD makes use of moving averages and therefor usually lags behind the price. It is possible to eliminate lag completely but the work around of this is usually by adding a component of the price/MA difference back to MA. This technique is called Zero-lag. It is not zero lag but it is close enough. "MACD Leader" makes use of this to form a leading signal to MACD.
First proposed by Giorgos E. Siligardos, "Leader" leads normal MACD , especially when significant trend changes are about to take place. This has the following features:
- It is similar to MACD in smoothness.
- It can be plotted along with MACD in the same window using the same scaling.
- It has the ability to lead MACD at critical situations
For detailed discussion on the various divergence patterns, refer to the PDF here: drive.google.com
This script provide an option to plot MACD and MACD leader signal on the same pane. You can enable/disable them how you want via options page. It also has the option to change to different MA types.
MACD 4C with DivergenceMACD 4C Indicator with Divergence
This indicator, named MACD 4C, enhances the traditional MACD (Moving Average Convergence Divergence) by providing a visually intuitive representation with four distinct colors for the histogram bars. It offers a clear interpretation of market momentum and potential trend reversals.
Key Features:
Customizable Parameters: Users can adjust the fast and slow moving average periods along with the signal smoothing parameter to tailor the indicator to their preferred trading style and market conditions.
Four-color Histogram: The histogram bars are color-coded for easy interpretation. Lime and green bars indicate increasing bullish momentum, while maroon and red bars signify increasing bearish momentum.
Bullish and Bearish Divergence Detection: The indicator identifies bullish and bearish divergences between the MACD histogram and price action. Bullish divergence occurs when the price makes a lower low while the MACD histogram forms a higher low, indicating potential bullish reversal. Conversely, bearish divergence occurs when the price makes a higher high while the MACD histogram forms a lower high, suggesting a potential bearish reversal.
How to Use:
Trend Confirmation: Monitor the color of the histogram bars. A series of green (or lime) bars suggests a strengthening bullish trend, while a series of red (or maroon) bars indicates a strengthening bearish trend.
Divergence Identification: Watch for divergences between the MACD histogram and price action. Bullish divergence may signal a potential bullish reversal, while bearish divergence may indicate a potential bearish reversal. These signals can be used in conjunction with other technical analysis tools to confirm trade entries and exits.
The MACD 4C indicator was developed by user vkno422 You can find the original author and their work on their TradingView profile: www.tradingview.com

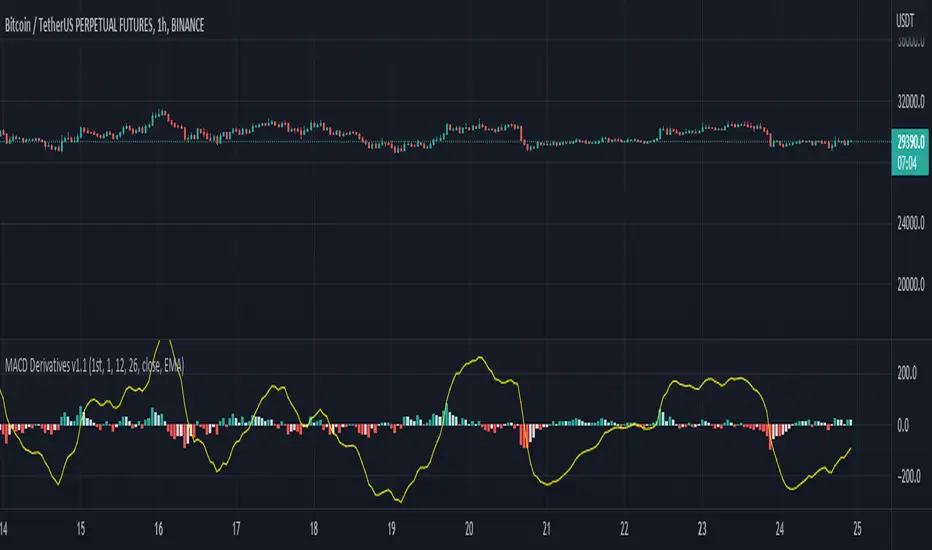
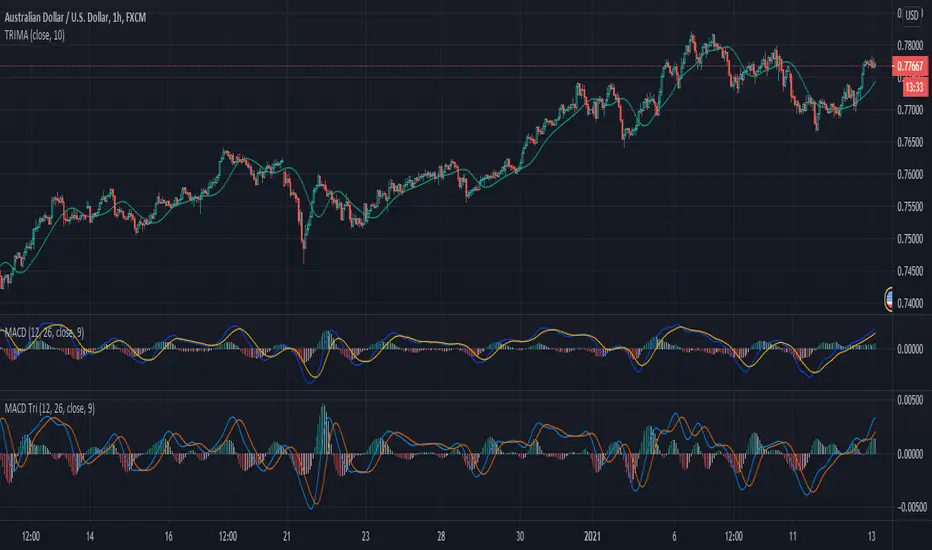
MACD DerivativesMACD Derivatives v1.1
Shows MACD value and derivative of MACD value in the histogram. The histogram shows 1st or 2nd order derivative as indicated in the settings. The derivative value represents the slope, the direction of change and change rate of the MACD value, aiming to give influence on possible trend turns on MACD value, ideally the possible direction change of MACD/price before the actual turn.
- 1st order derivative represents the increase or decrease of the MACD value, shown as positive or negative histogram value respectively;
- Similarly, 2nd order derivative represents the increase or decrease in the difference of the 1st order derivative value, represented via the histogram.
Both of the derivative functions are according to the value difference of n-th bar. The value n is customizable in the settings.
The indicator is based on the source code of built-in MACD indicator excluding the signal and the usual MACD histogram calculations, i.e. the signal is removed and the histogram shows the 1st or 2nd derivative of the MACD value.
For example: You can not get information about the future price via this indicator but some supportive information and visualization on the trend change such as "The uptrend is slowing down, and this slowing down is getting quicker."
Disclaimer: It is NOT recommended to open or close positions based solely on this indicator. The derivative value answers only one question, i.e. the change in last MACD value. Does not indicate any future value and I mean it.
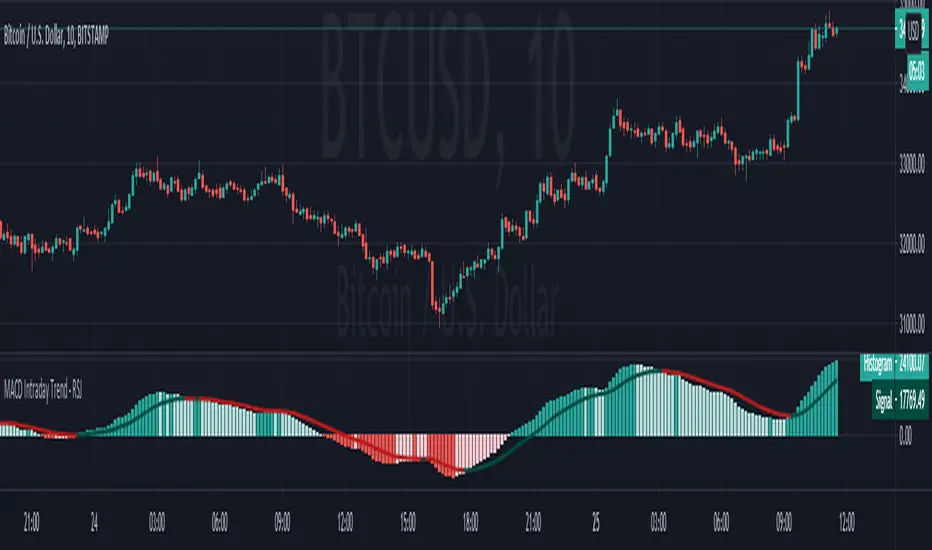
MACD Intraday Trend - RSJMACD Intraday Trend is an Indicator developed through an adaptation made of the original MACD created by Gerald Appel in the 1960s.
Through years of trading it was observed that by changing the parameters of the MACD with Fibonacci proportions we achieve a better presentation of the continuity of the trend movements, making that it is possible to more efficiently detect the beginning and end of a price trend.
Due to its efficiency in detecting price trends, it is also possible to identify very clearly the divergences of tops and bottoms, thus taking better advantage of trading opportunities.
-> Every time the histogram is positive and crosses the signal line down there is a high probability that an uptrend will end and a downtrend will start.
-> Every time the histogram is negative and crosses the signal line up there is a high probability of ending a downtrend and starting an uptrend.
The Indicator MACD Intraday Trend works with any currency pair, at any candlesticks timeframe and with Renko charts.
The Indicator has an amazing performance on Renko charts.
------------------------------------------------------------------------------------------------------------------------------------------------------------------------
MACD Intraday Trend é um Indicador desenvolvido através de uma adaptação feita do MACD original criado por Gerald Appel nos anos 1960.
Através de anos de trading foi observado que alterando os parâmetros do MACD com proporções de Fibonacci conseguimos uma melhor apresentação de continuidade dos movimentos de tendência, fazendo com que seja possível detectar de forma mais eficiente o início e fim de uma tendência de preços.
Devido sua eficiência em detecção de tendências de preços é possível também identificar com muita clareza as divergências de topos e fundos, desta forma aproveitando melhor as oportunidades de trading.
-> Toda vez que o histograma estiver positivo e cruzar a linha de sinal para baixo existe uma alta probabilidade de fim de uma tendência de alta e início de uma tendência de baixa.
-> Toda vez que o histograma estiver negativo e cruzar a linha de sinal para cima existe uma alta probabilidade de fim de uma tendência de baixa e início de uma tendência de alta.
O Indicador MACD Intraday Trend funciona com qualquer par de moedas, em qualquer tempos gráficos com candlesticks e gráficos do tipo Renko.
O Indicador tem uma performance surpreendente em gráficos do tipo Renko.
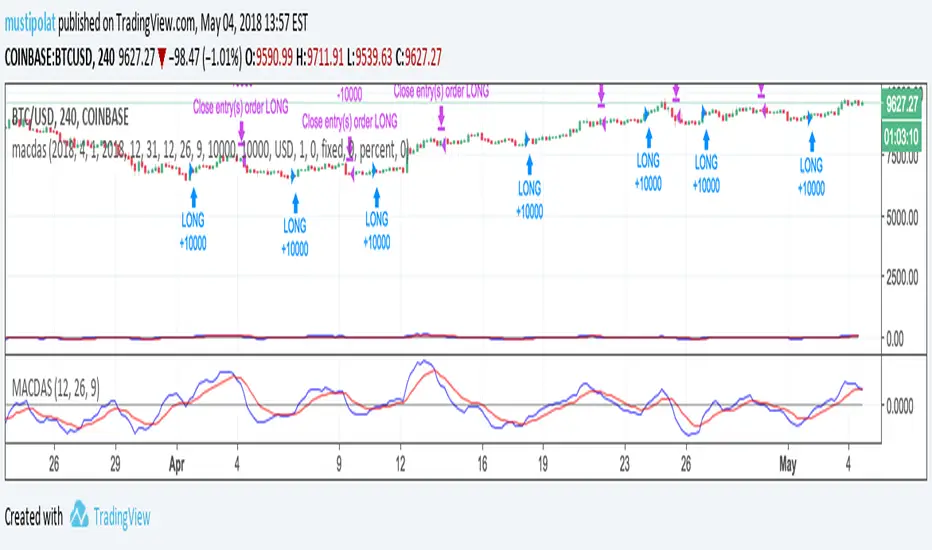
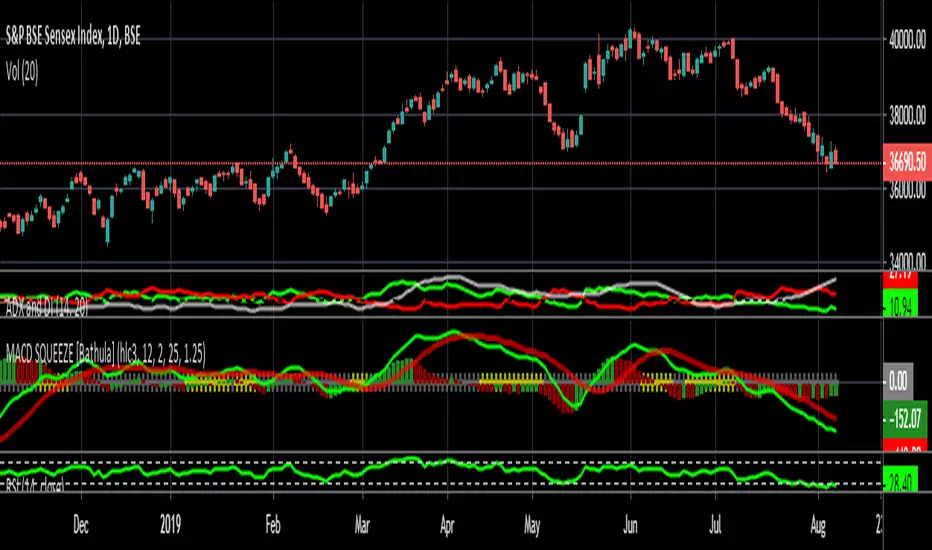
MACD Binary Strategy by Hashtag_binary MACD Binary Options Strategy is an trend momentum system, It's based on the double MACD in the sub window below the chart.
- Markets: Stocks, Indicies, Metals, Forex. This binary strategy works good on the Indicies ( S&P 500, DAX, FTSE, ).
- MACD Binary System il also good as trading system for to trade.
- Time Frame 30 min or higher ( best 4H).
- Expires Time 3 bars after. (90 min, 180 min, 720 min, 3 daily).
Rules MACD Binary Options Strategy
Buy Call:
- EMA 6 over EMA 13;
- MACD ( 5, 15, 1) crosses upward MACD ( 12,26,1 );
- MACD (5,15, 1) over level 0.
Buy Put:
- EMA 6 under EMA 13;
- MACD ( 5, 15, 1) crosses downward MACD ( 12,26,1 );
- MACD (5,15, 1) under level 0.
The same conditions for entry trade.
Exit position options:
- When MACD (5, 15, 1,) crosses in opposite direction MACD (12,26,1);
- When exponential moving average crosses in opposite direction;
- Make profit with ratio 1:3 stop loss.
- Initial stop loss at the previous swing.

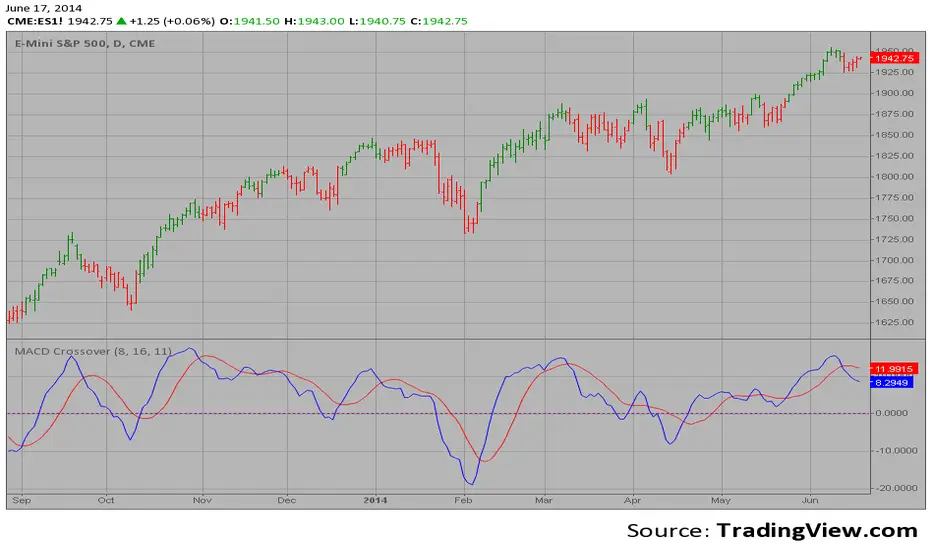
MACD Crossover Backtest MACD – Moving Average Convergence Divergence. The MACD is calculated
by subtracting a 26-day moving average of a security's price from a
12-day moving average of its price. The result is an indicator that
oscillates above and below zero. When the MACD is above zero, it means
the 12-day moving average is higher than the 26-day moving average.
This is bullish as it shows that current expectations (i.e., the 12-day
moving average) are more bullish than previous expectations (i.e., the
26-day average). This implies a bullish, or upward, shift in the supply/demand
lines. When the MACD falls below zero, it means that the 12-day moving average
is less than the 26-day moving average, implying a bearish shift in the
supply/demand lines.
A 9-day moving average of the MACD (not of the security's price) is usually
plotted on top of the MACD indicator. This line is referred to as the "signal"
line. The signal line anticipates the convergence of the two moving averages
(i.e., the movement of the MACD toward the zero line).
Let's consider the rational behind this technique. The MACD is the difference
between two moving averages of price. When the shorter-term moving average rises
above the longer-term moving average (i.e., the MACD rises above zero), it means
that investor expectations are becoming more bullish (i.e., there has been an
upward shift in the supply/demand lines). By plotting a 9-day moving average of
the MACD, we can see the changing of expectations (i.e., the shifting of the
supply/demand lines) as they occur.
You can change long to short in the Input Settings
WARNING:
- For purpose educate only
- This script to change bars colors.

MACD Crossover MACD – Moving Average Convergence Divergence. The MACD is calculated
by subtracting a 26-day moving average of a security's price from a
12-day moving average of its price. The result is an indicator that
oscillates above and below zero. When the MACD is above zero, it means
the 12-day moving average is higher than the 26-day moving average.
This is bullish as it shows that current expectations (i.e., the 12-day
moving average) are more bullish than previous expectations (i.e., the
26-day average). This implies a bullish, or upward, shift in the supply/demand
lines. When the MACD falls below zero, it means that the 12-day moving average
is less than the 26-day moving average, implying a bearish shift in the
supply/demand lines.
A 9-day moving average of the MACD (not of the security's price) is usually
plotted on top of the MACD indicator. This line is referred to as the "signal"
line. The signal line anticipates the convergence of the two moving averages
(i.e., the movement of the MACD toward the zero line).
Let's consider the rational behind this technique. The MACD is the difference
between two moving averages of price. When the shorter-term moving average rises
above the longer-term moving average (i.e., the MACD rises above zero), it means
that investor expectations are becoming more bullish (i.e., there has been an
upward shift in the supply/demand lines). By plotting a 9-day moving average of
the MACD, we can see the changing of expectations (i.e., the shifting of the
supply/demand lines) as they occur.
MACD-V+ (ATR Normalized MACD)MACD-V+ is an ATR-normalized MACD tool that focuses on true turning points inside Overbought/Oversold zones. It marks a signal only when the MACD’s slope changes direction and shows real progress back toward the zero line, with an optional dwell (depth & time) filter so you don’t get faked out by shallow pokes into a zone. Clean visuals, “first-in-zone” gating, and configurable labeling make it practical for discretionary and systematic traders alike.
For best results, adjust Overbought and Oversold levels based on stock volatility. The default settings of 150 and -150 are for highly volatile tickers. Reduce for less volatile tickers.
Please help me improve the code for everyone.

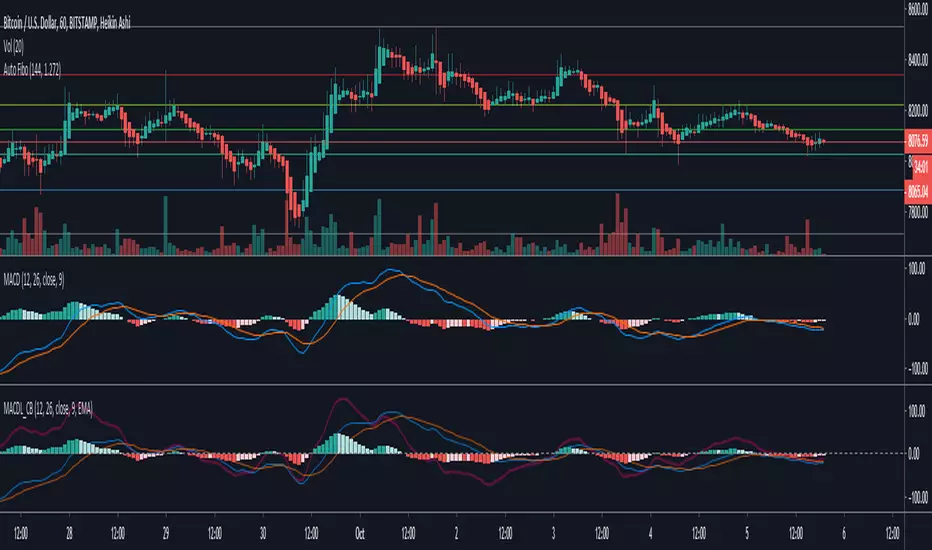
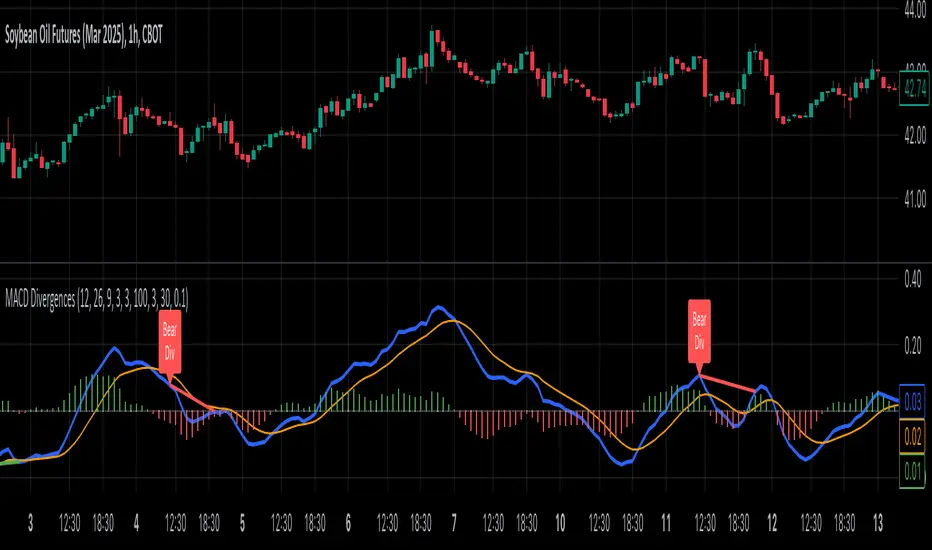
MACD Divergence all in oneMACD Divergence all in one
It can also be named as MACD dual divergence detector pro !
A sophisticated yet user-friendly tool designed to identify both bullish and bearish divergences using the MACD (Moving Average Convergence Divergence) indicator. This advanced script helps traders spot potential trend reversals by detecting hidden momentum shifts in the market, offering a comprehensive solution for divergence trading.
🎯 Key Features:
• Automatic detection of bullish and bearish divergences
• Clear visual signals with color-coded lines (Green for bullish, Red for bearish)
• Smart filtering system to eliminate false signals
• Customizable parameters to match your trading style
• Clean, uncluttered chart presentation
• Optimized performance for real-time analysis
• Easy-to-read labels showing divergence types
• Built-in signal spacing to avoid clustering
📊 How it works:
The indicator uses an advanced algorithm to analyze the relationship between price action and MACD momentum to identify:
Bullish Divergences:
- Price makes higher lows while MACD shows lower lows
- Signals potential trend reversal from bearish to bullish
- Marked with green lines and upward labels
Bearish Divergences:
- Price makes lower highs while MACD shows higher highs
- Signals potential trend reversal from bullish to bearish
- Marked with red lines and downward labels
⚙️ Customizable Settings:
1. MACD Parameters:
- Fast Length (default: 12)
- Slow Length (default: 26)
- Signal Length (default: 9)
2. Divergence Detection:
- Left/Right Pivot Bars
- Divergence Lookback Period
- Minimum/Maximum Divergence Length
- Divergence Strength Filter
3. Visual Settings:
- Clear color coding for easy identification
- Adjustable line thickness
- Customizable label size
💡 Best Practices:
- Most effective on higher timeframes (1H, 4H, Daily)
- Combine with support/resistance levels
- Use with trend lines and price action
- Consider volume confirmation
- Best results during trending markets
- Use appropriate stop-loss levels
🎓 Trading Tips:
1. Look for bullish divergences near support levels
2. Watch for bearish divergences near resistance zones
3. Confirm signals with other technical indicators
4. Consider market context and overall trend
5. Use proper position sizing and risk management
⚠️ Important Notes:
- Past performance doesn't guarantee future results
- Always use proper risk management
- Test settings on historical data first
- Different timeframes may require parameter adjustments
- Not all divergences lead to reversals
Created by: Anmol-max-star
Last Updated: 2025-02-25 16:15:08 UTC
📌 Regular updates and improvements planned!
Disclaimer:
This indicator is for informational purposes only. Always conduct your own analysis and use proper risk management techniques. Trading involves risk of loss, and past performance does not guarantee future results.
🤝 Support:
Feel free to leave comments for:
- Suggestions
- Improvements
- Feature requests
- Bug reports
- General feedback
Your feedback helps make this tool better for everyone!
Happy Trading and May the Trends Be With You! 📈
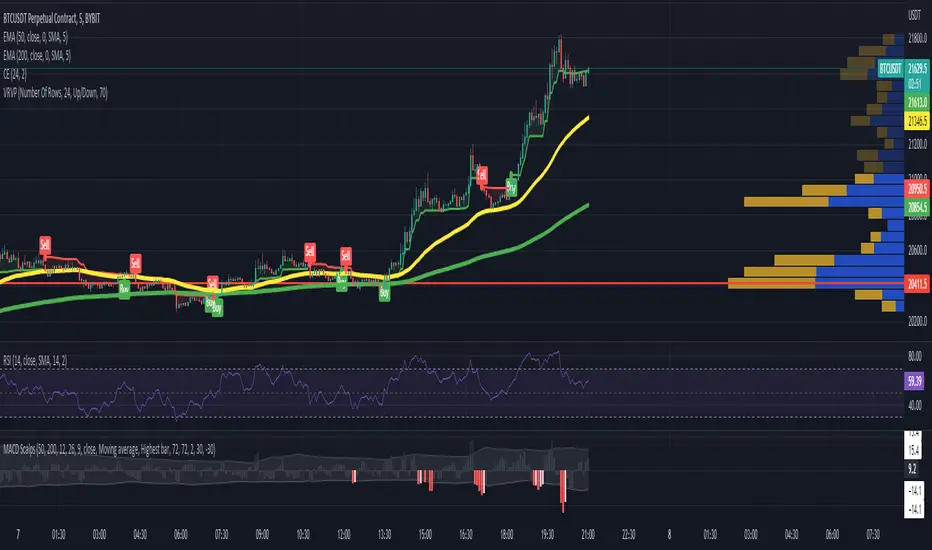
MACD ScalpsMACD Scalping
50 EMA crosses below 200 EMA = Only shorts
50 EMA crosses above 200 EMA = Only longs
For longs: -> Enter on red MACD bar
For shorts: -> Enter on green MACD bar
Bars not big enough or that do not follow the EMA rule are greyed out.
MACD Bar 1.0 [upslidedown]MACD is one of the most consistent ways a trader can determine overall trend direction. In this script, I've simplified the traditional MACD histogram into a compact bar with trend change shapes (▲▼) when the MACD histogram goes under the zero line or above the zero line. With traditional MACD I often have to zoom in, wasting precious time. This indicator fixes that problem.
I use this script as a confirmation for other trigger signals, not as an entry or exit signal. I find this compact widget to be a preferable visualization of MACD on lower timeframes, while high timeframe analysis lends itself to the traditional MACD built-in with more data for decision making. This is also very useful when crafting trading strategies to quickly check for confluence of signals.
In addition to the traditional EMA smoothing that comes with MACD, I exposed a series of common moving average types. These include: SMA, EMA, WMA, RMA, SWMA, VWMA, Hull, TEMA, and ZLEMA. TEMA and ZLEMA are not standard builtins, but when looking for fast confirmation they can be very useful. They can also create LOTS of noise, so consider this wisely before changing the builtin methodology. One neat trick is to pair a "fast" version of this with fast moving average type and then a slow one using traditional EMA.
▲▼ signals = trend shift in direction of triangle
full color "bull or bear" color = strong trend
half color (semi-transparent) "bull or bear" color = weakening trend

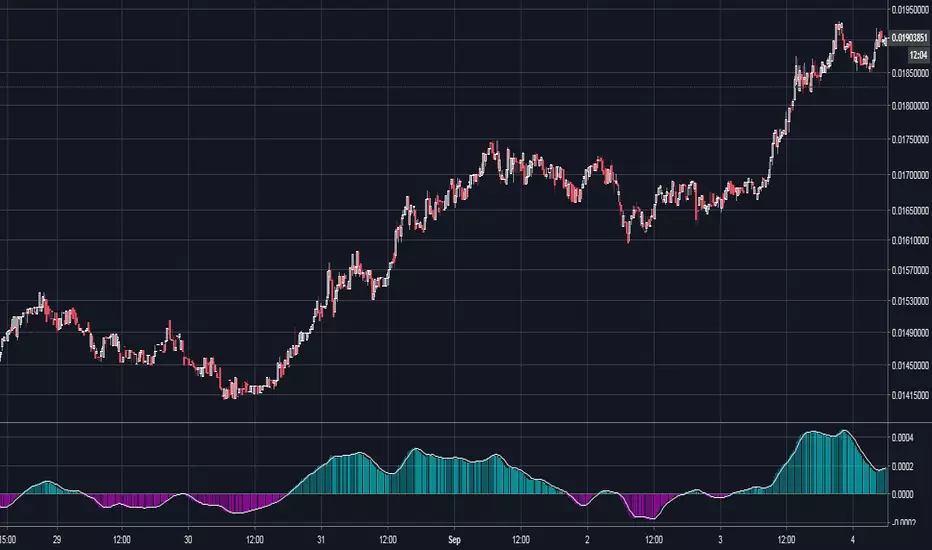
MACD OverlayMACD Overlay indicator plots the MACD directly on price. This helps you better understand the MACD indicator and filter the false signals.


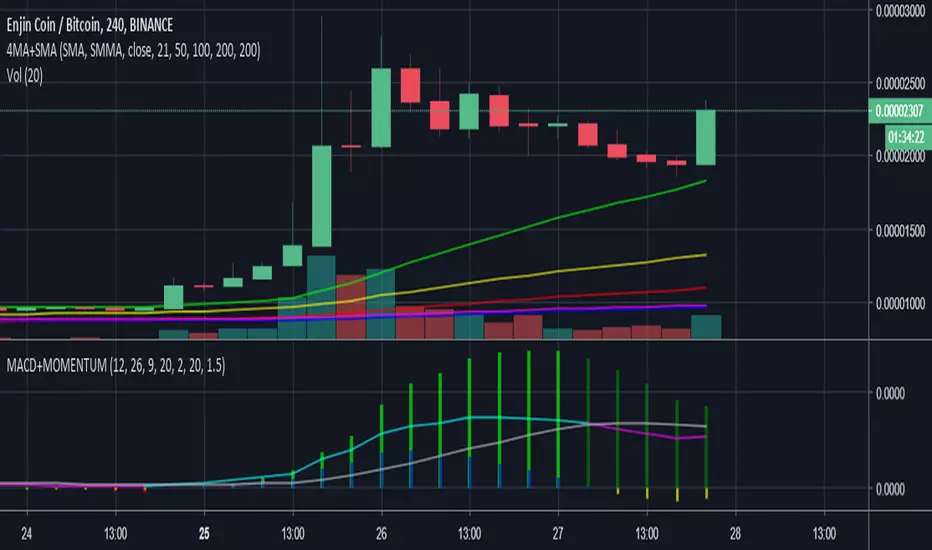
MACD QLEMACMACD, short for moving average convergence/divergence, is a trading indicator used in technical analysis. It is supposed to reveal changes in the strength, direction, momentum, and duration of a trend!
The setting by default is to smooth the indicator for better trading.
Enjoy!
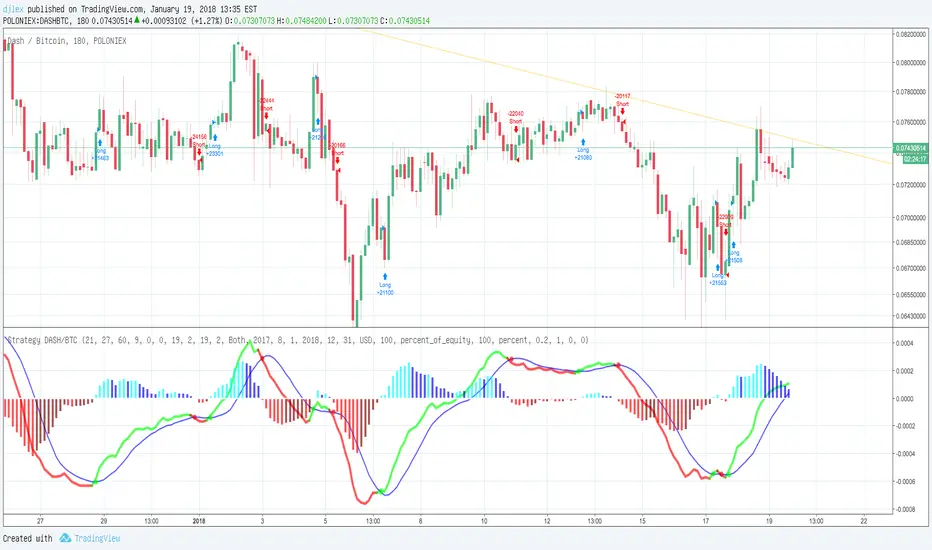
MACD Strategy V2.0 DASH/BTC 3H
MACD STRATEGY Calculate for DASH/BTC 3H with 100 Dollar and FEE? s (0.2%)
Autoview qualified Study Script
For Margin Trading (Poloniex)
ULTIMATE PINE INJECTOR V1.2 INSERT
MACD Created by user ChrisMoody
NO REPAINT
With Stopp Loss and Trailing Stopp and Backtest
6 Mon = 600%