MACD + RSI Robert's VersionCombination of MACD and RSI to see how they work together, its meant for any market and any condition
In den Scripts nach "macd" suchen

MACD AND SMA COMBINATION StrategyHello Everyone This Strategy Base on MACD AND SMA COMBINATION
By Default 3 Percentage TP AND 1 Percentage Sl & quantity 500
By Default Backtesting Starting Time 1 Jan 2020 and end time 31 Dec 2020
You Can also change everything.
In future, I will Enhance this Strategy
if you have any suggestion Mention There Thank you so much
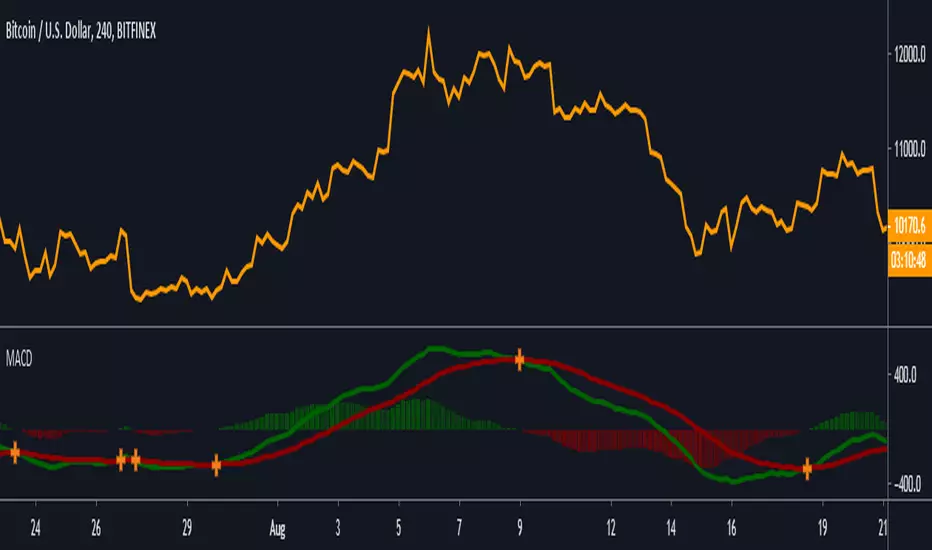
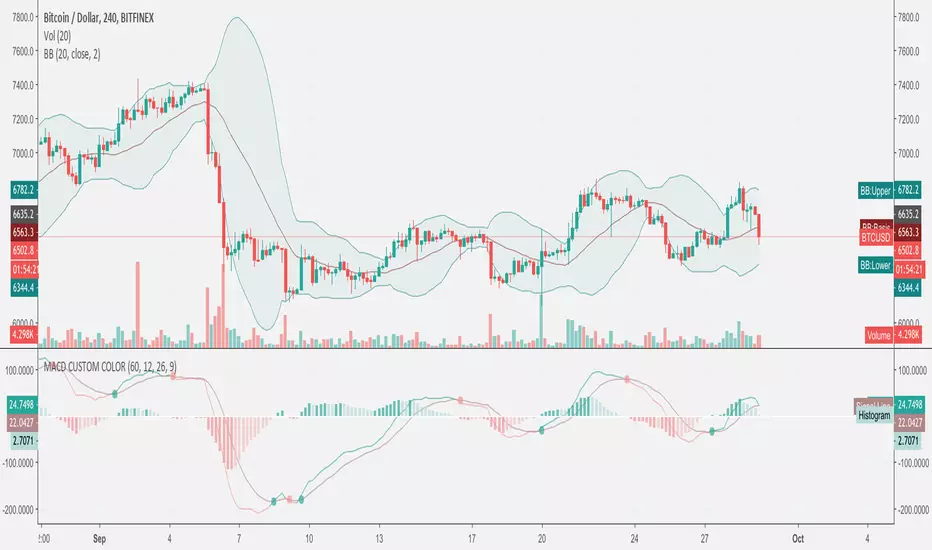
MACD & Mayer multpile Crypto-EmbassyThis is a combination of two indicators MACD & The Mayer Multiple.
MACD = Short for moving average convergence/divergence. It is designed to reveal changes in the strength, direction, momentum, and duration of a trend in a stock's price.
You will find the normal histogram and also a generated trend line (green = bullish , red = bearish )
The Mayer Multiple = The Mayer Multiple was created by Trace Mayer as a way to analyse the price of Bitcoin in a historical context. The Mayer Multiple is the multiple of the current price over the 200-days moving average.
"It does NOT tell whether to buy, sell or hold" but it gives you a pretty good idea of where we are at.
Basically
🔵Blue = Please buy🙏
🟢Light green = Looking for good entries 👀
🟢Green = Buy if you wish
🟡Yellow = This is starting to take off
🟠Orange = Looking for good exit 👀
🔴Red = You should get out of this
🔴Dark Red = You have balls, now please sell🙏

MACD 4H StrategyThis strategy is a basic example of using MACD AND the instrument must be found an appropriate timeframe (4H recommended) before being tested with.

MACD Indikator v1If you make a loss, I am not responsible for it. Please use this with caution.
==================================================================================================================================================
MACD - Strategy
Considering cross the lines and Top / Buttoms.
==================================================================================================================================================
Do realize that the indicator is not 100% accurate and please use this with caution. Please read the disclaimer below before using this indicator or the services (Telegram/ Twitter , Trading View etc.) services associated with this indicator:
Disclaimer:
No Investment Advice Provided
Any opinions, chats, messages, news, research, analyses, prices, or other information contained here are provided as general information for educational and entertainment purposes only and do not constitute investment advice. My bullshit statements should not be relied upon as a substitute for an extensive independent market research before making your actual trading decisions. Opinions, market data, recommendations or any other content is subject to change at any time without notice. I will not accept liability for any loss or damage, including without limitation any loss of profit, which may arise directly or indirectly from use of or reliance on such information.
I do not recommend the use of technical analysis or any analysis as a sole means of trading decisions. I do not recommend making hurried trading decisions. I have no clue about PAST PERFORMANCE or any INDICATIVE FUTURE RESULTS.
THE script and its associated services ARE PROVIDED "AS IS", WITHOUT WARRANTY OF ANY KIND, EXPRESS OR IMPLIED, INCLUDING BUT NOT LIMITED TO THE WARRANTIES OF MERCHANTABILITY, FITNESS FOR A PARTICULAR PURPOSE AND NONINFRINGEMENT. IN NO EVENT SHALL THE AUTHORS OR COPYRIGHT HOLDERS BE LIABLE FOR ANY CLAIM, DAMAGES OR OTHER LIABILITY, WHETHER IN AN ACTION OF CONTRACT, TORT OR OTHERWISE, ARISING FROM, OUT OF OR IN CONNECTION WITH THE SOFTWARE OR THE USE OR OTHER DEALINGS IN THE SOFTWARE, WEBSITE, SCRIPT, SIGNALS.

MACD Strategy by SedkurThis gives to you buy-sell signal with MACD histogram value.
Use "Fast and Slow length" and "Buy or Sell Histogram Value" inputs to take less or more signal.

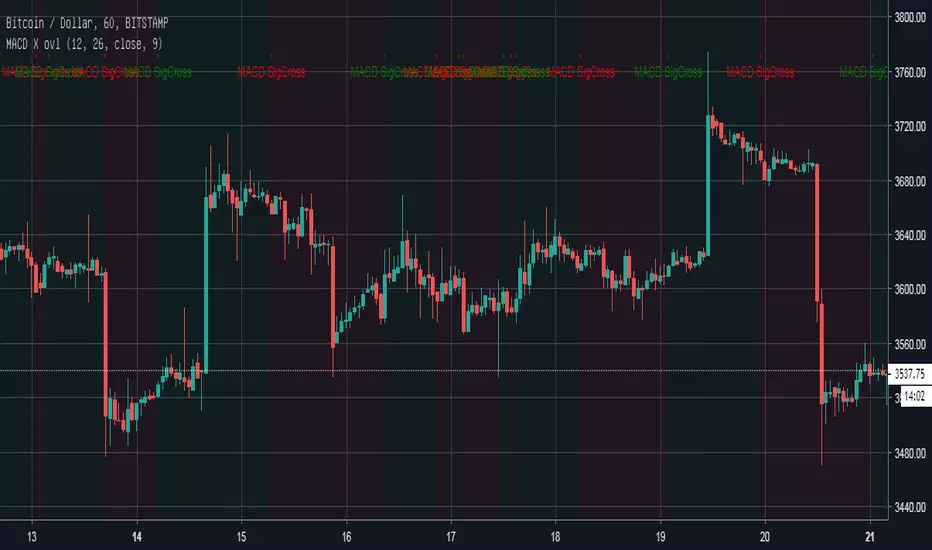
MACD [Gu5]Extremely popular indicator MACD (Moving Average Convergence/Divergence)
Same design of my previous indicators
Show Cross Line for a better visualization
```
Setting recommended for BTC
"Fast Length" = 21
"Slow Length" = 55
"Signal Smoothing" = 14
Other markets try
"Fast Length" = 12
"Slow Length" = 26
"Signal Smoothing" = 9
```
--
El MACD (Convergencia/Divergencia de Medias Móviles) es uno de los mas populares indicadores
Continuando con el mismo estilo de diseño de mis anteriores indicadores
Destaca el cruce de medias para una mejor visualización
MACD phi³Esse script possui 6 MACD configurados com o Phi³ e um sistema para encontrar as divergências em cada linha sendo impresso na vela o H1, H2, H3, H4, H5 e H6, os tempos de 17 velas até 610, já ajustado para mostrar em 72 minutos, pode por em qualquer tempo, mas tempos menores ele irá duplicar a impressão dos dados, ex: se por em 17 ou 15 minutos, irá aparecer 4 velas com os avisos, pois irá dividir o tempo.
Foi testado com o BTCUSD, não sei a eficiência com outras moedas, fiquem a vontade pra comentar e criticar.
OBS: Não me responsabilizo por eventuais falhas do script ou perdas, é uma ferramenta em fase de teste.

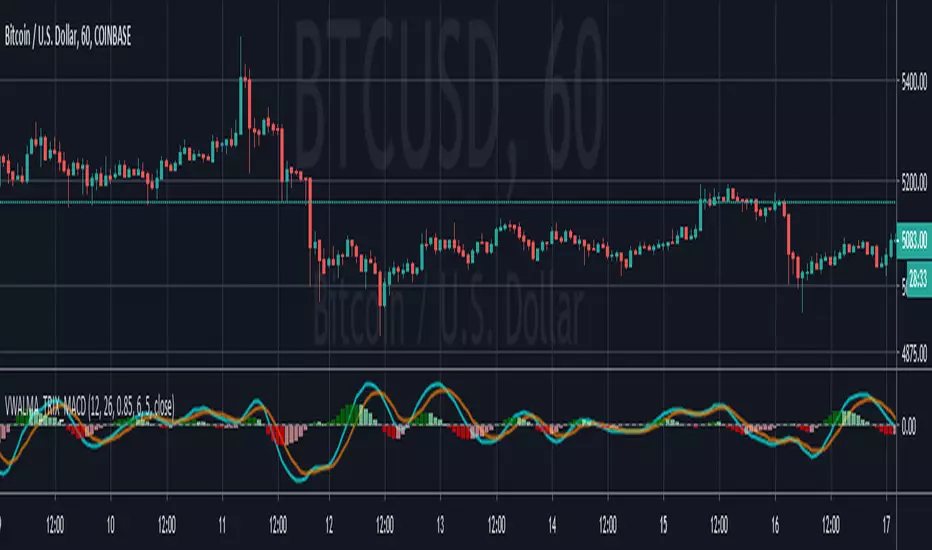
Volume Weighted ALMA TRIX MACDMACD constructed using volume weighted(optional) ALMA TRX
---------------------------------------
If you find it useful please consider a tip/donation :
BTC - 3BMEXEDyWJ58eXUEALYPadbn1wwWKmf6sA
MACD RVI [Le Soleil]Recalculation MACD with RVI. This application provides better results than combination of moving averages, MACD, RVI.


DiNapoli MACD PredictorMACD Predictor is a useful indicator that paints dynamic support and resistance levels which are unknown to most of traders.
This version of the indicator includes the following options:
Price Projection of Next Candle
Stop Grabbers visual indication
Short Line mode to declutter the chart
Normal/Dark mode
Visual labelling of the line
Thickness of the lines
This indicator is meant to be used by a private group of traders.


MACD (Moving Average Convergence/Divergence) + Inside BarMACD (Moving Average Convergence/Divergence) + Inside Bar so that free users can have two things in same indicator.
Script is open for everyone.
Check and test the code of Inside Bar and let me know if it is correct.
Feel feel to share.

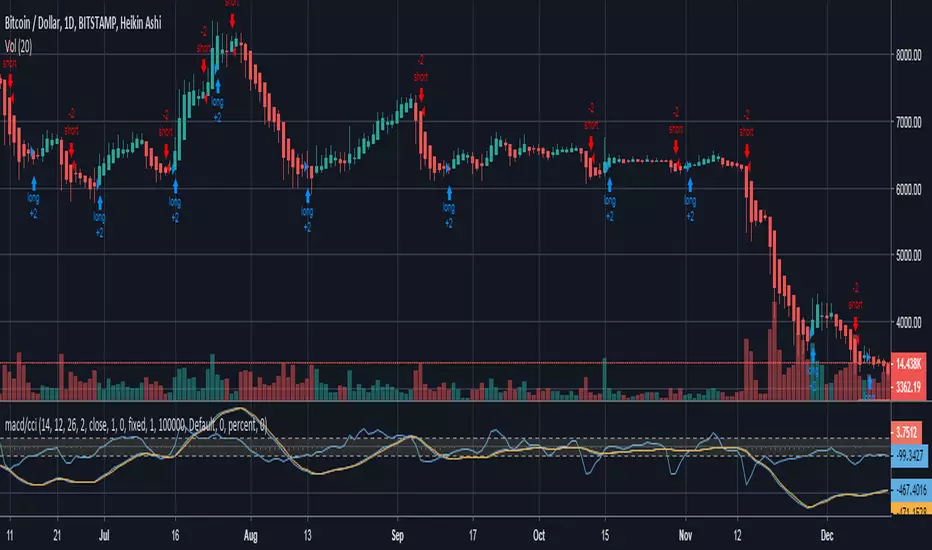
MACD+CCI Strategya simple strategy based on Joseph Nemeth MACD+CCI strategy
Reference reading: sites.google.com
MACD CrossOver/CrossUnder Alert ScriptThe script let you know when to sell or buy around MACD indicator.

MACD for Buy & Sell signal indicatorMACD for Buy & Sell signal indicator last part of Buy and sell signal set. It was coded base on CCI source. Allow trader can read volume trade on market
1 set buy and sell signal
1- Buy & Sell signal indicator
2- RSI for Buy & Sell signal indicator
3- MACD for Buy & Sell signal indicator
*********************************************************************************************************************
Gửi anh chị trader đây là chỉ báo cuối cùng trong bộ chỉ báo tín hiệu mua bán. Là chỉ báo điều kiện sử dụng cùng với chỉ báo RSI để giúp cho nhà đầu tư đưa ra quyết định kịp thời dựa trên tổng số khối lượng gd thời điểm hiện tại


MACD Buy & Sell signalOverlayed MACD indicator shows Buy or Sell signal.
It indicates Pumping or Strong Buy signal when comparing to another time frame.
Example. 1hr time frame and 8hr(4hr) time frame in the vertical(horizontal) layout on TradingView.
MACD 지표에 따라서, 매수 / 매도 시그널을 보여줍니다.
1시간봉 및 8시간(4시간) 봉을 동시에 비교하면서 사용하세요.
레이아웃 고르기에서 수평 또는 수직으로 2등분하여 비교하시면 사용이 쉽습니다.

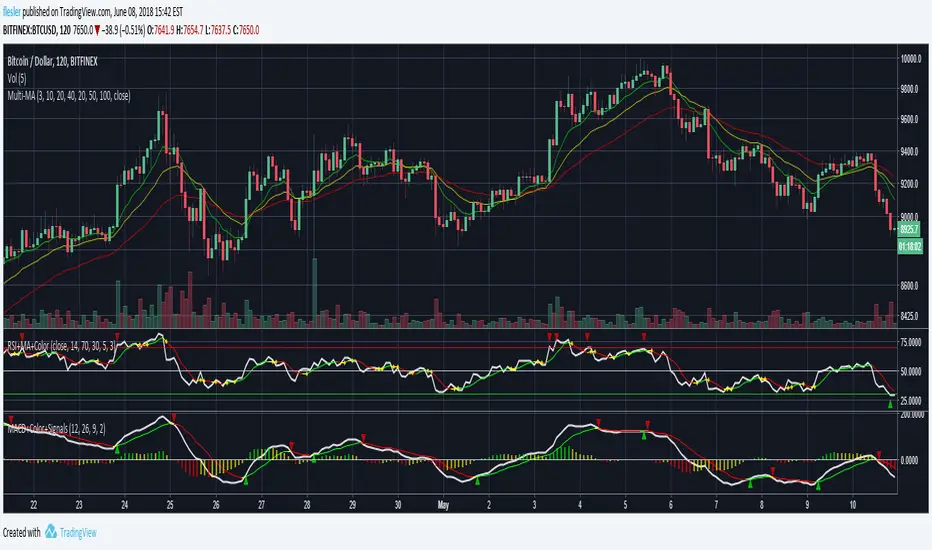
MACD + Colors + Signals
Standard MACD with signal and histogram
MACD and signal crossovers are marked with up/down triangles
Signal is colored based on its direction, can be turned to a single color
Histograms can be green, red and yellow based on their side and direction
Histograms can be switch to be green when positive and red when negative