DIY Custom Strategy Builder [ZP] - v1DISCLAIMER:
This indicator as my first ever Tradingview indicator, has been developed for my personal trading analysis, consolidating various powerful indicators that I frequently use. A number of the embedded indicators within this tool are the creations of esteemed Pine Script developers from the TradingView community. In recognition of their contributions, the names of these developers will be prominently displayed alongside the respective indicator names. My selection of these indicators is rooted in my own experience and reflects those that have proven most effective for me. Please note that the past performance of any trading system or methodology is not necessarily indicative of future results. Always conduct your own research and due diligence before using any indicator or tool.
===========================================================================
Introducing the ultimate all-in-one DIY strategy builder indicator, With over 30+ famous indicators (some with custom configuration/settings) indicators included, you now have the power to mix and match to create your own custom strategy for shorter time or longer time frames depending on your trading style. Say goodbye to cluttered charts and manual/visual confirmation of multiple indicators and hello to endless possibilities with this indicator.
What it does
==================
This indicator basically help users to do 2 things:
1) Strategy Builder
With more than 30 indicators available, you can select any combination you prefer and the indicator will generate buy and sell signals accordingly. Alternative to the time-consuming process of manually confirming signals from multiple indicators! This indicator streamlines the process by automatically printing buy and sell signals based on your chosen combination of indicators. No more staring at the screen for hours on end, simply set up alerts and let the indicator do the work for you.
Available indicators that you can choose to build your strategy, are coded to seamlessly print the BUY and SELL signal upon confirmation of all selected indicators:
EMA Filter
2 EMA Cross
3 EMA Cross
Range Filter (Guikroth)
SuperTrend
Ichimoku Cloud
SuperIchi (LuxAlgo)
B-Xtrender (QuantTherapy)
Bull Bear Power Trend (Dreadblitz)
VWAP
BB Oscillator (Veryfid)
Trend Meter (Lij_MC)
Chandelier Exit (Everget)
CCI
Awesome Oscillator
DMI ( Adx )
Parabolic SAR
Waddah Attar Explosion (Shayankm)
Volatility Oscillator (Veryfid)
Damiani Volatility ( DV ) (RichardoSantos)
Stochastic
RSI
MACD
SSL Channel (ErwinBeckers)
Schaff Trend Cycle ( STC ) (LazyBear)
Chaikin Money Flow
Volume
Wolfpack Id (Darrellfischer1)
QQE Mod (Mihkhel00)
Hull Suite (Insilico)
Vortex Indicator
2) Overlay Indicators
Access the full potential of this indicator using the SWITCH BOARD section! Here, you have the ability to turn on and plot up to 14 of the included indicators on your chart. Simply select from the following options:
EMA
Support/Resistance (HeWhoMustNotBeNamed)
Supply/ Demand Zone ( SMC ) (Pmgjiv)
Parabolic SAR
Ichimoku Cloud
Superichi (LuxAlgo)
SuperTrend
Range Filter (Guikroth)
Average True Range (ATR)
VWAP
Schaff Trend Cycle ( STC ) (LazyBear)
PVSRA (TradersReality)
Liquidity Zone/Vector Candle Zone (TradersReality)
Market Sessions (Aurocks_AIF)
How it does it
==================
To explain how this indictor generate signal or does what it does, its best to put in points.
I have coded the strategy for each of the indicator, for some of the indicator you will see the option to choose strategy variation, these variants are either famous among the traders or its the ones I found more accurate based on my usage. By coding the strategy I will have the BUY and SELL signal generated by each indicator in the backend.
Next, the indicator will identify your selected LEADING INDICATOR and the CONFIRMATION INDICATOR(s).
On each candle close, the indicator will check if the selected LEADING INDICATOR generates signal (long or short).
Once the leading indicator generates the signal, then the indicator will scan each of the selected CONFIRMATION INDICATORS on candle close to check if any of the CONFIRMATION INDICATOR generated signal (long or short).
Until this point, all the process is happening in the backend, the indicator will print LONG or SHORT signal on the chart ONLY if LEADING INDICATOR and all the selected CONFIRMATION INDICATORS generates signal on candle close. example for long signal, the LEADING INDICATOR and all selected CONFIRMATION INDICATORS must print long signal.
The dashboard table will show your selected LEADING and CONFIRMATION INDICATORS and if LEADING or the CONFIRMATION INDICATORS have generated signal. Signal generated by LEADING and CONFIRMATION indicator whether long or short, is indicated by tick icon ✔. and if any of the selected CONFIRMATION or LEADING indicator does not generate signal on candle close, it will be indicated with cross symbol ✖.
how to use this indicator
==============================
Using the indicator is pretty simple, but it depends on your goal, whether you want to use it for overlaying the available indicators or using it to build your strategy or for both.
To use for Building your strategy: Select your LEADING INDICATOR, and then select your CONFIRMATION INDICATOR(s). if on candle close all the indicators generate signal, then this indicator will print SHORT or LONG signal on the chart for your entry. There are plenty of indicators you can use to build your strategy, some indicators are best for longer time frame setups while others are responsive indicators that are best for short time frame.
To use for overlaying the indicators: Open the setting of this indicator and scroll to the SWITCHBOARD section, from there you can select which indicator you want to plot on the chart.
For each of the listed indicators, you have the flexibility to customize the settings and configurations to suit your preferences. simply open indicator setting and scroll down, you will find configuration for each of the indicators used.
I will also release the Strategy Backtester for this indicator soon.
In den Scripts nach "backtest" suchen

[blackcat] L2 Zero Lag Hull Moving AverageZero Lag Hull Moving Average (ZLHMA) is a technical indicator that is based on the principles of Zero Lag Hull Moving Average (HMA). It is designed to provide a smoother and more accurate representation of price trends by reducing lag and improving the responsiveness of the moving average line.
Compared to traditional moving average lines, the Zero Lag Hull Moving Average has the advantage of being able to capture price trend changes more precisely. It achieves this by utilizing a higher degree of smoothness through the use of weighted moving averages, and by incorporating the calculation method of Hull Moving Average (HMA) to further eliminate lag.
The calculation process of the Zero Lag Hull Moving Average involves two main steps. First, the Hull Moving Average (HMA) is calculated by taking the difference between two weighted moving averages applied to the price data. This helps to smooth out the price fluctuations and reduce lag. Then, the difference between two weighted moving averages is applied once again to the HMA, resulting in the Zero Lag Hull Moving Average. This final step further enhances the accuracy and timeliness of the indicator.
The Zero Lag Hull Moving Average offers several advantages for traders. Firstly, it provides a quicker response to changes in price trends, allowing traders to make more timely and informed trading decisions. This can be particularly useful in fast-moving markets where speed is crucial. Secondly, by reducing lag, the Zero Lag Hull Moving Average helps traders avoid missing important market signals and potential trading opportunities. It provides a more accurate representation of the current market conditions, enabling traders to act with greater confidence.
However, it is important to note that the Zero Lag Hull Moving Average should not be used as the sole basis for making trading decisions. It is recommended to consider other technical indicators, as well as fundamental and market analysis, to gain a comprehensive understanding of the market dynamics. Traders should also conduct thorough backtesting and validation of their trading strategies to ensure their effectiveness.
In conclusion, the Zero Lag Hull Moving Average is a powerful tool that can enhance the accuracy and responsiveness of technical analysis. By reducing lag and providing a more accurate representation of price trends, it can assist traders in making better-informed trading decisions. However, it should be used in conjunction with other indicators and analysis methods for a comprehensive approach to trading.
Please note that the information provided by blackcat1402 is for educational purposes only and should not be considered as financial advice. It is essential to conduct thorough research, backtesting, and validation before implementing any trading strategies.

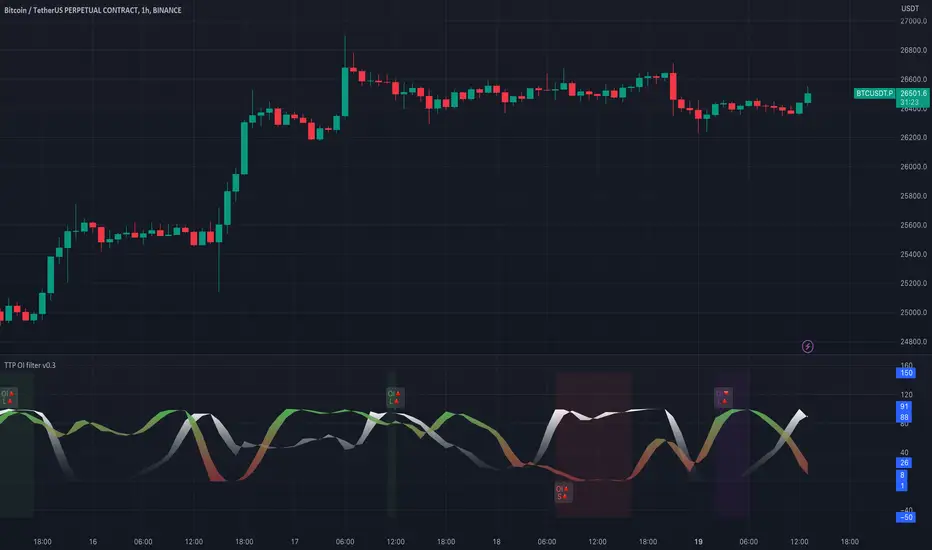
TTP OI + LS signal filterThis oscillator helps filtering specific conditions in the market based on open interest (OI) and the ratio of longs and shorts (LS) for crypto assets.
Currently it works with BINANCE:BTCUSDT.P but soon I'll be adding support for more assets.
It flags areas of interest like:
- Too many longs, too many shorts in the market
- Open interest too high or too low
It accepts an external signal as a source in which case filters can be applied to the original signal. For example the external signal might trigger and plot a 1 when RSI break below 70. By connecting such signal with this oscillator you'll be able to only pass-through the ones that occur when any of the areas of interest mentioned above are also valid.
If both filter are applied it acts as an OR. For example, if too many longs and too many shorts are active, it will pass through the signal in either condition.
The results of the original signal filtered is printed to be able to later use it in any external backtester strategy that accepts external sources too.
If external source signal is disabled it will trigger any time the combined filters are returning true.
Open interest and the ratio of longs/shorts is considered too high whenever the stochastic RSI calculation of the OI or ratio LS reaches a level above 80 and too low when below 20
The ratio of long/shorts is calculated by dividing the ratio of longs vs shorts from BITFINEX:BTCUSDLONGS and BITFINEX:BTCUSDSHORTS
market sessions by sellstreetIndicator of trading sessions:
Indicator created to track the opening of trading sessions:
Asia, Frankfurt, London, New York.
Tracking the opening of these key levels
- Day Opening (DO), Week Opening (WO), Month Opening (MO).
- New York (NYM) openings display.
- Highs and lows of the previous day (PDH/PDL).
- Day of the week display.
- Formation of the Сentral Bank Dealers Range (CBDR).
Indicator settings.
The open source code will help traders to understand the technical part of the script.
Flexible visual and technical setup of the indicator:
- Ability to enable/disable the display of trading sessions on the history.
- Enabling/disabling the display of the key opening levels on the chart history for a convenient backtest.
- Automatically switch to summer/winter time.
To use this indicator, add it to your favorites after the chart
TradingView must be overloaded to work correctly.

Divergences in 52 Week Moving Averages, Adjusted and SmoothedThis script description is intended to be holistic and comprehensive for the understanding of the interested parties who view the script.
Following the PineCoders suggestions, I have provided detailed breakdowns both within the code and in the description immediately below:
► Description
This description is intended to be detailed and meaningful, conveying the understanding of the script’s intention to the user:
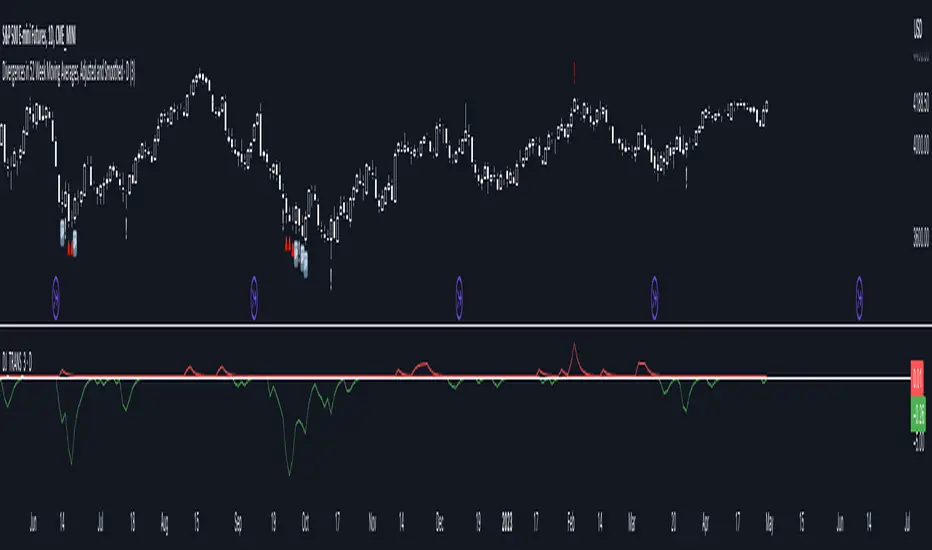
The theory: Divergences and extreme readings in 52-Week highs on major indexes can provide a view into a potential pending move in the opposite direction of how the market has been trending. By comparing the 52-Week Hi/Lo indices and applying an Exponential Moving Average (EMA), we can assess how extreme a move is from the average. If the move provides an extreme reading, it would potentially be beneficial to “fade” the move (take a position in the opposing direction).
The intention: The intentionality of this script is to provide a visualization of when the highly-probable opportunity to fade over a multi-day or multi-week period arises. In addition to this, based on backtesting prior moves and reading the various levels of significant reversals, three tiers: “Standard”, “Sensitive”, and “Highly Sensitive” have been applied, the user can choose which sensitivity level they would like to see, there are far less false positives on the Standard and Sensitive settings, while Highly Sensitive often signals multiple times with the move coming a few days later.
The application: The settings allow the user to customize their sensitivity to the fade signals, with the ability to customize the visual that shows up as well. For higher-highs that are fade-worthy, the signal will appear on the top of the candle, for lower-lows that are fade-worthy, the signal will appear on the bottom of the candle. The users risk criteria should be the primary driver of the entry/exit, although when backtesting it appears that the significant move is typically completed within a 2-4 week period at max and 3-5 day period at minimum.
A personal note: I am a futures trader intraday but would very strongly caution users when using this strategy with futures (unless their risk tolerance is higher than most). The most beneficial strategy when fading moves would be to enter in tranches, starting at the first signal and adding on any pullback (as long as the pullback is not below the initial entry point). 1-6 Week Date-To-Expiry options would be the primary method for applying this strategy. I would also like to add that SPY/SPX options (SPDR S&P 500 ETF Trust / CBOE S&P 500 Index) are the most liquid options that could be applied in this strategy.
► Description (additional)
With the understanding that few users can read pinescript (Pine), the description above contains all of the necessary information that is necessary for a user to understand the intention for script utilization. For those who do understand Pine, the code is commented in each section in order to provide an understanding of the underlying functions, calculations, and thought process that went on during the writing of the script.
► Description (additional)
This script’s description contains no delegations, all aspects of the script as well as the initial idea behind it are contained in the description above, which is self-contained in it’s entirety with a clear and defined purpose that is written with the intent to holistically capture the intent of the potential use for this indicator.
► General House Rule #2
This script and the description (as well as my profile) contain no links or associations to promotion of any kind, I am not a business, I am not an individual that will in any way make money from this script or the promotion of another person, idea, company, entity, or legal persons (foreign or domestic).
► Originality and usefulness
This is an original and custom script (and idea) that is not a rehashing or a copy of any code from any other programmers in the tradingview community.
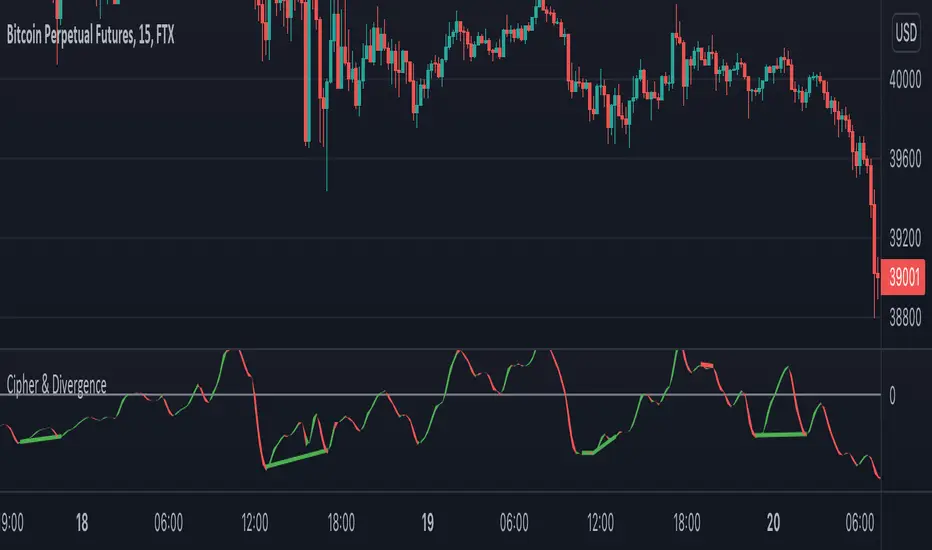
Cipher & DivergenceFor a long time I've been using complicated script with too much informations in it.
In this one I try to have just the bare minimum information to be able to analyse and find a potential reversal zone.
It is inspired from different wave trend / cipher script but has been tuned after months of backtest.
Extending the usage of the wave trend oscillator, which can be used with overbuy & oversell zone it might be better to wait for a confirmation of the movement. This confirmation can be identified by a pull back of the wave trend & price.
We can even confort ourself by waiting for reversal indicators.
Reversal may occurs after a divergence, wait for it, a cross of zero line followed by a PB to find your entry.
You can setup alert on bear / bull divergence but also when the wave trend cross the zero line to never miss a potential trade.
Huge thanks to LazyBear for his wave trend
And thanks vumanchu for his huge cipher script which was very useful for divergence finder
Period Dollar Cost Average BacktesterHere is a simple script to calculate the profits and other dollar cost average strategy statistics. This strategy was created to avoid asset price volatility, so the pump and dump scheme does not affect the portfolio. By dividing the investment amount into periods, the investor doesn’t need to analyze the market, fundamental analysis, or anything. The goal is to increase the asset holdings and avoid fast and robust price movements.
This indicator has some configurations.
Amount to buy: the amount to buy at each time
Broker fee %: the fee percentage that the broker has for spot trade
Frequency: the frequency of the investments. Example: 1 Day means that every day, it will buy an amount of the asset
Starting Date: when the indicator will start the investment simulation
Ending Date: when the indicator will end the investment simulation
InfoCell With/Height: it relates to the panel for view purposes. Change the values to fit better on your screen.
This indicator has three lines:
Total Invested (green): total amount invested at the end of the period
Total Net Profit (pink): total profit by converting the amount of the asset bought at the latest closing price
Holding Profits (yellow): the amount that would be in the portfolio if the investor had invested all the capital in a signal trade at the beginning of the period.
The statistics panel has some information to help you understand buying the asset in one or more trades. So, besides those three lines that were mentioned above, here are the other statistics:
Entry Price: The price of the asset when the first investment was made
Gross Profit: Total amount of profit, not excluding the losses
Gross Losses: Total amount of losses, not excluding the profits
Profit Factor: The Gross Profit divided by the Gross Loss. A value above 1 means it’s profitable.
Profit/Trades: Net profit per trade. This includes the broker fees.
Recovery Factor: The Net profit divided by the relative drawdown. The higher the recovery factor, the faster the recovery of a loss
Total Asset Bought: The amount of the asset that was bought at the end of the investment plan
Absolute Drawdown: The total amount of losses that made the account balance go below its initial value
Relative Drawdown: The max drawdown that occurred, no matter the account balance amount
Total Trades: number of times the investment was made in the selected period
Total Fee: total Fee that was spent on the total investment
Total Winning Trades: the total amount of winning trades. A trade is considered a winner if the net profit is up compared with the latest investment.
Total Losing Trades: the total amount of losing trades. A trade is considered a loser if the net profit is down compared to the latest investment.
Max consecutive wins: the max amount of consecutive winning trades
Max consecutive losses: the max amount of consecutive losing trades
The chart above uses the default configuration of the indicator. Placed on the BTCUSD market, taking the time range of January 1st, 2018 to January 1st, 2022, 4 years. Buying a BTC amount with 10 USDT every day in that period would generate a more than 500% profit. Compared to the profit amount by just holding the count, which was close to 350% profit, the dollar cost average by period would be much more profitable.

Trade Helper [Trading Nerd]Position Size Calculator / Lot Size Calculator
Disclaimer: I do my best to avoid wrong calculations and bugs. I provide this indicator without warranties of any kind. You bear all risks associated with the use of this indicator.
Inputs:
Market: Adds a name tag to the Table to keep track of the trades.
Entry Price: The entry Price of the Position.
Entry Time: The entry Time/Candle of the Position. If Stop Loss Type is 'ATR' or 'HH/LL' the Value for this is calculated by this Candle.
Stop Loss Type: Changes the Stop Loss Type.
Direction: Define if the trade direction is 'Long' or 'Short'. Has no effect on Stop Loss Type 'Custom'. For this you can just set the Stop Loss below/above the Entry Price .
ATR Multiplier: Multiplies the ATR Value by this number. Has only an effect on Stop Loss Type 'ATR'.
HH/LL Lookback Length: Lookback length for determine Highest High/Lowest Low value. Has only an effect on Stop Loss Type 'HH/LL'.
Custom SL Price: The Stop Loss Price if the Stop Loss Type is set to 'Custom'.
Risk Reward Ratio: The Risk is multiplied by this number to determine the Take Profit Price.
Balance: Balance Amount and Currency
Contract Size: The Position Size is divided by this number. E.G. in Forex one Lot is 100.000 Contracts. Change this Value depending on your Broker and Market.
Risk in %: Percent that is risked of the Balance for one Trade.

ProjectionGreetings Traders! I have decided to release a few scripts as open-source as I'm sure others can benefit from them and perhaps make them better.(Be sure to check my Profile for the other scripts as well: www.tradingview.com).
This one is called Projection.
Projection is based off the same Principle as some of my other scripts, such as Trade Manager() and Price Predictor(). I use a simple concept using line.new() to define some potential Price Projections. From the Settings of the Indicator, you can access a couple different Pre-Set options.
Wide Parabola:
Skinny Parabola:
Straight Triangle:
ZigZag1:
ZigZag2:
I wanted to give a Special Thanks to @Pinecoders for the custom RoundToTick Function from Backtesting/Trading Engine --> ()
If you like Projection, be sure to Like, Follow, and if you have any questions, don't be afraid to drop a comment below.

User-Inputed Time Range & FibsGreetings Traders! I have decided to release a few scripts as open-source as I'm sure others can benefit from them and perhaps make them better.(Be sure to check my Profile for the other scripts as well: www.tradingview.com).
This one is called User-Inputed Time Range & Fibs.
The idea behind this script is to record the Range Highs and Lows of a User Defined Period, and plot potential Targets based on either Fibonacci Extensions or a Multiple of the Range Size. I created this originally for use with the US Session Initial Balance(From 9:30-10:30AM EST), however it can be set to any time period.
What is Initial Balance? In simple words, Initial Balance (IB) is the price data, which are formed during the first hour of a trading session. Activity of traders forms the so-called Initial Balance at this time. This concept was introduced for the first time by Peter Steidlmayer when he presented the market profile to traders(atas.net).
The IB is monitored as a break-out area for Range Extension traders. The IB High is also seen as an area of resistance and the IB Low as an area of support until it is broken(www.mypivots.com).
As a note, depending on the Time Zone you are in, you may need to manually add or subtract from the Timed Range to match the desired Time. For example in NY Eastern Time, I have to use 8:30-9:30AM to Capture the 9:30-10-30AM IB for ES and NQ. Similarly, I must use 14:30-15:30PM to Capture the 9:30-10-30AM IB for BTC. You will need to make adjustments based on the Time Zone you are located in.
I wanted to give a Special Thanks to @PineCoders for the Custom Rounding Function from Backtesting/Trading Engine--> (), Pinecoders.com for help with Tracking the Highs/Lows--> (www.pinecoders.com), and @TradeChartist for allowing me to use some of the code for the Fibonacci Extensions from his script here--> ().
If you like User-Inputed Time Range & Fibs, be sure to Like, Follow, and if you have any questions, don't be afraid to drop a comment below.

Price PredictorGreetings Traders! I have decided to release a few scripts as open-source as I'm sure others can benefit from them and perhaps make them better.(Be sure to check my Profile for the other scripts as well: www.tradingview.com).
This one is called Price Predictor.
How To Use Price Predictor
Price Predictor acquires potential targets by measuring the Average Change of Price from a user-defined resolution, from Open to Open. By default, the Resolution is set to 1 Day, however you can play around with Weekly, Monthly, etc. When a new resolution period begins, Price Predictor will automatically adjust based on the new Average Change of Price.
Due to the avoidance of Security() in this script, you may have to play around with the Timeframe that you use it in to ensure that you have enough bars on your chart to process the User-Defined Resolution.
The first Target Zone represents Target 5 of my other script, Trade Manager()(Given that you set the Target Multiple and Default Threshold Inputs as the same in each script), and is the most likely to be hit before the end of the resolution period.
In addition to a User-Defined Resolution, you also have the option of using a Custom Price to define Target Zones, however I'd recommend using my other script, Trade Manager(), if the volatility of the Instrument isn't too high.
I wanted to give a Special Thanks to @Pinecoders for the Custom RoundToTick Function from The Backtesting/Trading Engine --> (
If you like Price Predictor, be sure to Like, Follow, and if you have any questions, don't be afraid to drop a comment below.

Trade ManagerGreetings Traders! I have decided to release a few scripts as open-source as I'm sure others can benefit from them and perhaps make them better.(Be sure to check my Profile for the other scripts as well: www.tradingview.com).
This one is called Trade Manager.
How To Use Trade Manager
Trade Manager acquires potential targets by measuring the Average Change of Price from a user-defined resolution, from Open to Open. By default, the Resolution is set to 1 Day, however you can play around with Weekly, Monthly, etc. When a new resolution period begins, Trade Manager will automatically adjust its Targets based on the new Average Change of Price.
Due to the avoidance of Security() in this script, you may have to play around with the Timeframe that you use it in to ensure that you have enough bars on your chart to process the User-Defined Resolution.
The idea behind Trade Manager is quite simple yet can be quite powerful at the same time. Consider a Daily Candle for example. You can clearly see how a vast amount of price movement can be encapsulated within it, sometimes in both directions. By measuring the Average Change of Price per day(From Open to Open), we can use this Average to build targets off of. Defining a small Threshold above and below the Open Price of the Daily Candle allows you to set Limit Orders at these levels with predefined Targets. Then, the use of the custom Trailing Stop and Break Even helps to secure profits without giving too much back to the market, all while managing your risk.
Within the Settings of Trade Manager, you have the option to alter the logic of whether Break-Even is set after the first Target or second Target is hit.
In addition to using a User-Defined Resolution Period, you can also input a Custom Price into the settings of Trade Manager and allow the Targets, Trailing Stop, and Break Even to be calculated from the Custom Price.
I wanted to give a Special Thanks to @PineCoders for the Custom RoundToTick Function from The Backtesting/Trading Engine --> ()
As a note, there are times where price will break out very strongly from the Limit Price, sometimes crossing the Stop and Limit Price on the same bar. When this happens, it is difficult for Pine to determine which occurred first intra-bar, and as a result, it does not record a new position. In these instances, I'd recommend adjusting the Default Stop Multiple so it is below the bar.
If you like Trade Manager, be sure to Like, Follow, and if you have any questions, don't be afraid to drop a comment below.

Visual RSI [LucF]Visual RSI offers a different way of looking at RSI by providing a composite representation of 9 different RSI-generated components. Instead of focusing on one line only, this approach blends multiple sources to provide the viewer with a larger context RSI-based picture.
For those who don’t want to read
• Green in bullish (>50) zone is the most bullish.
• Red in bullish zone doesn’t necessarily mean bearish—it just means bullish strength is weakening. It may be just a pause before a reprise or exhaustion signalling a reversal—impossible to tell.
• The same in inverse applies to the bearish zone (<50).
For those who want to understand
The nine components making up Visual RSI are:
• a current timeframe RSI
• a higher timeframe RSI
• the delta between these two RSI lines
• for each of these three basic components, two independent Bollinger band: one calculated for the bullish section of the scale (>50) and a separate one calculated for the lower bearish region.
Dual BBs
In my view, RSI’s position with regards to the centerline is much more important than its position in extreme areas. Why? Because the building block of RSI is the ratio of the averages of up/down moves during the RSI period. When the average of ups is greater, RSI is > 50. So while a rising signal starting from 20 let’s say, indicates that the rate of change is increasing, only when it crosses 50 can we say that sentiment balance has truly become bullish, and this information is more reliable than the signal being at a level corresponding to whatever estimate we make of what constitutes an extreme value. In my landscape, the general balance of a ratio provides more valuable information than the ratio’s exact value.
The idea behind the dual BBs is to provide independent tracking information for both halves of the indicator’s space, which I find more useful than the normal method of simply adding a multiple of the standard deviation on both sides of the mean. With dual BBs, the upper BB will never go lower than the indicator’s centerline, and the lower BB will never go higher. The upper BB focuses on upper-bound volatility when the signal is bearish, and the lower BB focuses on downside volatility when the signal is bearish.
The functions used to calculate the independent BBs are reusable on other signals if a centerline can be defined for them. A clamping percentage is implemented, so that when a BB line is hugging the centerline it clamps to it. This helps in providing earlier signals when they use the BB line states.
Providing context to RSI
What RSI measures indirectly is the balance in the rate of change—or the speed of price movement, but not its instant value, otherwise RSI would be even noisier. More precisely, RSI represents the relative strength of the up/down movement in the last n bars of RSI’s length, with 14 often used because that’s what Wilder proposed (Visual RSI’s defaults are 20 for the current timeframe and 40 for the higher timeframe). At every bar, a new value is added to the equation and an old value carrying equal weight is dropped, so a large dropped off value will have more impact on RSI’s value if the new bar’s move is small. This accounts for some of RSI’s speed in identifying exhaustion after important moves, but almost for some of its noise.
Visual RSI is the result of trying to drown RSI’s noise in the context of other informational streams, while simultaneously providing even faster information than RSI alone, by giving more visual weight to the delta between the current and higher timeframe RSI’s.
How to read Visual RSI
The default settings show all 9 basic components as green/red areas of intensities varying with their importance. The most intense colors are reserved for the delta RSI and the BBs have the lightest intensities. The individual lines of components are intentionally difficult to distinguish so that focus is first on the general picture, including the all-important six-state background, and then on the delta RSI.
One entry setup could be reversals in a larger trend context, so low pivots of the delta in a fully bullish context (a green background in the upper section of the indicator), and inversely, high pivots in a fully bearish context (a red background in the lower section of the indicator).
Please resist the common misconception, when interpreting RSI, that a reversal in the signal will necessarily lead to a reversal in price. Each trend has its rhythm. Only machine-generated price action can progress regularly. It’s normal for trends to take a breather for some time before they continue or reverse, as traders driving the trend experience emotional fatigue and gradual fear. RSI reversals merely signify that such a breather has occurred—nothing more. Only the larger context can provide information that can situate that pause and put more meaningful odds on it having more probability of continuing in one direction or the other. This is the reasoning behind the setup just described.
Features
• All components can be hidden, displayed as a simple line, a uniformly colored fill, or a green/red fill (the default).
• The background can be colored using 9 different methods, including 3 six-state methods using the rising/falling BB lines of the 3 basic components. These six states allow for bullish/bearish/neutral sentiment in both the upper and lower regions of the indicator. A bearish (dark red) background in the bullish (>50) section of the indicator represents decreasing bullishness. A bearish (slightly brighter red) in the bearish (<50) section of the indicator means incresingly bearish sentiment. The six-state backgrounds allow for neutral (no color) sentiment when no compelling signs can be found to conclude anything with meaningful odds. The default background uses the six-state method on the higher timeframe RSI’s BBs because I find it the most useful, as it represents the largest—and slowest—context sentiment among all the indicator’s components.
• A thin status bar in the top part of the indicator also allows selection of the same 9 methods to color it. The default is a triple-state system using the rising/falling characteristics of the current timeframe RSI’s BBs to provide a short-term counterbalance to the long-term background.
• Three different markers can be configured using approximately 70 permutations each, each filtered by 20 different filter permutations. When modification of the relevant parameters in the script’s Settings/Settings/Parameters section is added, possibilities are almost endless. If the generated signals are then fed into the PineCoders Engine and combined with the Engine’s own options, the permutations go up another order of magnitude, and changes to any setting can be instantly evaluated using the Engine’s backtesting results.
• Five simple filters can be combined. They are additive. They include volume-related conditions and a chandelier, which I find useful because both volume and volatility (the chandelier using highs/lows and ATR) are sensible complementary sources to RSI’s momentum information. The filter’s state can be shown as a thin line at the bottom of the indicator.
• Alerts can be configured using any of the marker/filter combinations mentioned. As usual, once your markers/filters are set up the way you want, create your alert from the chart/timeframe you want the alert to run on and be sure to use the “Once Per Bar Close” triggering condition. Use an alert message that will remind you of which combination of markers were used when creating the alert.
• A plot providing entry signals for the PineCoders Backtesting & Trading Engine is supplied. It will use whichever marker/filter configuration is active to generate signals.
• All higher timeframe information is non-repainting. Higher timeframe lines can be smoothed (the default). The selection of the higher timeframe can be made using 3 different methods:
1. By steps (if current timeframe <= 1 minute: 60 min, <= 60 min: 1D, <= 6H: 3D, <= 1D: 1W, <=1W: 1M, >1W: 12M)
2. By a user-defined multiple of the current timeframe
3. Using a fixed timeframe
Thanks to:
• Alex Orekhov aka @everget for the chandelier code.
• @RicardoSantos who through a small remark early on, unknowingly put me on the track of eliminating noise through visual crowding.
• The brilliant guys in the PineCoders Pro room for your knowledge, limitless creativity and constant companionship.

RePaNoCHa V4 [Alerts]Script for automatic trading with Alerts.
LG --> Long (green: not confirmed) (lime: confirmed)
ST --> Short (maroon: not confirmed) (red: confirmed)
TS --> Trailing Stop
xL --> Close Long Position
xS --> Close Short Position
SL --> Stop Loss
The trailing stop closes the trade if the price changes direction by a specified percentage or offset. There is no ideal distance because markets and price are always changing and we know that is impossible to exit on the top or bottom. This script interpolate the trailing Stop Offset with profit, higher profit --> higher Trailing Stop Offset. Despite this, it's difficult to catch the price but not impossible. It has a TS delay too. It take a snapshot every X seconds, if the TS is activated the alert is triggered, otherwise the price keeps fluctuating until a new snapshot.
It can be easily converted to Backtest. Just delete "//" on the corresponding part.
Default settings for XBT:USD at 1H.

Multiple Moving Averages Alerts ScriptAlerts script that has triggers on multiple moving average crossovers so that profit is maximised, it also has an optional control moving average, enabled by default, that when active will stop trading when the price (first ma) is below the control moving average.
Source code is open so that others can use and modify
Click Below for Backtesting version:
Disclaimers, not an expert, not intended to be financial advise.
Biffy
[STUDY]Kagi Emulator OCC & SL/TP V3This is the script with alerts for the previous backtest.
Modify "reversal" according to the pair
It has take profit and stop loss too.
Thanks and Enjoy...

Two Bar Break Line Alerts R1.0 by JustUncleLThis indicator with default settings is designed for BINARY OPTIONS trading. The indicator can also be used for Forex trading with some setting changes. The script shows Two Bar Pullback Break lines and alerts when those Break lines are Touched (broken) creating a short term momentum entry condition.
For a Bullish Break (Green Up Arrow) to occur: first must have two (or three) consecutive bear (red) candles which is followed by a bull (green) candle creating a pivot point. The breakout occurs then the High of the current Bull (green) exceeds the highest point of the previous two (or three) pivotal bear candles. The green channel Line shows where the current Bullish BreakOut occurs.
For a Bearish Break (Red Down Arrow) to occur: first must have two (or three) consecutive bull (green) candles which is followed by a bear (red) candle creating a pivot point. The breakout occurs when the Low of the current Bear (red) drops below the lowest point of the previous two (or three) pivotal Bull candles. The red channel Line shows where the current Bearish BreakOut occurs.
The break Line Arrows can optionally be filtered by the Coloured MA (enabled by default), a longer term directional MA (disabled by default) and/or a MACD condition (enabled by default) as a momentum filter.
You can optionally select three Bar break lines instead of two. The three bar break lines are actually equivalent to Guppy's Three Bar Count Back Line method for trade entries (see Guppy's video reference below).
Included in this indicator is an ability to display some basic Binary Option statistics, when enabled (enabled by default) it shows Successful Bars in Yellow and failed Bars in Black and the last Nine numbers on the script title line represent the Binary option Statistics in order:
%ITM rate
Total orders
Successful Orders
Failed Orders
Total candles tested
Candles per Day
Trades per Day
Max Consecutive Wins
Max Consecutive Losses
You can start the Binary Option statistics from a specific Date, which is handy for checking more recent history.
HINTS:
BINARY OPTIONS trading: use 5min, 15m, 1hr or even Daily charts. Trade after the price touches one of the Breakout lines and the Arrow first appears. Wait for the price to come back from Break Line by 1 or 2 pips, the alert arrow must stay on and candle change to black, then take Binary trade expiry End of Candle. If price pull back and arrow turns off, don't trade this candle, move on you probably don't have momentum, there will be plenty of other trigger events. The backtesting results are good with ITM rates 65% to 72% on many currency pairs, commodities and indices. Realtime trading has confirmed the backtesting results and they could even be bettered, provided you are selective on which signals to trade (strong MACD support etc), that you are patient and disciplined to this trading method.
FOREX trading: the default settings should work with scalping. For longer term trades try with settings change to a more standard MACD filter or slower to catch the longer term momentum swings and the idea would be to trade the first Break Line alert that occurs after a decent Pullback in the direction of the trend. Setting the SL to just above/below the Pivot High/Low and set target to two or three times SL.
References:
"Fundamentals of Price Action Trading for Forex, Stocks, Options and Futures" video:
www.youtube.com
Other videos by "basecamptrading" on Naked Trading.
"Taking Profits in Today's Market by Daryl Guppy" video:
www.youtube.com

CM Stochastic POP Method 2-Jake Bernstein_V1Yesterday Jake Bernstein authorized me to post his updated results with the Stochastic Pop Trading System he developed many years ago.
You can take a look at the Original System with Updated Settings at
This indicator is a different set of rules Jake mentioned in the PDF he allowed me to post.
To view the PDF use this link:
dl.dropboxusercontent.com
Today we’re releasing the version described in the PDF that uses the StochK values of 55, 50, and 45. The rules are discussed in the PDF but here is a simple breakdown:
Enter Long when StochK is below 50 and Crosses Above 55
Exit Long on Cross Below 55
Enter Short when StochK is Above 50 and crosses Below 45
Exit Short on Cross Above 45
Two Important Items to understand about this method:
To code the rules Precisely we need a function that will be available when Strategy Capabilities are released on TradingView.
There is one of Jakes Profit Maximizing Strategies that needs to be integrated with this code…which again we need the Strategy based Function that will be coming soon.
To Compare this system to the Stochastic Pop Method 1 System shown yesterday at I used the same Symbol and dates for you to compare…but remember to give this Method 2 System a Fair Look/Evaluation…we need the Soon To Be Released…TradingView Strategy Capabilities.
BackTesting Results Example: EUR-USD Daily Chart Since 01/01/2005
Strategy 1 – Stochastic Pop Method 2 System:
Go Long When Stochasticis below 50 and Crosses Above 55. Go Short When Stochastic is above 50 and Crosses Below 45. Exit Long/Short When Stochastic has a Reverse Cross of Entry Value.
Results:
Total Trades = 151
Profit = 40,758 Pips
Win% = 37.1%
Profit Factor = 1.26
Avg Trade = 270 Pips Profit
***Most Consecutive Wins = 4 ... Most Consecutive Losses = 7
Strategy 2:
Rules - Proprietary Optimization Jake Will Teach. Only Added 1 Additional Exit Rule.
Results:
Total Trades = 151
Profit = 60.305 Pips
Win% = 37.1%
Profit Factor = 1.38
Avg Trade = 399 Pips Profit
***Most Consecutive Wins = 4 ... Most Consecutive Losses = 7
Indicator Includes:
-Ability to Color Candles (CheckBox In Inputs Tab)
Green = Long Trade
Blue = No Trade
Red = Short Trade
Jake Bernstein will be a contributor on TradingView when Backtesting/Strategies are released. Jake is one of the Top Trading System Developers in the world with 45+ years experience and he is going to teach TradingView.com’s community how to create Trading Systems and how to Optimize the correct way.
Link To PDF:
dl.dropboxusercontent.com
Link to Original Version of Indicator with Updated Settings.

CM Stochastic POP Method 1 - Jake Bernstein_V1A good friend ucsgears recently published a Stochastic Pop Indicator designed by Jake Bernstein with a modified version he found.
I spoke to Jake this morning and asked if he had any updates to his Stochastic POP Trading Method. Attached is a PDF Jake published a while back (Please read for basic rules, which also Includes a New Method). I will release the Additional Method Tomorrow.
Jake asked me to share that he has Updated this Method Recently. Now across all symbols he has found the Stochastic Values of 60 and 30 to be the most profitable. NOTE - This can be Significantly Optimized for certain Symbols/Markets.
Jake Bernstein will be a contributor on TradingView when Backtesting/Strategies are released. Jake is one of the Top Trading System Developers in the world with 45+ years experience and he is going to teach how to create Trading Systems and how to Optimize the correct way.
Below are a few Strategy Results....Soon You Will Be Able To Find Results Like This Yourself on TradingView.com
BackTesting Results Example: EUR-USD Daily Chart Since 01/01/2005
Strategy 1:
Go Long When Stochastic Crosses Above 60. Go Short When Stochastic Crosses Below 30. Exit Long/Short When Stochastic has a Reverse Cross of Entry Value.
Results:
Total Trades = 164
Profit = 50, 126 Pips
Win% = 38.4%
Profit Factor = 1.35
Avg Trade = 306 Pips Profit
***Most Consecutive Wins = 3 ... Most Consecutive Losses = 6
Strategy 2:
Rules - Proprietary Optimization Jake Will Teach. Only Added 1 Additional Exit Rule.
Results:
Total Trades = 164
Profit = 62, 876 Pips!!!
Win% = 38.4%
Profit Factor = 1.44
Avg Trade = 383 Pips Profit
***Most Consecutive Wins = 3 ... Most Consecutive Losses = 6
Strategy 3:
Rules - Proprietary Optimization Jake Will Teach. Only added 1 Additional Exit Rule.
Results:
Winning Percent Increases to 72.6%!!! , Same Amount of Trades.
***Most Consecutive Wins = 21 ...Most Consecutive Losses = 4
Indicator Includes:
-Ability to Color Candles (CheckBox In Inputs Tab)
Green = Long Trade
Blue = No Trade
Red = Short Trade
-Color Coded Stochastic Line based on being Above/Below or In Between Entry Lines.
Link To Jakes PDF with Rules
dl.dropboxusercontent.com

SD-Range Oscillator | QuantEdgeBSD-Range Oscillator | QuantEdgeB
🔍 Overview
SD-Range Oscillator | QuantEdgeB (SDRO) is a normalized momentum oscillator that compresses a low-lag trend core into a 0–100 style range using standard-deviation (SD) bands. It builds a smooth baseline from a fast triple-smoothed average, wraps it with ±2×SD volatility bounds, then normalizes the core value inside that envelope. Clear Long/Short regimes trigger when the normalized value crosses user-defined thresholds, with optional labels, regime-colored candles, and intuitive filled zones.
✨ Key Features
1.⚡ Low-Lag Core (Triple-Smooth Engine)
- Uses a fast, low-lag triple-smoothed average as the oscillator’s primary signal input.
- Helps keep momentum readings responsive while filtering noise.
2. 📏 SD Volatility Envelope (±2×SD)
- Builds a volatility channel around a smoothed baseline using standard deviation.
- Automatically adapts to changing market turbulence.
3. 🧮 Normalized Range Output
- Converts the core signal into a normalized value by mapping it between the upper/lower SD bounds.
- Makes readings consistent across assets and timeframes.
4. 🎯 Threshold-Based Regimes
- Long when the normalized value exceeds the Long threshold.
- Short when it falls below the Short threshold.
- Includes an additional safety filter to reduce “forced” longs when price is already extended near the upper envelope.
5. 🎨 Visual Clarity & Zones
- Regime-colored oscillator line and candles.
- Filled SD bands around the baseline for quick volatility context.
- Optional highlight fills between the oscillator and thresholds to show active long/short phases.
- Extra OB/OS background zones for quick overextension awareness.
6. 🔔 Signals & Alerts
- Optional “Long/Short” labels on confirmed regime flips.
- Alert conditions fire on long/short regime crossovers.
💼 Use Cases
• Momentum Confirmation: Validate breakouts by requiring SDRO to hold above the Long threshold.
• Mean-Reversion Awareness: Watch for extreme normalized readings near upper/lower bounds.
• Regime Filtering: Use SDRO state (Long/Short/Neutral) to filter trades from other systems.
• Cross-Market Comparison: Normalization makes it easier to compare momentum across different tickers.
🎯 For Who
• Trend traders who want a clean momentum filter with adaptive volatility context.
• System builders needing a simple regime variable (1 / -1 / neutral) to gate entries.
• Discretionary traders who like visual confirmation (fills, candle coloring, threshold zones).
• Multi-asset traders who benefit from normalized, comparable oscillator readings.
⚙️ Default Settings
• TEMA Period: 7
• Base Length (SMMA): 25
• Long Threshold: 55
• Short Threshold: 45
• SD Multiplier: 2× (fixed in code)
• Color Mode: Alpha
• Color Transparency: 60
• Labels: Off by default
📌 Conclusion
SD-Range Oscillator | QuantEdgeB blends a low-lag triple-smoothed core with an adaptive SD envelope to produce a normalized, easy-to-read momentum signal. With clear threshold regimes, volatility-aware context, and strong visuals (fills + candle coloring), SDRO helps separate meaningful momentum shifts from noise across any asset or timeframe.
🔹 Disclaimer: Past performance is not indicative of future results. Always backtest and align settings with your risk tolerance and objectives before live trading.
🔹 Strategic Advice: Always backtest, optimize, and align parameters with your trading objectives and risk tolerance before live trading.

Anurag Institutional Swing Trader Pro [Robust]nstitutional Swing Flow is a comprehensive, multi-timeframe system designed for swing traders who want to align with "Smart Money" rather than fight against it.
Unlike standard indicators that rely solely on price crossovers, this script analyzes the underlying order flow—tracking stealth accumulation, volume anomalies, and institutional footprints—to generate high-probability swing setups.
Key Features (The "Smart Money" Logic)
1. Institutional Footprints
Stealth Accumulation/Distribution: Detects when price is held in a tight range despite high volume (a classic sign of institutions building a position).
Smart Money Divergence: Identifies when price makes a lower low but Money Flow (OBV/Accumulation-Distribution) makes a higher high.
Fair Value Gaps (FVG): Automatically plots Bullish and Bearish imbalance zones where price is likely to retrace before continuing the trend.
2. Safety First (Risk Management)
Real Earnings Detection: Automatically checks upcoming earnings dates. If an earnings report is within 5 days (adjustable), the script blocks new signals to prevent gambling on binary events.
Visual Exits: Plots dynamic Stop Loss and Take Profit levels on the chart the moment a trade is taken, along with "SL Hit" or "TP Hit" markers for visual backtesting.
3. The "Confluence Score" Dashboard A sophisticated dashboard in the top-right corner rates every setup on a scale of 0 to 100 based on:
Multi-Timeframe Trend: Is the Weekly, Daily, and 4H trend aligned?
Relative Strength: Is the asset outperforming the SPY benchmark?
Volatility: Is the asset in a "Squeeze" (Bollinger Band compression)?
Momentum: RSI, MACD, and CMF confirmation.
Only setups with a score > 65 (adjustable) trigger a BUY or SELL signal.
How to Use
Timeframe: Optimized for 4-Hour (4H) and Daily (D) charts. (Avoid using on <15m charts due to multi-timeframe calculations).
The Signal: Wait for a large "CALL" or "PUT" label.
The Confirmation: Check the Dashboard. Ideally, look for a "Squeeze: YES" combined with a high Institutional Buy Score.
The Exit: Follow the Red (Stop Loss) and Green (Take Profit) lines plotted automatically.
Disclaimer
This tool is for educational purposes only. Swing trading involves risk. Always confirm signals with your own analysis and risk management rules.

RSI For Loop | PWRSI For Loop – True Dominance Oscillator
RSI For Loop – True Momentum Dominance Through Historical Comparison
The Relative Strength Index (RSI) is excellent at measuring recent price change intensity, but a reading of 70 or 30 has completely different implications depending on the market regime. RSI For Loop removes this ambiguity by transforming RSI into a clean, zero-centered dominance / percentile-rank oscillator that always tells you exactly how strong or weak the current momentum is compared to recent history.
How it works
- Standard RSI is calculated normally (default length 46).
- A simple for-loop compares the current RSI value against the actual RSI value of every previous bar inside the user-defined lookback window (default 1 to 99 bars ≈ one full quarter on daily charts).
- Current RSI higher → +1 point
- Current RSI lower → –1 point
The resulting score ranges from –99 to +99 and is naturally centered around zero:
1. +40 = current momentum beats ~70 % of the last 99 bars (approximation)
2. –60 = current momentum is weaker than ~80 % of the last 99 bars (approximation)
3. Near zero = balanced or ranging market
Additional statistical layers
- A very long rolling median of the score (default 240 periods) serves as a slow, robust dynamic centerline
- Upper and lower 3σ bands are calculated from the standard deviation of the underlying RSI median (default length 60) to highlight truly rare extreme-dominance phases
- Asymmetric trend thresholds (default Long +15 / Short –28) reflect the empirical observation that downside momentum is usually sharper and faster
Origin and development
The core idea of using a for-loop on RSI was originally introduced by @viResearch in his invite-only “RSI For Loop” script.
While studying that concept I realised I needed an even more regime-robust strength gauge that looks back far enough to capture full market cycles (2–4 months). Therefore I completely rewrote the loop to compare against actual historical RSI values instead of fixed levels, added a 240-period median centerline, 3σ extreme bands, asymmetric thresholds, and visual signals. All parameters were extensively tested across dozens of major assets (BTC, ETH, SOL, SUI, BNB, XRP, TRX, DOGE, LINK, PAXG, CVX, HYPE, VIRTUAL + 20+ more cryptos; Magnificent 7 stocks, QQQ, SPX, XAUUSD) with the goal of achieving consistent profitability, high Sortino ratio and low drawdown in simple trend-following setups.
The final defaults represent the most robust compromise found — they keep you in real trends for dozens or hundreds of bars while staying almost silent in choppy, ranging markets.
Important Note
The optimization process is tailored to MY needs and have to be adjusted to you prefered timeframe!
I was mainly looking for an indicator that shows the underlying strength of an asset, the trend componant was only a bonus in my eyes.
How to use it
1. Green triangle below bar → score crosses above +15 → new bullish regime confirmed → enter or add to longs
2. Magenta triangle above bar → score crosses below –28 → exit longs or go cash/short
While score stays clearly positive → bullish bias hold
3. Score touching or breaking the 3σ bands → extreme conviction zone (add to winners or prepare for exhaustion)
Strength
Recommended defaults (My preference)
RSI length 46
Loop range 1–99
Long threshold +15
Short threshold –28
Median length 240
SD length 60
Recommended Universal Settings (Tested for low Max-Drawdown, high Sortino)
RSI length 44
Loop range 1–60
Long threshold +14
Short threshold –10
Median length 180
SD length 28
Works on every asset class, but the current settings are tuned for major liquid markets.
Disclaimer: This is not financial advice. Backtests are based on past results and are not indicative of future performance.

Pops Dividend 7-Day RadarHow traders use it as a strategy anyway 🧠
In real life, this becomes a manual or semi-systematic strategy:
Strategy logic (human-driven):
Scan for highest yield stocks
Filter for ex-date within 7 days
Apply technical rules (trend, EMAs, support)
Enter before ex-date
Exit:
Before ex-date (momentum run-up)
On ex-date
Or after dividend (reversion play)
Indicator’s role:
“Tell me when a stock qualifies so I can decide how to trade it.”
That’s exactly what this tool does.
How we could turn this into a strategy-style framework
Even though Pine won’t let us backtest dividends properly, we can:
Build a rules-based checklist (entry/exit rules)
Create alerts that behave like strategy triggers
Combine with:
EMA trend filters
Volume conditions
ATR-based exits
Label it as:
“Pops Dividend Capture Playbook” (manual execution)
This keeps it honest, legal, and reliable.
Bottom line
🧩 Indicator = what we built
📘 Strategy = how you trade it using the indicator
⚠️ TradingView limitations prevent a true dividend strategy backtest
