Backward Number of BarsThis indicator was written in order to apply bar limit in strategies and it was published as open code so that everyone can use it. When backtesting with stock market api data, we determine how many bars should be, not from which date the data will be drawn. For example, we can draw 1000 bar data from stock exchange and perform the backtest on this data. You can plan your strategy by checking the number of bars you test with the window () == 1 parameter here while checking through Tradingview to check that the test we performed gives correct results.
In den Scripts nach "backtest" suchen

Triangular Moving Average (TMA) bandsWhat in the world is up folks ??!??
Here's the indicator of the day. Sharing a simple one today because I'm busy coding for a few clients (fun life of a top script author on TradingView)
The TMA bands is an indicator that I discovered on FXCM a few years ago FXCM TMA bands
From the screenshot above, we see that when the price hits the lower band, it's a possible reverse BUY signal. When it hits the upper band, it's a possible SELL signal
Methodology
1) The Take Profit 1 is the middle line, Take Profit 2 is the opposite band.
2) Once the TP1 is hit, set your Stop Loss to breakeven
3) Once the TP2 is hit, if you still want to stay in the trade, set your Stop Loss to the TP1
That's what we call a trailing stop loss which I offered in the Trade Manager : Trade-Manager-Open-Source-Version/
It will be a powerful tool in your arsenal for some scalp/intraday trades
After years of coding for traders, I worked with many brokers/API/languages so I'm very used to convert a script from a broker to another one (shameless self-advertising)
PS
Tomorrow I'll share the Signal version of my Algorithm Builder:
You'll be able to connect it in a single click to a very cool Backtest System made by the Pinescripters community
In other words, I'm selling the scripts to allow you to build your own signals in a few clicks AND to connect it easily to a kick-ass backtesting tool. More to come tomorrow
Hope you'll like it, like me, love it, love me, tip me :)
____________________________________________________________
Feel free to hit the thumbs up as it shows me that I'm not doing this for nothing and will motivate to deliver more quality content in the future. (Meaning... a few likes only = no indicators = Dave enjoying the beach)
- I'm an officially approved PineEditor/LUA/MT4 approved mentor on codementor. You can request a coaching with me if you want and I'll teach you how to build kick-ass indicators and strategies
Jump on a 1 to 1 coaching with me
- You can also hire for a custom dev of your indicator/strategy/bot/chrome extension/python

Manual Back Test LinesI created this indicator to primarily manually test other indicators in replay mode.
To use this indicator generally you will:
Select trade type: long or short
Enter your ATR (enter the actual ATR). The indicator will then calculate and plot your SL and targets based on your values
Default Stop Loss is ATR * 1.5
Default Target 1 is ATR * 1.5
Default Target 2 is ATR * 3
Using this indicator on Replay mode is great. What you do is go back in time. Hit play and as the indicator(s) you use provide signals pause.
Pull up options:
Select trade type
Update ATR value
Change date to entry date. Typically if you are trading off the daily timeframe you are going to wait for your current day candle to close to provide signal. That would mean your entry would be on the next day.
Click play and watch, track and record how trade unfolds.
Future updates:
I'd like to be able to have some way to click one button and have it fire that enter trade right now on chart. Also I'm working on figuring out how to calculate the ATR on the entry date so that isn't required to be entered.
Finally, I'd like to have some auto calculation on when targets and SL are hit. I have this partially done but it's more important that I use this indicator than spend time or funds to update it to do that. But I do plan on updating.

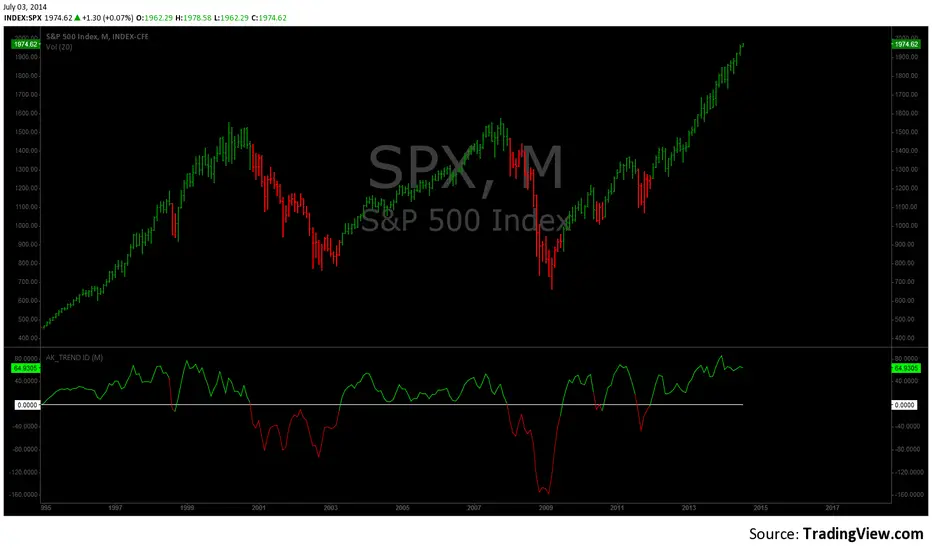
AK TREND ID v1.00Hello,
"Are we at the top yet ? "........ " Is it a good time to invest ? " ......." Should I buy or sell ? " These are the many questions I hear and get on the daily basis. 1000's of investors do not know when to go in and out of the market. Most of them rely on the opinion of "experts" on television to make their investment decisions. Bad idea.Taking a systematic approach when investing, could save you a lot of time and headache. If there was only a way to know when to get in and out of the market !! hmmmm. The good news is that there many ways to do that. The bad news is , are you disciplined enough to follow it ?
I coded the AK_TREND ID specifically to identified trends in the SPX or SPY only . How does it work ? very simply , I simply plot the spread between the 3 month and 8 month moving average on the chart.
If the spread > 0 @ month end = BUY
if the spread < 0 @ month end = SELL
The AK TREND ID is a LAGGING Indicator , so it will not get you in at the very bottom or get you out at the very top. I did a backtest on the SPX from 1984 to 7/2/2014 (yesterday), The rule was to buy only when the AK TREND ID was green. let's look at the result:
14 trades : 11 W 3 L , 78.75 % winning %
Biggest winner (%) = 108 %
Biggest loser (%) = -10.7 %
Average Return = 27 %
Total Return since 1984 = 351.3 %
You can see the result in detail here : docs.google.com
Although the backtesting results are good, the AK TREND ID is not to be used as a trading system. It is simply design to let you know when to invest and when to get out. I'm working a more accurate version of this Indicator , that will use both technical and fundamental data. In the mean time , I hope this will give some of you piece of mind, and eliminate emotions from your trading decision. Feel free to modify the code as you wish, but please share your finding with the rest of Trading View community.
All the best
Algo
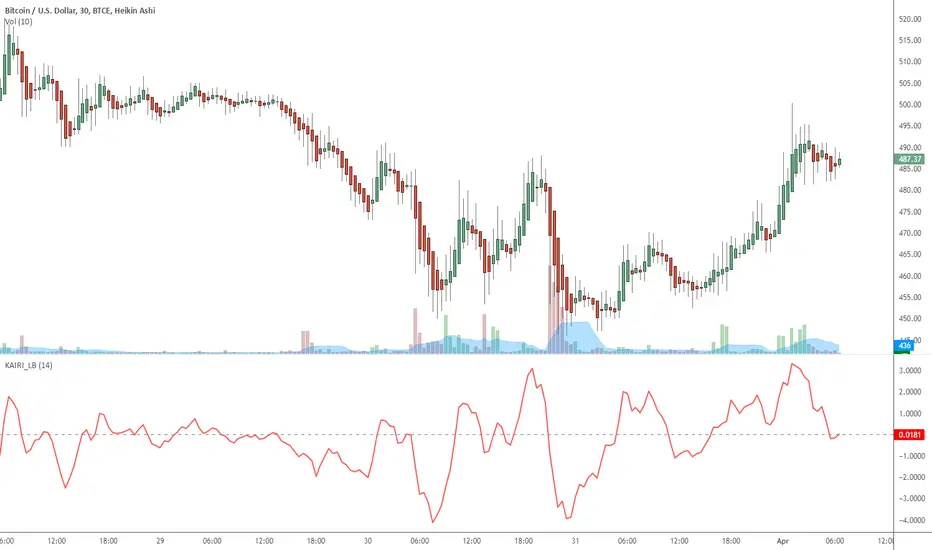
Indicator: Kairi Relative Index (KRI)KRI is a leading indicator, just like RSI. More info: www.etoro.com
I have noticed KRI producing less false-divergences compared to RSI (in my limited BTC backtesting).
Give it a try / backtest on your instrument. Appreciate a note here on what you think.
TwinSmooth ATR Bands | QuantEdgeBTwinSmooth ATR Bands | QuantEdgeB
🔍 Overview
TwinSmooth ATR Bands | QuantEdgeB is a dual-smoothing, ATR-adaptive trend filter that blends two complementary smoothing engines into a single baseline, then builds dynamic ATR bands around it to detect decisive breakouts. When price closes above the upper band it triggers a Long regime; when it closes below the lower band it flips to Short—otherwise it stays neutral. The script enhances clarity with regime-colored candles, an active-band fill, and an optional on-chart backtest table.
✨ Key Features
1. 🧠 Twin-Smooth Baseline (Dual Engine Blend)
- Computes two separate smoothed baselines (a slower “smooth” leg + a faster “responsive” leg).
- Blends them into a single midpoint baseline for balanced stability + speed.
- Applies an extra EMA smoothing pass to produce a clean trend_base.
2. 📏 ATR Volatility Bands
- Builds upper/lower bands using ATR × multiplier around the trend_base.
- Bands expand in volatile conditions and contract when markets quiet down—auto-adapting without manual tweaks.
3. ⚡ Clear Breakout Regime Logic
- Long when close > upperBand.
- Short when close < lowerBand.
- Neutral otherwise (no forced signals inside the band zone).
4. 🎨 Visual Clarity
- Plots only the active band (lower band in long regime, upper band in short regime).
- Fills between active band and price for instant regime context.
- Colors candles to match the current state (bullish / bearish / neutral).
- Multiple color palettes + transparency control.
💼 Use Cases
• Trend Confirmation Filter: Use the regime as a higher-confidence trend gate for entries from other indicators.
• Breakout/Breakdown Trigger: Trade closes outside ATR bands to catch momentum expansions.
• Volatility-Aware Stops/Targets: Bands naturally reflect volatility, making them useful as adaptive reference levels.
• Multi-Timeframe Alignment: Confirm higher-timeframe regime before executing on lower timeframes.
🎯 For Who
• Trend Traders who want clean regime shifts without constant whipsaw.
• Breakout Traders who prefer confirmation via ATR expansion rather than raw MA crossovers.
• System Builders needing a simple, robust “state engine” (Long / Short / Neutral) to plug into larger strategies.
• Analysts who want quick on-chart validation with a backtest table.
⚙️ Default Settings
• SMMA Length (Base Smooth Leg): 24
• TEMA Length (Base Responsive Leg): 8
• EMA Extra Smoothing: 14
• ATR Length: 14
• ATR Multiplier: 1.1
• Color Mode: Alpha
• Color Transparency: 30
• Backtest Table: On (toggleable)
• Backtest Start Date: 09 Oct 2017
• Labels: Off by default
📌 Conclusion
TwinSmooth ATR Bands | QuantEdgeB merges a dual-speed smoothing core into a single trend baseline, then wraps it with ATR-based bands to deliver clean, volatility-adjusted breakout signals. With regime coloring, active-band plotting, and optional backtest stats, it’s a compact, readable tool for spotting momentum shifts and trend continuation across any market and timeframe.
🔹 Disclaimer: Past performance is not indicative of future results. Always backtest and align settings with your risk tolerance and objectives before live trading.
🔹 Strategic Advice: Always backtest, optimize, and align parameters with your trading objectives and risk tolerance before live trading.

CCI Standard DeviationCCI Standard Deviation – Asymmetric Volatility-Adjusted Trend Filter (CCI SD)
The Commodity Channel Index (CCI), created by Donald Lambert in 1980, measures how far the typical price deviates from its statistical average to identify cyclical momentum and trend strength.
The standard formula is:
CCI = (Typical Price − SMA(Typical Price, n)) / (0.015 × Mean Deviation)
where Typical Price = (High + Low + Close)/3.
CCI is unbounded and centered around zero: sustained readings above zero indicate bullish momentum, below zero bearish. Classic interpretations often use zero-line crosses or fixed levels (±100, ±200, ±250), but these can be unreliable when CCI volatility changes across market regimes.
This indicator was developed to create a more disciplined trend-following tool that aligns with my core risk principle: “always protect to the downside.”
Starting from the standard CCI zero-line concept for trend direction, I experimented with standard deviation bands to make the oscillator volatility-adjusted. I then applied deliberate asymmetry: requiring the lower 1σ envelope (CCI − stdev) to cross above a positive threshold for bullish confirmation (high-probability entry only in robust trends), while exiting immediately on any raw CCI weakness below a negative threshold (quick downside protection). User inputs for both thresholds were added to allow fine-tuning and adaptability across different assets and timeframes.
An optional DEMA-smoothed version of the lower envelope provides additional clarity when desired.
Extreme zones
raw CCI ±240 and lower envelope > 200 or < –200 - are highlighted with background shading to flag rare acceleration or capitulation phases.
How it works
Standard CCI calculated on typical price (default length 38).
Rolling standard deviation of the CCI itself (default length 13) measures the oscillator’s recent volatility.
Lower envelope = CCI − stdev (dn).
Optional DEMA smoothing (default length 12) can be toggled.
Trend logic:
Bullish regime only when lower envelope
→ Long Threshold (default +10)
→ statistical proof of strength
Bearish/neutral immediately when raw CCI
→ Short Threshold (default –25)
→ fast downside protection
Origin and development
The indicator emerged from wanting a cleaner, more reliable CCI for trend direction. After testing volatility-adjusted versions, the asymmetric design proved superior:
it enters only high-conviction uptrends and exits rapidly on weakness, significantly reducing whipsaws while preserving trend capture.
Parameters were optimized through extensive backtests on major assets (BTC, ETH, SOL and many more Cryptos; Magnificent 7 stocks, QQQ, SPX, gold).
The defaults were selected for the best average Sortino ratio and lowest maximum drawdown across this broad universe, ensuring robustness and avoiding single-asset overfitting.
How to use it
Green triangle below bar
→ lower envelope crosses above Long Threshold
→ high-conviction bullish trend confirmed
→ enter or add to longs
Magenta triangle above bar
→ CCI crosses below Short Threshold
→ exit longs or go cash/short
While lower envelope remains above Long Threshold
→ hold bullish positions
Extreme background shading (dn >200 or CCI ±240)
→ rare high-attention zones (potential acceleration or exhaustion)
Recommended defaults
CCI length: 38
SD length: 13
Long threshold: +10
Short threshold: –25
Optional MA length: 12 (DEMA of lower envelope)
All visual elements (bar coloring, signals, background, smoothed line) are toggleable for personal preference.
This indicator is designed as a trend-strength and risk-management filter and is not intended as a standalone trading system.
Disclaimer:
This is not financial advice. Backtests are based on past results and are not indicative of future performance.

Momentum Candle V3 by Sekolah TradingMomentum Candle v3 by Sekolah Trading
Description:
Momentum Candle v3 is a technical indicator designed to identify market momentum signals based on price movement within a single candle. The indicator measures the size of the candle's body and wick to determine if the market is showing strong bullish or bearish momentum.
Key Features:
Candle Size: Measures price movement within a single candle to assess market momentum.
Short Wick: Focuses on wick length, with short wicks indicating that the closing price is more significant than the opening price.
Bullish/Bearish Momentum: Provides bullish signals when the closing price is higher than the open, and bearish signals when the closing price is lower than the open.
Customizable Minimum Body: Users can adjust the minimum body size for XAUUSD and USDJPY pairs according to their trading preferences.
Timeframe: Works on M5 and M15 timeframes for XAUUSD and USDJPY currency pairs.
How to Use:
Bullish Signal: The indicator signals bullish momentum when the candle body is sufficiently large and the wick is short, with the closing price higher than the open.
Bearish Signal: The indicator signals bearish momentum when the candle body is sufficiently large and the wick is short, with the closing price lower than the open.
Pip Parameters: Adjust the pip values for XAUUSD and USDJPY according to market conditions or your trading preferences.
Note: This indicator is a tool for technical analysis and does not guarantee specific trading results. It is recommended to use it alongside other strategies and analyses for better accuracy.
Realistic Backtest Results:
To ensure transparency and honesty in the backtest, here are some key factors to consider:
Position Size: The backtest uses a realistic position size of about 5-10% of the account equity per trade.
Commission & Slippage: A commission of 0.1% per trade and slippage of 1 pip were used in the backtest simulation to reflect real market conditions.
Number of Trades: The backtest sample includes more than 100 trades for a representative result.
Example of Backtest Results:
Profitability: The backtest results on XAUUSD and USDJPY show consistent performance with this strategy on the M5 and M15 timeframes.
Commission and Slippage: Adjusting for commission and slippage showed better accuracy under more realistic market scenarios.
How to Use the Indicator:
Signals from this indicator can be used to confirm market momentum in trending conditions. However, it is highly recommended to combine this indicator with other technical analysis tools to minimize the risk of false signals.
Important Notes:
Honesty & Transparency: This indicator is designed to provide signals based on technical analysis and does not guarantee specific trading results.
No Over-Claims: The backtest results displayed represent realistic scenarios and are not intended to promise certain profits.
Original Content: The code for this indicator is original and does not violate any copyrights.
Tagging:
Smart Tags: Momentum, Candle, XAUUSD, USDJPY, Bullish, Bearish, M5, M15, Technical Indicator, Market Momentum.

Average Price Calculator / VisualizerDCA Average Price Calculator - Visualize Your Breakeven & TP!
Ever wished you could visualize your trades and instantly see your average entry price right here on TradingView? Especially if you're a DCA (Dollar-Cost Averaging) trader like me, tracking multiple entries can be a hassle. You're constantly switching to a spreadsheet or calculator to figure out your breakeven and take-profit levels. Well I've developed this DCA Average Price Calculator to solve exactly that problem, bringing all your position planning directly onto your chart.
What It Does
This indicator is a interactive tool designed to calculate the weighted average price of up to 10 separate trade entries. It then plots your crucial breakeven (average price) and a customizable take-profit target directly on your chart, giving you a clear visual of your position.
Key Features
Up to 10 Order Entries: Plan complex DCA strategies with support for up to ten individual buys.
Flexible Size Input: Enter your position size in either USD Amount or Number of Shares/Contracts. The script is smart enough to know which one you're using.
Instant Average Price Calculation: Your weighted average price (your breakeven point) is calculated and plotted in real-time as a clean yellow line.
Customizable Take-Profit Target: Set your desired profit percentage and see your take-profit level instantly plotted as a green line.
Detailed On-Chart Labels: Each order you plot is marked with a detailed label showing the entry price, the number of shares purchased, and the total USD value of that entry.
Clean & Uncluttered UI: The main Average and TP labels are intelligently shifted to the right, ensuring they don't overlap with your entry markers, keeping your chart readable.
How to Use It - Simple Steps
Add the indicator to your chart.
Open the script's 'Settings' menu.
In the 'Take Profit' section, set your desired profit percentage (e.g., 1 for 1%).
Under the 'Orders' section, begin filling in your entries. For each 'Order #', enter the Price.
Next, enter the size. You can either fill in the 'Size (USD)' box OR the '/ Shares' box. Leave the one you're not using at 0.
As you add orders, the 'Avg' (yellow) and 'TP' (green) lines, along with the blue order labels, will automatically appear and adjust on your chart!
Who Is This For?
DCA Traders: This is the ultimate tool for you!
Position Traders: Keep track of scaling into a larger position over time.
Manual Backtesters: Quickly simulate and visualize how a series of buys would have played out.
Any Trader who wants a quick and easy way to calculate their average entry without leaving TradingView.
I built this tool to improve my own trading workflow, and I hope it helps you as much as it has helped me. If you find it useful, please consider giving it a 'Like' and feel free to leave any feedback or suggestions in the comments!
Happy trading

Bilateral Filter For Loop [BackQuant]Bilateral Filter For Loop
The Bilateral Filter For Loop is an advanced technical indicator designed to filter out market noise and smooth out price data, thus improving the identification of underlying market trends. It employs a bilateral filter, which is a sophisticated non-linear filter commonly used in image processing and price time series analysis. By considering both spatial and range differences between price points, this filter is highly effective at preserving significant trends while reducing random fluctuations, ultimately making it suitable for dynamic trend-following strategies.
Please take the time to read the following:
Key Features
1. Bilateral Filter Calculation:
The bilateral filter is the core of this indicator and works by applying a weight to each data point based on two factors: spatial distance and price range difference. This dual weighting process allows the filter to preserve important price movements while reducing the impact of less relevant fluctuations. The filter uses two primary parameters:
Spatial Sigma (σ_d): This parameter adjusts the weight applied based on the distance of each price point from the current price. A larger spatial sigma means more smoothing, as further away values will contribute more heavily to the result.
Range Sigma (σ_r): This parameter controls how much weight is applied based on the difference in price values. Larger price differences result in smaller weights, while similar price values result in larger weights, thereby preserving the trend while filtering out noise.
The output of this filter is a smoothed version of the original price series, which eliminates short-term fluctuations, helping traders focus on longer-term trends. The bilateral filter is applied over a rolling window, adjusting the level of smoothing dynamically based on both the distance between values and their relative price movements.
2. For Loop Calculation for Trend Scoring:
A for-loop is used to calculate the trend score based on the filtered price data. The loop compares the current value to previous values within the specified window, scoring the trend as follows:
+1 for upward movement (when the filtered value is greater than the previous value).
-1 for downward movement (when the filtered value is less than the previous value).
The cumulative result of this loop gives a continuous trend score, which serves as a directional indicator for the market's momentum. By summing the scores over the window period, the loop provides an aggregate value that reflects the overall trend strength. This score helps determine whether the market is experiencing a strong uptrend, downtrend, or sideways movement.
3. Long and Short Conditions:
Once the trend score has been calculated, it is compared against predefined threshold levels:
A long signal is generated when the trend score exceeds the upper threshold, indicating that the market is in a strong uptrend.
A short signal is generated when the trend score crosses below the lower threshold, signaling a potential downtrend or trend reversal.
These conditions provide clear signals for potential entry points, and the color-coding helps traders quickly identify market direction:
Long signals are displayed in green.
Short signals are displayed in red.
These signals are designed to provide high-confidence entries for trend-following strategies, helping traders capture profitable movements in the market.
4. Trend Background and Bar Coloring:
The script offers customizable visual settings to enhance the clarity of the trend signals. Traders can choose to:
Color the bars based on the trend direction: Bars are colored green for long signals and red for short signals.
Change the background color to provide additional context: The background will be shaded green for a bullish trend and red for a bearish trend. This visual feedback helps traders to stay aligned with the prevailing market sentiment.
These features offer a quick visual reference for understanding the market's direction, making it easier for traders to identify when to enter or exit positions.
5. Threshold Lines for Visual Feedback:
Threshold lines are plotted on the chart to represent the predefined long and short levels. These lines act as clear markers for when the market reaches a critical threshold, triggering a potential buy (long) or sell (short) signal. By showing these threshold lines on the chart, traders can quickly gauge the strength of the market and assess whether the trend is strong enough to warrant action.
These thresholds can be adjusted based on the trader's preferences, allowing them to fine-tune the indicator for different market conditions or asset behaviors.
6. Customizable Parameters for Flexibility:
The indicator offers several parameters that can be adjusted to suit individual trading preferences:
Window Period (Bilateral Filter): The window size determines how many past price values are used to calculate the bilateral filter. A larger window increases smoothing, while a smaller window results in more responsive, but noisier, data.
Spatial Sigma (σ_d) and Range Sigma (σ_r): These values control how sensitive the filter is to price changes and the distance between data points. Fine-tuning these parameters allows traders to adjust the degree of noise reduction applied to the price series.
Threshold Levels: The upper and lower thresholds determine when the trend score crosses into long or short territory. These levels can be customized to better match the trader's risk tolerance or asset characteristics.
Visual Settings: Traders can customize the appearance of the chart, including the line width of trend signals, bar colors, and background shading, to make the indicator more readable and aligned with their charting style.
7. Alerts for Trend Reversals:
The indicator includes alert conditions for real-time notifications when the market crosses the defined thresholds. Traders can set alerts to be notified when:
The trend score crosses the long threshold, signaling an uptrend.
The trend score crosses the short threshold, signaling a downtrend.
These alerts provide timely information, allowing traders to take immediate action when the market shows a significant change in direction.
Final Thoughts
The Bilateral Filter For Loop indicator is a robust tool for trend-following traders who wish to reduce market noise and focus on the underlying trend. By applying the bilateral filter and calculating trend scores, this indicator helps traders identify strong uptrends and downtrends, providing reliable entry signals with minimal market noise. The customizable parameters, visual feedback, and alerting system make it a versatile tool for traders seeking to improve their timing and capture profitable market movements.
Thus following all of the key points here are some sample backtests on the 1D Chart
Disclaimer: Backtests are based off past results, and are not indicative of the future.
INDEX:BTCUSD
INDEX:ETHUSD
CRYPTO:SOLUSD

Trailing Stop Loss [TradingFinder] 4 Machine Learning Methods🔵 Introduction
The trailing stop indicator dynamically adjusts stop-loss (SL) levels to lock in profits as price moves favorably. It uses pivot levels and ATR to set optimal SL points, balancing risk and reward.
Trade confirmation filters, a key feature, ensure entries align with market conditions, reducing false signals. In 2023 a study showed filtered entries improve win rates by 15% in forex. This enhances trade precision.
SL settings, ranging from very tight to very wide, adapt to volatility via ATR calculations. These settings anchor SL to previous pivot levels, ensuring alignment with market structure. This caters to diverse trading styles, from scalping to swing trading.
The indicator colors the profit zone between the entry point (EP) and SL, using light green for buy trades and light red for sell trades. This visual cue highlights profit potential. It’s ideal for traders seeking dynamic risk management.
A table displays real-time trade details, including EP, SL, and profit/loss (PNL). Backtests show trailing stops cut losses by 20% in trending markets. This transparency aids decision-making.
🔵 How to Use
🟣 SL Levels
The trailing stop indicator sets SL based on pivot levels and ATR, offering four options: very tight, tight, wide, or very wide. Very tight SLs suit scalpers, while wide SLs fit swing traders. Select the base level to match your strategy.
If price hits the SL, the trade closes, and the indicator evaluates the next trade using the selected filter. This ensures disciplined trade management. The cycle restarts with a new confirmed entry.
Very tight SLs, set near recent pivots, trigger exits early to minimize risk but limit profits in volatile markets. Wide SLs, shown as farther lines, allow more price movement but increase exposure to losses. Adjust based on ATR and conditions, noting SL breaches open new positions.
🟣 Visualization
The indicator’s visual cues, like colored profit zones, simplify monitoring, with light green showing the profit area from EP to trailed SL. Dashed lines mark entry points, while solid lines track the trailed SL, triggering new positions when breached.
When price moves into profit, the area between EP and SL is colored—light green for longs, light red for shorts. This highlights the profit zone visually. The SL trails price, locking in gains as the trade progresses.
🟣 Filters
Upon trade entry, the indicator requires confirmation via filters like SMA 2x or ADX to validate momentum. Filters reduce false entries, though no guarantee exists for improved outcomes. Monitor price action post-entry for trade validity.
Filters like Momentum or ADX assess trend strength before entry. For example, ADX above 25 confirms strong trends. Choose “none” for unfiltered entries.
🟣 Bullish Alert
For a bullish trade, the indicator opens a long position with a green SL Line (after optional filters), trailing the SL below price. Set alerts to On in the settings for notifications, or Off to monitor manually.
🟣 Bearish Alert
In a bearish trade, the indicator opens a short position with a red SL Line post-confirmation, trailing the SL above price. With alerts On in the settings, it notifies the potential reversal.
🟣 Panel
A table displays all trades’ details, including Win Rates, PNL, and trade status. This real-time data aids in tracking performance. Check the table to assess trade outcomes instantly.
Review the table regularly to evaluate trade performance and adjust settings. Consistent monitoring ensures alignment with market dynamics. This maximizes the indicator’s effectiveness.
🔵 Settings
Length (Default: 10) : Sets the pivot period for calculating SL levels, balancing sensitivity and reliability.
Base Level : Options (“Very tight,” “Tight,” “Wide,” “Very wide”) adjust SL distance via ATR.
Show EP Checkbox : Toggles visibility of the entry point on the chart.
Show PNL : Displays profit/loss data for active and closed trades.
Filter : Options (“none,” “SMA 2x,” “Momentum,” “ADX”) validate trade entries.
🔵 Conclusion
The trailing stop indicator, a dynamic risk management tool, adjusts SLs using pivot levels and ATR. Its confirmation filters reduce false entries, boosting precision. Backtests show 20% loss reduction in trending markets.
Customizable SL settings and visual profit zones enhance usability across trading styles. The real-time table provides clear trade insights, streamlining analysis. It’s ideal for forex, stocks, or crypto.
While filters like ADX improve entry accuracy, no setup guarantees success in all conditions. Contextual analysis, like trend strength, is key. This indicator empowers disciplined, data-driven trading.

Fakeout, Breakout & Trend Switch Detector - TrendPredator FOTrendPredator Fakeout Highlighter (FO)
The TrendPredator Fakeout Highlighter is designed to enhance multi-timeframe trend analysis by identifying key market behaviors that indicate trend strength, weakness, and potential reversals. Inspired by Stacey Burke’s trading approach, this tool focuses on trend-following, momentum shifts, and trader traps, helping traders capitalize on high-probability setups.
At its core, this indicator highlights peak formations—anchor points where price often locks in trapped traders before making decisive moves. These principles align with George Douglas Taylor’s 3-day cycle and Steve Mauro’s BTMM method, making the FO Highlighter a powerful tool for reading market structure. As markets are fractal, this analysis works on any timeframe.
How It Works
The TrendPredator FO highlights key price action signals by coloring candles based on their bias state on the current timeframe.
It tracks four major elements:
Breakout/Breakdown Bars – Did the candle close in a breakout or breakdown relative to the last candle?
Fakeout Bars (Trend Close) – Did the candle break a prior high/low and close back inside, but still in line with the trend?
Fakeout Bars (Counter-Trend Close) – Did the candle break a prior high/low, close back inside, and against the trend?
Switch Bars – Did the candle lose/ reclaim the breakout/down level of the last bar that closed in breakout/down, signalling a possible trend shift?
Reading the Trend with TrendPredator FO
The annotations in this example are added manually for illustration.
- Breakouts → Strong Trend
Multiple candles closing in breakout signal a healthy and strong trend.
- Fakeouts (Trend Close) → First Signs of Weakness
Candles that break out but close back inside suggest a potential slowdown—especially near key levels.
- Fakeouts (Counter-Trend Close) → Stronger Reversal Signal
Closing against the trend strengthens the reversal signal.
- Switch Bars → Momentum Shift
A shift in trend is confirmed when price crosses back through the last closed breakout candles breakout level, trapping traders and fuelling a move in the opposite direction.
- Breakdowns → Trend Reversal Confirmed
Once price breaks away from the peak formation, closing in breakdown, the trend shift is validated.
Customization & Settings
- Toggle individual candle types on/off
- Customize colors for each signal
- Set the number of historical candles displayed
Example Use Cases
1. Weekly Template Analysis
The weekly template is a core concept in Stacey Burke’s trading style. FO highlights individual candle states. With this the state of the trend and the developing weekly template can be evaluated precisely. The analysis is done on the daily timeframe and we are looking especially for overextended situations within a week, after multiple breakouts and for peak formations signalling potential reversals. This is helpful for thesis generation before a session and also for backtesting. The annotations in this example are added manually for illustration.
📈 Example: Weekly Template Analysis snapshot on daily timeframe
2. High Timeframe 5-Star Setup Analysis (Stacey Burke "ain't coming back" ACB Template)
This analysis identifies high-probability trade opportunities when daily breakout or down closes occur near key monthly levels mid-week, signalling overextensions and potentially large parabolic moves. Key signals for this are breakout or down closes occurring on a Wednesday. This is helpful for thesis generation before a session and also for backtesting. The annotations in this example are added manually for illustration. Also an indicator can bee seen on this chart shading every Wednesday to identify the signal.
📉 Example: High Timeframe Setup snapshot
3. Low Timeframe Entry Confirmation
FO helps confirm entry signals after a setup is identified, allowing traders to time their entries and exits more precisely. For this the highlighted Switch and/ or Fakeout bars can be highly valuable.
📊 Example (M15 Entry & Exit): Entry and Exit Confirmation snapshot
📊 Example (M5 Scale-In Strategy): Scaling Entries snapshot
The annotations in this examples are added manually for illustration.
Disclaimer
This indicator is for educational purposes only and does not guarantee profits.
None of the information provided shall be considered financial advice.
Users are fully responsible for their trading decisions and outcomes.

Adaptive Gaussian MA For Loop [BackQuant]Adaptive Gaussian MA For Loop
PLEASE Read the following carefully before applying this indicator to your trading system. Knowing the core logic behind the tools you're using allows you to integrate them into your strategy with confidence and precision.
Introducing BackQuant's Adaptive Gaussian Moving Average For Loop (AGMA FL) — a sophisticated trading indicator that merges the Gaussian Moving Average (GMA) with adaptive volatility to provide dynamic trend analysis. This unique indicator further enhances its effectiveness by utilizing a for-loop scoring mechanism to detect potential shifts in market direction. Let's dive into the components, the rationale behind them, and how this indicator can be practically applied to your trading strategies.
Understanding the Gaussian Moving Average (GMA)
The Gaussian Moving Average (GMA) is a smoothed moving average that applies Gaussian weighting to price data. Gaussian weighting gives more significance to data points near the center of the lookback window, making the GMA particularly effective at reducing noise while maintaining sensitivity to changes in price direction. In contrast to simpler moving averages like the SMA or EMA, GMA provides a more refined smoothing function, which can help traders follow the true trend in volatile markets.
In this script, the GMA is calculated over a defined Calculation Period (default 14), applying a Gaussian filter to smooth out market fluctuations and provide a clearer view of underlying trends.
Adaptive Volatility: A Dynamic Edge
The Adaptive feature in this indicator gives it the ability to adjust its sensitivity based on current market volatility. If the Adaptive option is enabled, the GMA uses a standard deviation-based volatility measure (with a default period of 20) to dynamically adjust the width of the Gaussian filter, allowing the GMA to react faster in volatile markets and more slowly in calm conditions. This dynamic nature ensures that the GMA stays relevant across different market environments.
When the Adaptive setting is disabled, the script defaults to a constant standard deviation value (default 1.0), providing a more stable but less responsive smoothing function.
Why Use Adaptive Gaussian Moving Average?
The Gaussian Moving Average already provides smoother results than standard moving averages, but by adding an adaptive component, the indicator becomes even more responsive to real-time price changes. In fast-moving or highly volatile markets, this adaptation allows traders to react quicker to emerging trends. Conversely, in quieter markets, it reduces over-sensitivity to minor fluctuations, thus lowering the risk of false signals.
For-Loop Scoring Mechanism
The heart of this indicator lies in its for-loop scoring system, which evaluates the smoothed price data (the GMA) over a specified range, comparing it to previous values. This scoring system assigns a numerical value based on whether the current GMA is higher or lower than previous values, creating a trend score.
Long Signals: These are generated when the for-loop score surpasses the Long Threshold (default set at 40), signaling that the GMA is gaining upward momentum, potentially identifying a favorable buying opportunity.
Short Signals: These are triggered when the score crosses below the Short Threshold (default set at -10), indicating that the market may be losing strength and that a selling or shorting opportunity could be emerging.
Thresholds & Customization Options
This indicator offers a high degree of flexibility, allowing you to fine-tune the settings according to your trading style and risk preferences:
Calculation Period: Adjust the lookback period for the Gaussian filter, affecting how smooth or responsive the indicator is to price changes.
Adaptive Mode: Toggle the adaptive feature on or off, allowing the GMA to dynamically adjust based on market volatility or remain consistent with a fixed standard deviation.
Volatility Settings: Control the standard deviation period for adaptive mode, fine-tuning how quickly the GMA responds to shifts in volatility.
For-Loop Settings: Modify the start and end points for the for-loop score calculation, adjusting the depth of analysis for trend signals.
Thresholds for Signals: Set custom long and short thresholds to determine when buy or sell signals should be generated.
Visualization Options: Choose to color bars based on trend direction, plot signal lines, or adjust the background color to reflect current market sentiment visually.
Trading Applications
The Adaptive Gaussian MA For Loop can be applied to a variety of trading styles and markets. Here are some key ways you can use this indicator in practice:
Trend Following: The combination of Gaussian smoothing and adaptive volatility helps traders stay on top of market trends, identifying significant momentum shifts while filtering out noise. The for-loop scoring system enhances this by providing a numerical representation of trend strength, making it easier to spot when a new trend is emerging or when an existing one is gaining strength.
Mean Reversion: For traders looking to capitalize on short-term market corrections, the adaptive nature of this indicator makes it easier to identify when price action is deviating too far from its smoothed trend, allowing for strategic entries and exits based on overbought or oversold conditions.
Swing Trading: With its ability to capture medium-term price movements while avoiding the noise of short-term fluctuations, this indicator is well-suited for swing traders who aim to profit from market reversals or short-to-mid-term trends.
Volatility Management: The adaptive feature allows the indicator to adjust dynamically in volatile markets, ensuring that it remains responsive in times of increased uncertainty while avoiding unnecessary noise in calmer periods. This makes it an effective tool for traders who want to manage risk by staying in tune with changing market conditions.
Final Thoughts
The Adaptive Gaussian MA For Loop is a powerful and flexible indicator that merges the elegance of Gaussian smoothing with the adaptability of volatility-based adjustments. By incorporating a for-loop scoring mechanism, this indicator provides traders with a comprehensive view of market trends and potential trade opportunities.
It’s important to test the settings on historical data and adapt them to your specific trading style, timeframe, and market conditions. As with any technical tool, the AGMA For Loop should be used in conjunction with other indicators and solid risk management practices for the best results.
Thus following all of the key points here are some sample backtests on the 1D Chart
Disclaimer: Backtests are based off past results, and are not indicative of the future.
INDEX:BTCUSD
INDEX:ETHUSD
BINANCE:SOLUSD

Median Kijun-Sen [InvestorUnknown]The Median Kijun-Sen is a versatile technical indicator designed for both trend-following strategies and long-term market valuation. It incorporates various display modes and includes a backtest mode to simulate its performance on historical price action.
Key Features:
1. Trend-Following and Long-Term Valuation:
The indicator is ideal for trend-following strategies, helping traders identify entry and exit points based on the relationship between price and the Kijun-Sen calculated from median price (customizable price source).
With longer-term settings, it can also serve as a valuation tool (in oscillator display mode), assisting in identifying potential overbought or oversold conditions over extended timeframes.
2. Display Modes:
The indicator can be displayed in three main modes, each serving a different purpose:
Overlay Mode : Plots the Median Kijun-Sen directly over the price chart, useful for visualizing trends relative to price action.
Oscillator Mode : Displays the oscillator that compares the current price to the Median Kijun-Sen, providing a clearer signal of trend strength and direction
Backtest Mode : Simulates the performance of the indicator with different settings on historical data, offering traders a way to evaluate its reliability and effectiveness without needing TradingView's built-in strategy tool
3. Backtest Functionality:
The inbuilt backtest mode enables users to evaluate the indicator's performance across historical data by simulating long and short trades. Users can customize the start and end dates for the backtest, as well as specify whether to allow long & short, long only, or short only signals.
This backtest functionality mimics TradingView's strategy feature, allowing users to test the effectiveness of their chosen settings before applying them to live markets.
equity(series int sig, series float r, startDate, string signals, bool endDate_bool) =>
if time >= startDate and endDate_bool
float a = 0
if signals == "Long & Short"
if sig > 0
a := r
else
a := -r
else if signals == "Long Only"
if sig > 0
a := r
else if signals == "Short Only"
if sig < 0
a := -r
else
runtime.error("No Signal Type found")
var float e = na
if na(e )
e := 1
else
e := e * (1 + a)
float r = 0.0
bool endDate_bool = use_endDate ? (time <= endDate ? true : false) : true
float eq = 1.0
if disp_mode == "Backtest Mode"
r := (close - close ) / close
eq := equity(sig, r, startDate, signals, endDate_bool)
4. Hint Table for Pane Suggestions:
An inbuilt hint table guides users on how to best visualize the indicator in different display modes:
For Overlay Mode, it is recommended to use the same pane as the price action.
For Oscillator and Backtest Modes, it is advised to plot them in a separate pane for better clarity.
This table also provides step-by-step instructions on how to move the indicator to a different pane and adjust scaling, making it user-friendly.
Potential Weakness
One of the key drawbacks is the indicator’s tendency to produce false signals during price consolidations, where price action lacks clear direction and may trigger unnecessary trades. This is particularly noticeable in markets with low volatility.
Alerts
The indicator includes alert conditions for when it crosses above or below key levels, enabling traders to receive notifications of LONG or SHORT signals.
Summary
The Median Kijun-Sen is a highly adaptable tool that serves multiple purposes, from trend-following to long-term valuation. With its customizable settings, backtest functionality, and built-in hints, it provides traders with valuable insights into market trends while allowing them to optimize the indicator to their specific strategy.
This versatility, however, comes with the potential weakness of false signals during consolidation phases, so it's most effective in trending markets.

DEMA Adaptive DMI [BackQuant]DEMA Adaptive DMI
PLEASE Read the following, knowing what an indicator does at its core before adding it into a system is pivotal. The core concepts can allow you to include it in a logical and sound manner.
Conceptual Foundation and Innovation
The DEMA Adaptive DMI blends the Double Exponential Moving Average (DEMA) with the Directional Movement Index (DMI) to offer a unique approach to trend-following. By applying DEMA to the high and low prices, this indicator refines the traditional DMI calculation, enhancing its responsiveness to price changes. This results in a more adaptive and timely measure of market trends and momentum, providing traders with a more refined tool for capturing directional movements in the market.
Technical Composition and Calculation
At its core, the DEMA Adaptive DMI calculates the DEMA for both the high and low prices over a user-defined period. This dual application of DEMA serves to smooth out price fluctuations while retaining sensitivity to market movements. The DMI is then derived from the changes in these DEMA values, producing a set of plus and minus directional indicators that reflect the prevailing trend. Additionally, an Average Directional Index (ADX) is computed to measure the strength of the trend, with the entire process being dynamically adjusted based on the DEMA calculations.
DEMA Application:
The DEMA is applied to both high and low prices to reduce lag and provide a smoother representation of price action.
Directional Movement Calculation: The DMI is calculated using the smoothed price changes, resulting in plus and minus indicators that accurately reflect market trends.
ADX Calculation:
The ADX is computed to quantify the strength of the trend, offering traders insight into whether the market is trending strongly or is in a phase of consolidation.
Features and User Inputs The DEMA Adaptive DMI offers a range of customizable options to suit different trading styles and market conditions:
DEMA Calculation Period: Users can set the period for the DEMA calculation, allowing for adjustments based on the desired sensitivity.
DMI Length: The length of the DMI calculation can be adjusted, providing flexibility in how trends are measured.
ADX Smoothing Period: The smoothing period for the ADX can be customized to fine-tune the trend strength measurement.
Divergence Detection: Optional divergence detection features allow traders to spot potential reversals based on the DMI and price action.
Visualization options include static high and low levels to mark extreme DMI thresholds, the ability to color bars according to trend direction, and background hues to highlight overbought and oversold conditions.
Practical Applications
The DEMA Adaptive DMI is particularly effective in markets where trend strength and direction are crucial for successful trading. Traders can leverage this indicator to:
Identify Trend Reversals:
Detect potential trend reversals by monitoring the DMI and ADX in conjunction with divergence signals.
Trend Confirmation:
Use the DEMA-based DMI to confirm the strength and direction of a trend, aiding in the timing of entries and exits.
Strategic Positioning:
The indicator's responsiveness allows traders to position themselves effectively in fast-moving markets, reducing the risk of late entries or exits.
Advantages and Strategic Value
By integrating the DEMA with the DMI, this indicator provides a more adaptive and timely measure of market trends. The reduced lag from the DEMA ensures that traders receive signals that are closely aligned with current market conditions, while the dynamic DMI calculation offers a more accurate representation of trend direction and strength. This makes the DEMA Adaptive DMI a valuable tool for traders looking to enhance their trend-following strategies with a focus on precision and adaptability.
Summary and Usage Tips
The DEMA Adaptive DMI is a sophisticated trend-following indicator that combines the benefits of DEMA and DMI into a single, powerful tool. Traders are encouraged to incorporate this indicator into their trading systems for a more nuanced and responsive approach to trend detection and confirmation. Whether used for identifying trend reversals, confirming trend strength, or strategically positioning in the market, the DEMA Adaptive DMI offers a versatile and reliable solution for trend-following strategies.
Thus following all of the key points here are some sample backtests on the 1D Chart
Disclaimer: Backtests are based off past results, and are not indicative of the future.
INDEX:BTCUSD
INDEX:ETHUSD
BINANCE:SOLUSD

Kalman Hull RSI [BackQuant]Kalman Hull RSI
At its core, this indicator uses a Kalman filter of price, put inside of a hull moving average function (replacing the weighted moving averages) and then using that as a price source for the the RSI, very similar to the Kalman Hull Supertrend just processing price for a different indicator.
This also allows it to make it more adaptive to price and also sensitive to recent price action. This indicator is also mainly built for trend-following systems
PLEASE Read the following, knowing what an indicator does at its core before adding it into a system is pivotal. The core concepts can allow you to include it in a logical and sound manner.
1. What is a Kalman Filter
The Kalman Filter is an algorithm renowned for its efficiency in estimating the states of a linear dynamic system amidst noisy data. It excels in real-time data processing, making it indispensable in fields requiring precise and adaptive filtering, such as aerospace, robotics, and financial market analysis. By leveraging its predictive capabilities, traders can significantly enhance their market analysis, particularly in estimating price movements more accurately.
If you would like this on its own, with a more in-depth description please see our Kalman Price Filter.
OR our Kalman Hull Supertrend
2. Hull Moving Average (HMA) and Its Core Calculation
The Hull Moving Average (HMA) improves on traditional moving averages by combining the Weighted Moving Average's (WMA) smoothness and reduced lag. Its core calculation involves taking the WMA of the data set and doubling it, then subtracting the WMA of the full period, followed by applying another WMA on the result over the square root of the period's length. This methodology yields a smoother and more responsive moving average, particularly useful for identifying market trends more rapidly.
3. Combining Kalman Filter with HMA
The innovative combination of the Kalman Filter with the Hull Moving Average (KHMA) offers a unique approach to smoothing price data. By applying the Kalman Filter to the price source before its incorporation into the HMA formula, we enhance the adaptiveness and responsiveness of the moving average. This adaptive smoothing method reduces noise more effectively and adjusts more swiftly to price changes, providing traders with clearer signals for market entries or exits.
The calculation is like so:
KHMA(_src, _length) =>
f_kalman(2 * f_kalman(_src, _length / 2) - f_kalman(_src, _length), math.round(math.sqrt(_length)))
Use Case
The Kalman Hull RSI is particularly suited for traders who require a highly adaptive indicator that can respond to rapid market changes without the excessive noise associated with typical RSI calculations. It can be effectively used in markets with high volatility where traditional indicators might lag or produce misleading signals.
Application in a Trading System
The Kalman Hull RSI is versatile in application, suitable for:
Trend Identification: Quickly identify potential reversals or confirmations of existing trends.
Overbought/Oversold Conditions: Utilize the dynamic RSI thresholds to pinpoint potential entry and exit points, adapting to current market conditions.
Risk Management: Enhance trading strategies by integrating a more reliable measure of momentum, which can lead to improved stop-loss placements and exit strategies.
Core Calculations and Benefits
Dynamic State Estimation: By applying the Kalman Filter, the indicator continually adjusts its calculations based on incoming price data, providing a real-time, smoothed response to price movements.
Reduced Lag: The integration with HMA significantly reduces lag, offering quicker responses to price changes than traditional moving averages or RSI alone.
Increased Accuracy: The dual filtering effect minimizes the impact of price spikes and noise, leading to more accurate signaling for trades.
Thus following all of the key points here are some sample backtests on the 1D Chart
Disclaimer: Backtests are based off past results, and are not indicative of the future.
INDEX:BTCUSD
INDEX:ETHUSD
BINANCE:SOLUSD
Volatility Adjusted Weighted DEMA [BackQuant]Volatility Adjusted Weighted DEMA
The Volatility Adjusted Weighted Double Exponential Moving Average (VAWDEMA) by BackQuant is a sophisticated technical analysis tool designed for traders seeking to integrate volatility into their moving average calculations. This innovative indicator adjusts the weighting of the Double Exponential Moving Average (DEMA) according to recent volatility levels, offering a more dynamic and responsive measure of market trends.
Primarily, the single Moving average is very noisy, but can be used in the context of strategy development, where as the crossover, is best used in the context of defining a trading zone/ macro uptrend on higher timeframes.
Why Volatility Adjustment is Beneficial
Volatility is a fundamental aspect of financial markets, reflecting the intensity of price changes. A volatility adjustment in moving averages is beneficial because it allows the indicator to adapt more quickly during periods of high volatility, providing signals that are more aligned with the current market conditions. This makes the VAWDEMA a versatile tool for identifying trend strength and potential reversal points in more volatile markets.
Understanding DEMA and Its Advantages
DEMA is an indicator that aims to reduce the lag associated with traditional moving averages by applying a double smoothing process. The primary benefit of DEMA is its sensitivity and quicker response to price changes, making it an excellent tool for trend following and momentum trading. Incorporating DEMA into your analysis can help capture trends earlier than with simple moving averages.
The Power of Combining Volatility Adjustment with DEMA
By adjusting the weight of the DEMA based on volatility, the VAWDEMA becomes a powerful hybrid indicator. This combination leverages the quick responsiveness of DEMA while dynamically adjusting its sensitivity based on current market volatility. This results in a moving average that is both swift and adaptive, capable of providing more relevant signals for entering and exiting trades.
Core Logic Behind VAWDEMA
The core logic of the VAWDEMA involves calculating the DEMA for a specified period and then adjusting its weighting based on a volatility measure, such as the average true range (ATR) or standard deviation of price changes. This results in a weighted DEMA that reflects both the direction and the volatility of the market, offering insights into potential trend continuations or reversals.
Utilizing the Crossover in a Trading System
The VAWDEMA crossover occurs when two VAWDEMAs of different lengths cross, signaling potential bullish or bearish market conditions. In a trading system, a crossover can be used as a trigger for entry or exit points:
Bullish Signal: When a shorter-period VAWDEMA crosses above a longer-period VAWDEMA, it may indicate an uptrend, suggesting a potential entry point for a long position.
Bearish Signal: Conversely, when a shorter-period VAWDEMA crosses below a longer-period VAWDEMA, it might signal a downtrend, indicating a possible exit point or a short entry.
Incorporating VAWDEMA crossovers into a trading strategy can enhance decision-making by providing timely and adaptive signals that account for both trend direction and market volatility. Traders should combine these signals with other forms of analysis and risk management techniques to develop a well-rounded trading strategy.
Alert Conditions For Trading
alertcondition(vwdema>vwdema , title="VWDEMA Long", message="VWDEMA Long - {{ticker}} - {{interval}}")
alertcondition(vwdema

Kalman Hull Supertrend [BackQuant]Kalman Hull Supertrend
At its core, this indicator uses a Kalman filter of price, put inside of a hull moving average function (replacing the weighted moving averages) and then using that as a price source for the supertrend instead of the normal hl2 (high+low/2).
Therefore, making it more adaptive to price and also sensitive to recent price action.
PLEASE Read the following, knowing what an indicator does at its core before adding it into a system is pivotal. The core concepts can allow you to include it in a logical and sound manner.
1. What is a Kalman Filter
The Kalman Filter is an algorithm renowned for its efficiency in estimating the states of a linear dynamic system amidst noisy data. It excels in real-time data processing, making it indispensable in fields requiring precise and adaptive filtering, such as aerospace, robotics, and financial market analysis. By leveraging its predictive capabilities, traders can significantly enhance their market analysis, particularly in estimating price movements more accurately.
If you would like this on its own, with a more in-depth description please see our Kalman Price Filter.
2. Hull Moving Average (HMA) and Its Core Calculation
The Hull Moving Average (HMA) improves on traditional moving averages by combining the Weighted Moving Average's (WMA) smoothness and reduced lag. Its core calculation involves taking the WMA of the data set and doubling it, then subtracting the WMA of the full period, followed by applying another WMA on the result over the square root of the period's length. This methodology yields a smoother and more responsive moving average, particularly useful for identifying market trends more rapidly.
3. Combining Kalman Filter with HMA
The innovative combination of the Kalman Filter with the Hull Moving Average (KHMA) offers a unique approach to smoothing price data. By applying the Kalman Filter to the price source before its incorporation into the HMA formula, we enhance the adaptiveness and responsiveness of the moving average. This adaptive smoothing method reduces noise more effectively and adjusts more swiftly to price changes, providing traders with clearer signals for market entries or exits.
The calculation is like so:
KHMA(_src, _length) =>
f_kalman(2 * f_kalman(_src, _length / 2) - f_kalman(_src, _length), math.round(math.sqrt(_length)))
4. Integration with Supertrend
Incorporating this adaptive price smoothing technique into the Supertrend indicator further enhances its efficiency. The Supertrend, known for its proficiency in identifying the prevailing market trend and providing clear buy or sell signals, becomes even more powerful with an adaptive price source. This integration allows the Supertrend to adjust more dynamically to market changes, offering traders more accurate and timely trading signals.
5. Application in a Trading System
In a trading system, the Kalman Hull Supertrend indicator can serve as a critical component for identifying market trends and generating signals for potential entry and exit points. Its adaptiveness and sensitivity to price changes make it particularly useful for traders looking to minimize lag in signal generation and improve the accuracy of their market trend analysis. Whether used as a standalone tool or in conjunction with other indicators, its dynamic nature can significantly enhance trading strategies.
6. Core Calculations and Benefits
The core of this indicator lies in its sophisticated filtering and averaging techniques, starting with the Kalman Filter's predictive adjustments, followed by the adaptive smoothing of the Hull Moving Average, and culminating in the trend-detecting capabilities of the Supertrend. This multi-layered approach not only reduces market noise but also adapts to market volatility more effectively. Benefits include improved signal accuracy, reduced lag, and the ability to discern trend changes more promptly, offering traders a competitive edge.
Thus following all of the key points here are some sample backtests on the 1D Chart
Disclaimer: Backtests are based off past results, and are not indicative of the future.
INDEX:BTCUSD
INDEX:ETHUSD
BINANCE:SOLUSD

DEMA RSI Overlay [BackQuant]DEMA RSI Overlay
PLEASE Read the following, knowing what an indicator does at its core before adding it into a system is pivotal. The core concepts can allow you to include it in a logical and sound manner.
Anyways,
BackQuant's new trading indicator that blends the Double Exponential Moving Average (DEMA) with the Relative Strength Index (RSI) to create a unique overlay on the trading chart. This combination is not arbitrary; both the DEMA and RSI are revered for their distinct advantages in trading strategy development. Let's delve into the core components of this script, the rationale behind choosing DEMA and RSI, the logic of long and short signals, and its practical trading applications.
Understanding DEMA
DEMA is an enhanced version of the conventional exponential moving average that aims to reduce the lag inherent in traditional averages. It does this by applying more weight to recent prices. The reduction in lag makes DEMA an excellent tool for tracking price trends more closely. In the context of this script, DEMA serves as the foundation for the RSI calculation, offering a smoother and more responsive signal line that can provide clearer trend indications.
Why DEMA?
DEMA is chosen for its responsiveness to price changes. This characteristic is particularly beneficial in fast-moving markets where entering and exiting positions quickly is crucial. By using DEMA as the price source, the script ensures that the signals generated are timely and reflective of the current market conditions, reducing the risk of entering or exiting a trade based on outdated information.
Integrating RSI
The RSI, a momentum oscillator, measures the speed and change of price movements. It oscillates between zero and 100 and is typically used to identify overbought or oversold conditions. In this script, the RSI is calculated based on DEMA, which means it inherits the responsiveness of DEMA, allowing traders to spot potential reversals or continuation signals sooner.
Why RSI?
Incorporating RSI offers a measure of price momentum and market conditions relative to past performance. By setting thresholds for long (buy) and short (sell) signals, the script uses RSI to identify potential turning points in the market, providing traders with strategic entry and exit points.
Calculating Long and Short Signals
Long Signals : These are generated when the RSI of the DEMA crosses above the longThreshold (set at 70 by default) and the closing price is not above the upper volatility band. This suggests that the asset is gaining upward momentum while not being excessively overbought, presenting a potentially favorable buying opportunity.
Short Signals : Generated when the RSI of the DEMA falls below the shortThreshold (set at 55 by default). This indicates that the asset may be losing momentum or entering a downtrend, signaling a possible selling or shorting opportunity.
Logical Soundness
The logic of combining DEMA with RSI for generating trade signals is sound for several reasons:
Timeliness : The use of DEMA ensures that the price source for RSI calculation is up-to-date, making the momentum signals more relevant.
Balance : By setting distinct thresholds for long and short signals, the script balances sensitivity and specificity, aiming to minimize false signals while capturing genuine market movements.
Adaptability : The inclusion of user inputs for periods and thresholds allows traders to customize the indicator to fit various trading styles and timeframes.
Trading Use-Cases
This DEMA RSI Overlay indicator is versatile and can be applied across different markets and timeframes. Its primary use-cases include:
Trend Following: Traders can use it to identify the start of a new trend or the continuation of an existing trend.
Swing Trading: The indicator's sensitivity to price changes makes it ideal for swing traders looking to capitalize on short to medium-term price movements.
Risk Management: By providing clear long and short signals, it helps traders manage their positions more effectively, potentially reducing the risk of significant losses.
Final Note
We have also decided to add in the option of standard deviation bands, calculated on the DEMA, this can be used as a point of confluence rendering trading ranges. Expanding when volatility is high and compressing when it is low.
For example:
This provides the user with a 1, 2, 3 standard deviation band of the DEMA.
Thus following all of the key points here are some sample backtests on the 1D Chart
Disclaimer: Backtests are based off past results, and are not indicative of the future.
INDEX:BTCUSD
INDEX:ETHUSD
BINANCE:SOLUSD
Kalman Filtered RSI Oscillator [BackQuant]Kalman Filtered RSI Oscillator
The Kalman Filtered RSI Oscillator is BackQuants new free indicator designed for traders seeking an advanced, empirical approach to trend detection and momentum analysis. By integrating the robustness of a Kalman filter with the adaptability of the Relative Strength Index (RSI), this tool offers a sophisticated method to capture market dynamics. This indicator is crafted to provide a clearer, more responsive insight into price trends and momentum shifts, enabling traders to make informed decisions in fast-moving markets.
Core Principles
Kalman Filter Dynamics:
At its core, the Kalman Filtered RSI Oscillator leverages the Kalman filter, renowned for its efficiency in predicting the state of linear dynamic systems amidst uncertainties. By applying it to the RSI calculation, the tool adeptly filters out market noise, offering a smoothed price source that forms the basis for more accurate momentum analysis. The inclusion of customizable parameters like process noise, measurement noise, and filter order allows traders to fine-tune the filter’s sensitivity to market changes, making it a versatile tool for various trading environments.
RSI Adaptation:
The RSI is a widely used momentum oscillator that measures the speed and change of price movements. By integrating the RSI with the Kalman filter, the oscillator not only identifies the prevailing trend but also provides a smoothed representation of momentum. This synergy enhances the indicator's ability to signal potential reversals and trend continuations with a higher degree of reliability.
Advanced Smoothing Techniques:
The indicator further offers an optional smoothing feature for the RSI, employing a selection of moving averages (HMA, THMA, EHMA, SMA, EMA, WMA, TEMA, VWMA) for traders seeking to reduce volatility and refine signal clarity. This advanced smoothing mechanism is pivotal for traders looking to mitigate the effects of short-term price fluctuations on the RSI's accuracy.
Empirical Significance:
Empirically, the Kalman Filtered RSI Oscillator stands out for its dynamic adjustment to market conditions. Unlike static indicators, the Kalman filter continuously updates its estimates based on incoming price data, making it inherently more responsive to new market information. This dynamic adaptation, combined with the RSI's momentum analysis, offers a powerful approach to understanding market trends and momentum with a depth not available in traditional indicators.
Trend Identification and Momentum Analysis:
Traders can use the Kalman Filtered RSI Oscillator to identify strong trends and momentum shifts. The color-coded RSI columns provide immediate visual cues on the market's direction and strength, aiding in quick decision-making.
Optimal for Various Market Conditions:
The flexibility in tuning the Kalman filter parameters makes this indicator suitable for a wide range of assets and market conditions, from volatile to stable markets. Traders can adjust the settings based on empirical testing to find the optimal configuration for their trading strategy.
Complementary to Other Analytical Tools:
While powerful on its own, the Kalman Filtered RSI Oscillator is best used in conjunction with other analytical tools and indicators. Combining it with volume analysis, price action patterns, or other trend-following indicators can provide a comprehensive view of the market, allowing for more nuanced and informed trading decisions.
The Kalman Filtered RSI Oscillator is a groundbreaking tool that marries empirical precision with advanced trend analysis techniques. Its innovative use of the Kalman filter to enhance the RSI's performance offers traders an unparalleled ability to navigate the complexities of modern financial markets. Whether you're a novice looking to refine your trading approach or a seasoned professional seeking advanced analytical tools, the Kalman Filtered RSI Oscillator represents a significant step forward in technical analysis capabilities.
Thus following all of the key points here are some sample backtests on the 1D Chart
Disclaimer: Backtests are based off past results, and are not indicative of the future.
INDEX:BTCUSD
INDEX:ETHUSD
BINANCE:SOLUSD

ICT Judas Swing | Flux Charts💎 GENERAL OVERVIEW
Introducing our new ICT Judas Swing Indicator! This indicator is built around the ICT's "Judas Swing" strategy. The strategy looks for a liquidity grab around NY 9:30 session and a Fair Value Gap for entry confirmation. For more information about the process, check the "HOW DOES IT WORK" section.
Features of the new ICT Judas Swing :
Implementation of ICT's Judas Swing Strategy
2 Different TP / SL Methods
Customizable Execution Settings
Customizable Backtesting Dashboard
Alerts for Buy, Sell, TP & SL Signals
📌 HOW DOES IT WORK ?
The strategy begins by identifying the New York session from 9:30 to 9:45 and marking recent liquidity zones. These liquidity zones are determined by locating high and low pivot points: buyside liquidity zones are identified using high pivots that haven't been invalidated, while sellside liquidity zones are found using low pivots. A break of either buyside or sellside liquidity must occur during the 9:30-9:45 session, which is interpreted as a liquidity grab by smart money. The strategy assumes that after this liquidity grab, the price will reverse and move in the opposite direction. For entry confirmation, a fair value gap (FVG) in the opposite direction of the liquidity grab is required. A buyside liquidity grab calls for a bearish FVG, while a sellside grab requires a bullish FVG. Based on the type of FVG—bullish for buys and bearish for sells—the indicator will then generate a Buy or Sell signal.
After the Buy or Sell signal, the indicator immediately draws the take-profit (TP) and stop-loss (SL) targets. The indicator has three different TP & SL modes, explained in the "Settings" section of this write-up.
You can set up alerts for entry and TP & SL signals, and also check the current performance of the indicator and adjust the settings accordingly to the current ticker using the backtesting dashboard.
🚩 UNIQUENESS
This indicator is an all-in-one suit for the ICT's Judas Swing concept. It's capable of plotting the strategy, giving signals, a backtesting dashboard and alerts feature. Different and customizable algorithm modes will help the trader fine-tune the indicator for the asset they are currently trading. Three different TP / SL modes are available to suit your needs. The backtesting dashboard allows you to see how your settings perform in the current ticker. You can also set up alerts to get informed when the strategy is executable for different tickers.
⚙️ SETTINGS
1. General Configuration
Swing Length -> The swing length for pivot detection. Higher settings will result in
FVG Detection Sensitivity -> You may select between Low, Normal, High or Extreme FVG detection sensitivity. This will essentially determine the size of the spotted FVGs, with lower sensitivies resulting in spotting bigger FVGs, and higher sensitivies resulting in spotting all sizes of FVGs.
2. TP / SL
TP / SL Method ->
a) Dynamic: The TP / SL zones will be auto-determined by the algorithm based on the Average True Range (ATR) of the current ticker.
b) Fixed : You can adjust the exact TP / SL ratios from the settings below.
Dynamic Risk -> The risk you're willing to take if "Dynamic" TP / SL Method is selected. Higher risk usually means a better winrate at the cost of losing more if the strategy fails. This setting is has a crucial effect on the performance of the indicator, as different tickers may have different volatility so the indicator may have increased performance when this setting is correctly adjusted.

ICT Unicorn | Flux Charts💎 GENERAL OVERVIEW
Introducing our new ICT Unicorn Indicator! This indicator is built around the ICT's "Unicorn" strategy. The strategy uses Breaker Blocks and Fair Value Gaps for entry confirmation. For more information about the process, check the "HOW DOES IT WORK" section.
Features of the new ICT Unicorn Indicator :
Implementation of ICT's Unicorn Strategy
Toggleable Retracement Entry Method
3 Different TP / SL Methods
Customizable Execution Settings
Customizable Backtesting Dashboard
Alerts for Buy, Sell, TP & SL Signals
📌 HOW DOES IT WORK ?
The ICT Unicorn entry model merges the concepts of Breaker Blocks and Fair Value Gaps (FVGs), offering a distinct method for identifying trade opportunities. By integrating these two elements, we can have a position entry with stop-loss and take-profit targets on the potential support & resistance zones. This model is particularly reliable for trade entry, as it combines two powerful entry techniques.
An ICT Unicorn Model consists of a FVG which is overlapping with a Breaker Block of the same type. Here is an example :
When a FVG overlaps with a Breaker Block of the same type, the indicator gives a Buy or Sell signal depending on the FVG type (Bullish & Bearish). If the "Require Retracement" option is enabled in the settings, the signals are not given immediately. Instead, the current price of the ticker will need to touch the FVG once more before the signals are given.
After the Buy or Sell signal, the indicator immediately draws the take-profit (TP) and stop-loss (SL) targets. The indicator has three different TP & SL modes, explained in the "Settings" section of this write-up.
You can set up alerts for entry and TP & SL signals, and also check the current performance of the indicator and adjust the settings accordingly to the current ticker using the backtesting dashboard.
🚩 UNIQUENESS
This indicator is an all-in-one suit for the ICT's Unicorn concept. It's capable of plotting the strategy, giving signals, a backtesting dashboard and alerts feature. Different and customizable algorithm modes will help the trader fine-tune the indicator for the asset they are currently trading. Three different TP / SL modes are available to suit your needs. The backtesting dashboard allows you to see how your settings perform in the current ticker. You can also set up alerts to get informed when the strategy is executable for different tickers.
⚙️ SETTINGS
1. General Configuration
FVG Detection Sensitivity -> You may select between Low, Normal, High or Extreme FVG detection sensitivity. This will essentially determine the size of the spotted FVGs, with lower sensitivies resulting in spotting bigger FVGs, and higher sensitivies resulting in spotting all sizes of FVGs.
Swing Length -> Swing length is used when finding order block formations. Smaller values will result in finding smaller order & breaker blocks.
Require Retracement ->
a) Disabled : The entry signal is given immediately once a FVG overlaps with a Breaker Block of the same type.
b) Enabled : The current price of the ticker will need to touch the FVG once more before the entry signal is given.
2. TP / SL
TP / SL Method ->
a) Unicorn : This is the default option. The SL will be set to the lowest low of the last 100 bars with an extra offset in a Buy signal. For Sell signals, the SL will be set to the highest high of the last 100 bars with an extra offset. The TP is then set to a value using the SL value and maintaining a risk-reward ratio.
b) Dynamic: The TP / SL zones will be auto-determined by the algorithm based on the Average True Range (ATR) of the current ticker.
c) Fixed : You can adjust the exact TP / SL ratios from the settings below.
Dynamic Risk -> The risk you're willing to take if "Dynamic" TP / SL Method is selected. Higher risk usually means a better winrate at the cost of losing more if the strategy fails. This setting is has a crucial effect on the performance of the indicator, as different tickers may have different volatility so the indicator may have increased performance when this setting is correctly adjusted.

Market Structure & Liquidity: CHoCHs+Nested Pivots+FVGs+Sweeps//Purpose:
This indicator combines several tools to help traders track and interpret price action/market structure; It can be divided into 4 parts;
1. CHoCHs, 2. Nested Pivot highs & lows, 3. Grade sweeps, 4. FVGs.
This gives the trader a toolkit for determining market structure and shifts in market structure to help determine a bull or bear bias, whether it be short-term, med-term or long-term.
This indicator also helps traders in determining liquidity targets: wether they be voids/gaps (FVGS) or old highs/lows+ typical sweep distances.
Finally, the incorporation of HTF CHoCH levels printing on your LTF chart helps keep the bigger picture in mind and tells traders at a glance if they're above of below Custom HTF CHoCH up or CHoCH down (these HTF CHoCHs can be anything from Hourly up to Monthly).
//Nomenclature:
CHoCH = Change of Character
STH/STL = short-term high or low
MTH/MTL = medium-term high or low
LTH/LTL = long-term high or low
FVG = Fair value gap
CE = consequent encroachement (the midline of a FVG)
~~~ The Four components of this indicator ~~~
1. CHoCHs:
•Best demonstrated in the below charts. This was a method taught to me by @Icecold_crypto. Once a 3 bar fractal pivot gets broken, we count backwards the consecutive higher lows or lower highs, then identify the CHoCH as the opposite end of the candle which ended the consecutive backwards count. This CHoCH (UP or DOWN) then becomes a level to watch, if price passes through it in earnest a trader would consider shifting their bias as market structure is deemed to have shifted.
•HTF CHoCHs: Option to print Higher time frame chochs (default on) of user input HTF. This prints only the last UP choch and only the last DOWN choch from the input HTF. Solid line by default so as to distinguish from local/chart-time CHoCHs. Can be any Higher timeframe you like.
•Show on table: toggle on show table(above/below) option to show in table cells (top right): is price above the latest HTF UP choch, or is price below HTF DOWN choch (or is it sat between the two, in a state of 'uncertainty').
•Most recent CHoCHs which have not been met by price will extend 10 bars into the future.
• USER INPUTS: overall setting: SHOW CHOCHS | Set bars lookback number to limit historical Chochs. Set Live CHoCHs number to control the number of active recent chochs unmet by price. Toggle shrink chochs once hit to declutter chart and minimize old chochs to their origin bars. Set Multi-timeframe color override : to make Color choices auto-set to your preference color for each of 1m, 5m, 15m, H, 4H, D, W, M (where up and down are same color, but 'up' icon for up chochs and down icon for down chochs remain printing as normal)
2. Nested Pivot Highs & Lows; aka 'Pivot Highs & Lows (ST/MT/LT)'
•Based on a seperate, longer lookback/lookforward pivot calculation. Identifies Pivot highs and lows with a 'spikeyness' filter (filtering out weak/rounded/unimpressive Pivot highs/lows)
•by 'nested' I mean that the pivot highs are graded based on whether a pivot high sits between two lower pivot highs or vice versa.
--for example: STH = normal pivot. MTH is pivot high with a lower STH on either side. LTH is a pivot high with a lower MTH on either side. Same applies to pivot lows (STL/MTL/LTL)
•This is a useful way to measure the significance of a high or low. Both in terms of how much it might be typically swept by (see later) and what it would imply for HTF bias were we to break through it in earnest (more than just a sweep).
• USER INPUTS: overall setting: show pivot highs & lows | Bars lookback (historical pivots to show) | Pivots: lookback/lookforward length (determines the scale of your pivot highs/lows) | toggle on/off Apply 'Spikeyness' filter (filters out smooth/unimpressive pivot highs/lows). Set Spikeyness index (determines the strength of this filter if turned on) | Individually toggle on each of STH, MTH, LTH, STL, MTL, LTL along with their label text type , and size . Toggle on/off line for each of these Pivot highs/lows. | Set label spacer (atr multiples above / below) | set line style and line width
3. Grade Sweeps:
•These are directly related to the nested pivots described above. Most assets will have a typical sweep distance. I've added some of my expected sweeps for various assets in the indicator tooltips.
--i.e. Eur/Usd 10-20-30 pips is a typical 'grade' sweep. S&P HKEX:5 - HKEX:10 is a typical grade sweep.
•Each of the ST/MT/LT pivot highs and lows have optional user defined grade sweep boxes which paint above until filled (or user option for historical filled boxes to remain).
•Numbers entered into sweep input boxes are auto converted into appropriate units (i.e. pips for FX, $ or 'handles' for indices, $ for Crypto. Very low $ units can be input for low unit value crypto altcoins.
• USER INPUTS: overall setting: Show sweep boxes | individually select colors of each of STH, MTH, LTH, STL, MTL, LTL sweep boxes. | Set Grade sweep ($/pips) number for each of ST, MT, LT. This auto converts between pips and $ (i.e. FX vs Indices/Crypto). Can be a float as small or large as you like ($0.000001 to HKEX:1000 ). | Set box text position (horizontal & vertical) and size , and color . | Set Box width (bars) (for non extended/ non-auto-terminating at price boxes). | toggle on/off Extend boxes/lines right . | Toggle on/off Shrink Grade sweeps on fill (they will disappear in realtime when filled/passed through)
4. FVGs:
•Fair Value gaps. Represent 'naked' candle bodies where the wicks to either side do not meet, forming a 'gap' of sorts which has a tendency to fill, or at least to fill to midline (CE).
•These are ICT concepts. 'UP' FVGS are known as BISIs (Buyside imbalance, sellside inefficiency); 'DOWN' FVGs are known as SIBIs (Sellside imbalance, buyside inefficiency).
• USER INPUTS: overall setting: show FVGs | Bars lookback (history). | Choose to display: 'UP' FVGs (BISI) and/or 'DOWN FVGs (SIBI) . Choose to display the midline: CE , the color and the line style . Choose threshold: use CE (as opposed to Full Fill) |toggle on/off Shrink FVG on fill (CE hit or Full fill) (declutter chart/see backtesting history)
////••Alerts (general notes & cautionary notes)::
•Alerts are optional for most of the levels printed by this indicator. Set them via the three dots on indicator status line.
•Due to dynamic repainting of levels, alerts should be used with caution. Best use these alerts either for Higher time frame levels, or when closely monitoring price.
--E.g. You may set an alert for down-fill of the latest FVG below; but price will keep marching up; form a newer/higher FVG, and the alert will trigger on THAT FVG being down-filled (not the original)
•Available Alerts:
-FVG(BISI) cross above threshold(CE or full-fill; user choice). Same with FVG(SIBI).
-HTF last CHoCH down, cross below | HTF last CHoCH up, cross above.
-last CHoCH down, cross below | last CHoCH up, cross above.
-LTH cross above, MTH cross above, STH cross above | LTL cross below, MTL cross below, STL cross below.
////••Formatting (general)::
•all table text color is set from the 'Pivot highs & Lows (ST, MT, LT)' section (for those of you who prefer black backgrounds).
•User choice of Line-style, line color, line width. Same with Boxes. Icon choice for chochs. Char or label text choices for ST/MT/LT pivot highs & lows.
////••User Inputs (general):
•Each of the 4 components of this indicator can be easily toggled on/off independently.
•Quite a lot of options and toggle boxes, as described in full above. Please take your time and read through all the tooltips (hover over '!' icon) to get an idea of formatting options.
•Several Lookback periods defined in bars to control how much history is shown for each of the 4 components of this indicator.
•'Shrink on fill' settings on FVGs and CHoCHs: Basically a way to declutter chart; toggle on/off depending on if you're backtesting or reading live price action.
•Table Display: applies to ST/MT/LT pivot highs and to HTF CHoCHs; Toggle table on or off (in part or in full)
////••Credits:
•Credit to ICT (Inner Circle Trader) for some of the concepts used in this indicator (FVGS & CEs; Grade sweeps).
•Credit to @Icecold_crypto for the specific and novel concept of identifying CHoCHs in a simple, objective and effective manner (as demonstrated in the 1st chart below).
CHoCH demo page 1: shifting tweak; arrow diagrams to demonstrate how CHoCHs are defined:
CHoCH demo page 2: Simplified view; short lookback history; few CHoCHs, demo of 'latest' choch being extended into the future by 10 bars:
USAGE: Bitcoin Hourly using HTF daily CHoCHs:
USAGE-2: Cotton Futures (CT1!) 2hr. Painting a rather bullish picture. Above HTF UP CHoCH, Local CHoCHs show bullish order flow, Nice targets above (MTH/LTH + grade sweeps):
Full Demo; 5min chart; CHoCHs, Short term pivot highs/lows, grade sweeps, FVGs:
Full Demo, Eur/Usd 15m: STH, MTH, LTH grade sweeps, CHoCHs, Usage for finding bias (part A):
Full Demo, Eur/Usd 15m: STH, MTH, LTH grade sweeps, CHoCHs, Usage for finding bias, 3hrs later (part B):
Realtime Vs Backtesting(A): btc/usd 15m; FVGs and CHoCHs: shrink on fill, once filled they repaint discreetly on their origin bar only. Realtime (Shrink on fill, declutter chart):
Realtime Vs Backtesting(B): btc/usd 15m; FVGs and CHoCHs: DON'T shrink on fill; they extend to the point where price crosses them, and fix/paint there. Backtesting (seeing historical behaviour):
