All Moving AveragesHello guys .
This indicator is for those who need more than three to averages.
If you like, I can add Ichimoku too.
Support me with your likes.
thanks all.
In den Scripts nach "averages" suchen


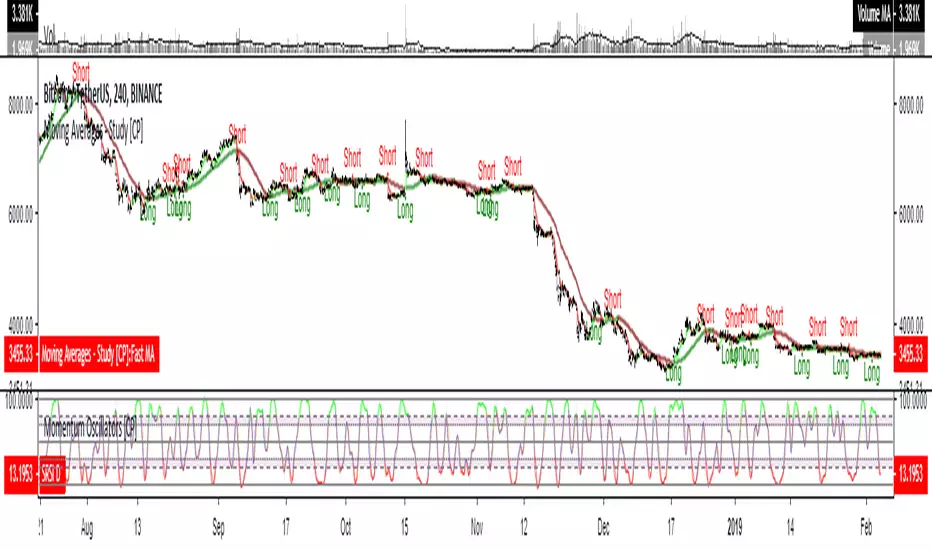
Moving Averages - Study [CP]A basic toolbox of Moving Averages.
Crossover of MA's will result in opening a long or short position
Following MA's included:
* Simple MA
* Exponential MA
* Weighted MA
* Volume Weighted MA
* Smoothed MA
* Double EMA
* Triple EMA
* Laguerre MA
* Symetrically Weighted MA
* Hull MA
* Zero Lag EMA
* Triangular MA
* SuperSmoother MA
* Jurik MA
This version has the alerts for Long and Short signals!
Moving Averages - Strategy [CP]A basic toolbox of Moving Averages.
Crossover of MA's will result in opening a long or short position
Following MA's included:
* Simple MA
* Exponential MA
* Weighted MA
* Volume Weighted MA
* Smoothed MA
* Double EMA
* Triple EMA
* Laguerre MA
* Symetrically Weighted MA
* Hull MA
* Zero Lag EMA
* Triangular MA
* SuperSmoother MA

Trend Trader AVR This is plots the indicator developed by Andrew Abraham
in the Trading the Trend article of TASC September 1998
It was modified, result values wass averages.

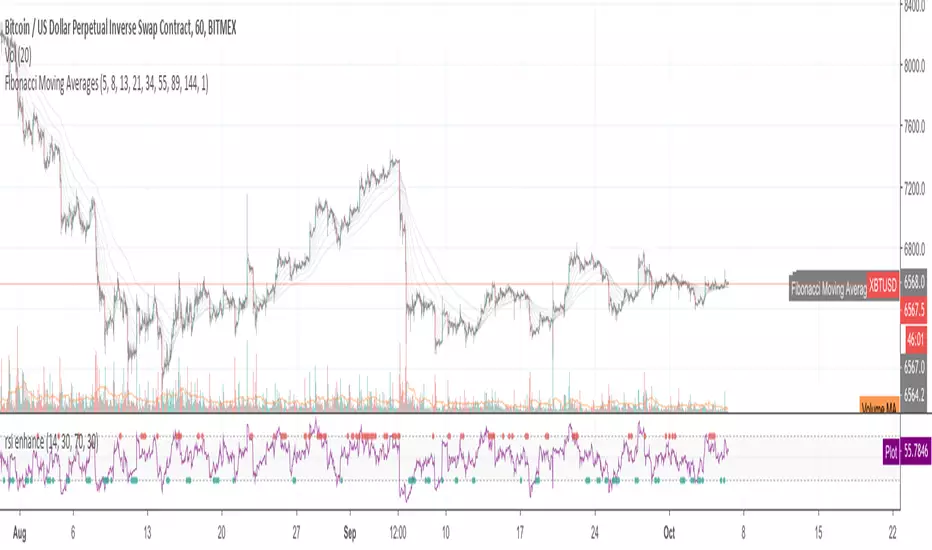
Fibonacci Moving AveragesFibonacci Moving Averages.
use 5、8、13、21、34、55、89、144.
support sma, ema, zeroloag ema.
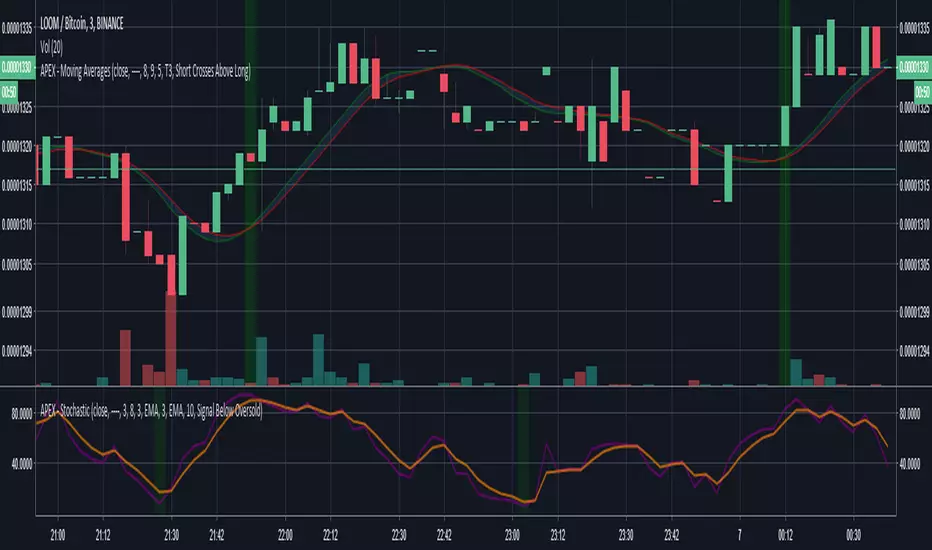
APEX - Moving AveragesAPEX Specific Script with moving averages.
Except Price Crosses Above Long / Short all triggers work perfectly i will look into this on the weekend.
4 Moving averages by ClefsphereDisplays 4 different moving averages.
Customizable input.
Coded with latest PineScript version 3.
Hope you find this idea helpful.
Don't forget to ’Like’ or Follow if you enjoy this post.
Thanks for your interest and support!
For more information and to request for use this script, go to: marketcast.wordpress.com
Disclaimer: This information is not trading advice and is for educational purposes only. Past performance is not a guarantee of future results.

Multiple Moving Averages [clean]Very simple indicator script to display multiple simple moving averages. I know others have made this but they often are too feature-rich and can get cluttered.
Can optionally show a cross when MA 1 crosses MA 3. These are colors such that when MA 1 crosses BELOW MA 3 a red cross is shown, and green when crossing above.

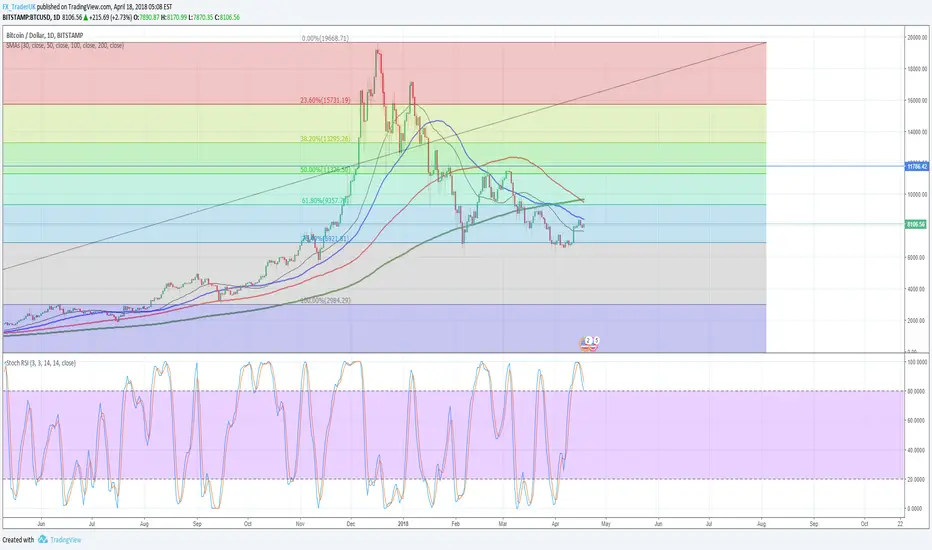
Triple Simple Moving Averages (50,100,200)Used to identify ideal entry points for stocks based on moving averages.


Moving Averages Bundle (EMA/SMA)Ver.4 (4/25/18)
EMA and SMA indicators ALL in one!
Default: SMA (20, 50, 100, 200) or EMA (8, 13, 21, 55)
Save your TV indicator use counts by using SMA/EMA
Functionality all in one indicator:
1) Toggle between Exponential or Simple moving averages.
2) Customize and or input your very own MA's by simply changing the input options from default.
3) Change color combos.
4) Turn off/on only the SMA/EMA's that you require.

30, 50, 100 and 200 Day Simple Moving AveragesEasy to Use to see 30, 50, 100 and 200 Day Simple Moving Averages.
NG [All Moving Averages]Collection of some of the best moving averages.
I've tried to collect them all but TV became so slow, that it was completely unusable.
So i left only those that performs best on various backtest systems.

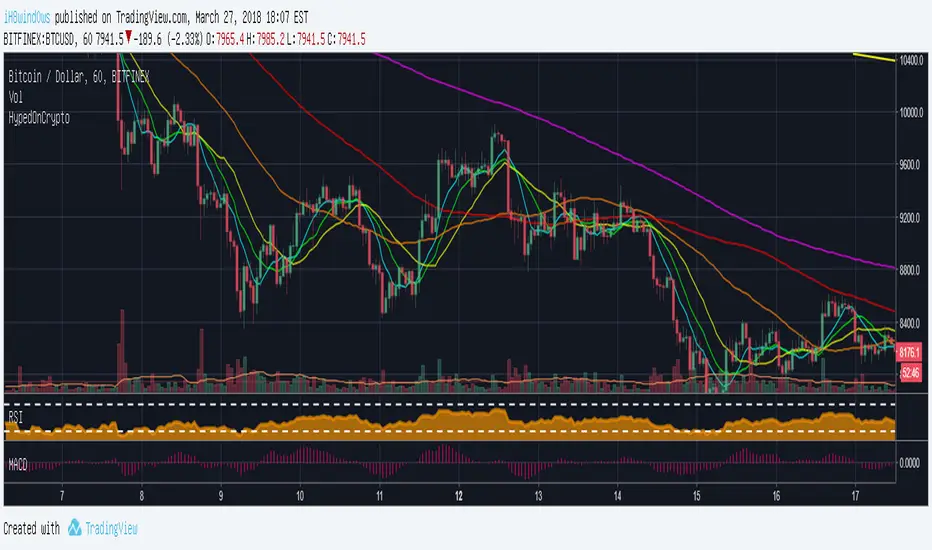
Six Simple Moving Averages by HypedOnCrypto For those who use the free version and want to use more than 3 moving averages.
I wish you all a good Trade.
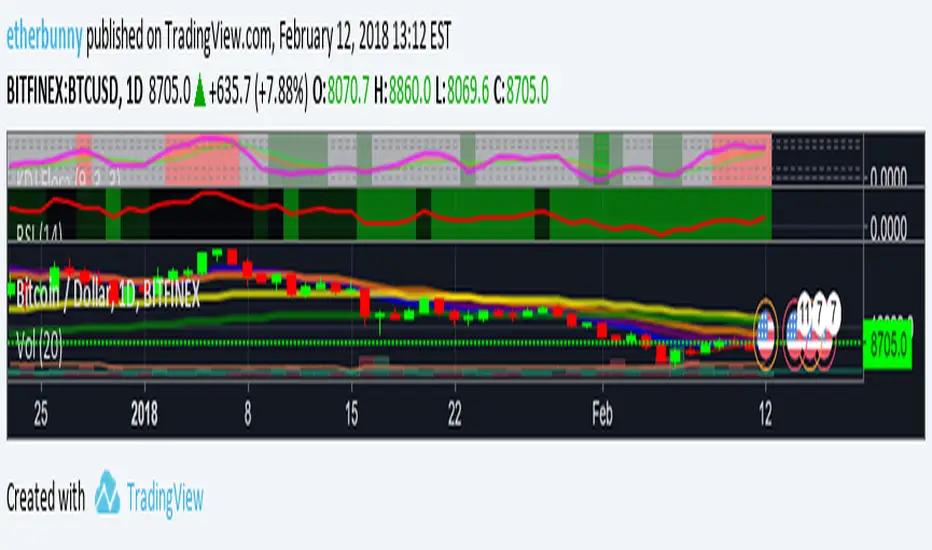
Exponential Moving Averages [etherbunny]This plots the 8, 13, 21, 55 and 100 day exponential moving averages.
Super Guppy MMA [MFWIC]I compiled the new and improved Guppy Multiple Moving Averages. Hope it has some value. Plan your trade and trade your plan!

Multi Timeframe Moving AveragesThe Multi Timeframe Moving Averages indicator is a powerful tool for technical analysis that allows traders to visualize and analyze moving averages from multiple timeframes on a single chart. This can be helpful for identifying trends, support and resistance levels, and potential entry and exit points.
The indicator is highly customizable, allowing traders to choose the number of moving averages to plot, the timeframe for each moving average, and the color and style of each line. Traders can also choose to plot the moving averages as solid lines, dashed lines, or filled bands.
The indicator also includes a number of additional features, such as:
The ability to plot standard deviations around the moving averages
The ability to display a table of all the moving averages on the chart
The ability to draw arrows on the chart to indicate when prices cross the moving averages
The Multi Timeframe Moving Averages indicator can be used by traders of all experience levels and is a valuable tool for any technical trader's arsenal.
EXAMPLE USAGE
One way to use the Multi Timeframe Moving Averages indicator is to identify trends. If the moving averages on all timeframes are sloping in the same direction, then the market is likely trending in that direction. For example, if the 50-day, 100-day, and 200-day moving averages are all sloping upwards, then the market is likely in a bullish trend.
Another way to use the Multi Timeframe Moving Averages indicator is to identify support and resistance levels. Moving averages can act as both support and resistance levels, depending on the direction of the trend. For example, if the market is in a bullish trend, then the 50-day moving average can act as a support level. If the market price falls below the 50-day moving average, it could signal a potential reversal of the trend.
The Multi Timeframe Moving Averages indicator can also be used to identify potential entry and exit points. For example, a trader could enter a long position when the price crosses above the 50-day moving average and exit the position when the price crosses below the 200-day moving average.
BOLLINGER BANDS SIGNAL
For every available timeframe, if prices bounce off the lower band and cross above their moving average, the upper band becomes the upper price target. A crossing below the moving average would identify the lower band as the downside target. In a strong uptrend, prices will usually fluctuate between the upper band and the average. In that case, a crossing below the average warns of a trend reversal to the downside.
USER INPUT SETTINGS
The elements below reflect the indicator’s settings menu structure:
Near Hit % : Reduce/increase target distance by setting them closer/further away from the band. This is a percentage of the distance between the moving average and its bands.
Gradient (Size & Style) : if on, plots a customizable gradient of colors instead of lines to represent standard deviations. Each color can be changed in the Moving Average Settings” section of the settings menu
Arrows (width & Shift) : if on, will display arrow-shaped lines at the right of the real-time bar. After an MA crossover/crossunder, the arrow starts at the moving average and ends at the corresponding band until the target gets hit.
Backtest Table (Location & Size) : if on, shows a timeframe screener table. Use “Small” as a Size for better mobile screen displays. This table allows you to see active targets and their directions across every timeframe. The table also displays the weighted average (%) of Hit targets signals, from the chart's timeframe point of view to all other timeframes.
St. Dev. (length & Mult.) : Bollinger Bands / Standard deviation lookback period & multiplier
Trade Labels : off by default, highlight crossovers, crossunders, and target hit with a label numbered with its corresponding moving average from the settings menu: MA01, MA02, etc.
Moving Averages : Show/hide plotted Moving Averages Lines
Moving Average Settings (plotted)
These are the 5 moving averages and corresponding bands that can be plotted on the chart. For each of those, you can customize their timeframes, types (SMA, EMA, etc.), and lookback periods
Other Moving Averages (no plots)
Similar to the above, these moving averages will reflect on the vertical arrows and inside the table
CONCLUSION
The Multi Timeframe Moving Averages indicator is a powerful tool for technical analysis that can be used to identify trends, support and resistance levels, and potential entry and exit points. The indicator is highly customizable and includes a number of additional features, such as the ability to plot standard deviations and display a table of all the moving averages on the chart. The Multi Timeframe Moving Averages indicator is a valuable tool for any technical trader's arsenal.

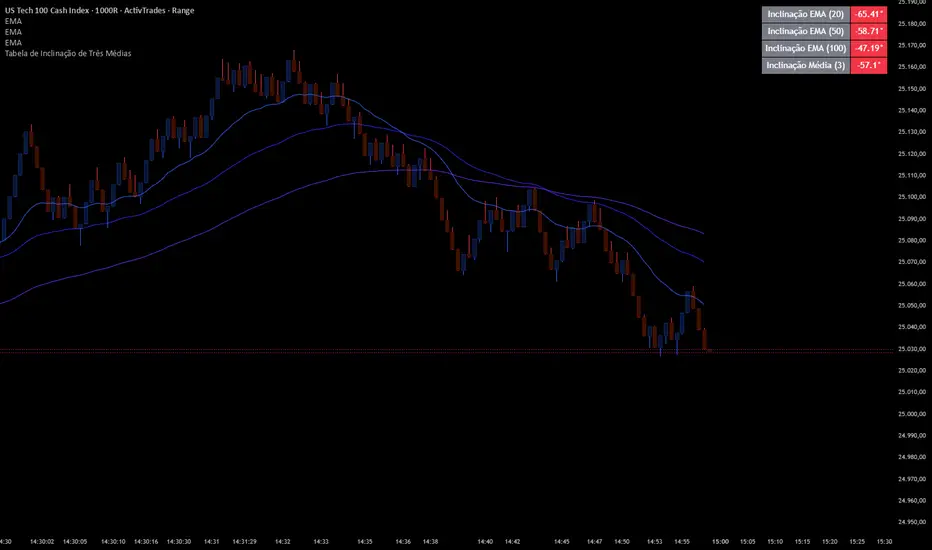
Slope Averages
📊 Indicator Overview: Three Moving Averages Slope Table
This indicator is designed to calculate and display the slopes and averages of three different moving averages (MAs) in a table format. It helps traders quickly visualize the direction and strength of multiple moving averages, as well as their combined averages, across different timeframes.
⚙️ Inputs and Configuration
• MA Type 1, 2, 3: Choose the type of moving average for each line. Options:
• (Exponential Moving Average)
• (Simple Moving Average)
• (Weighted Moving Average)
• (Volume-Weighted Moving Average)
• (a custom smoother using multiple EMAs)
• Length 1, 2, 3: Periods for each moving average (e.g., 20, 50, 100).
• Source: The price source used (default = ).
• Extra Timeframes (optional): You can configure up to 3 additional timeframes (e.g., 1h, 4h, Daily) to compare the combined average across different chart periods.
🔧 Functions Explained
1. tilson(src, length)
• A custom moving average that smooths price using 8 sequential EMAs.
• Produces a smoother line than a standard EMA.
2. getMA(src, length, maType)
• Selects the correct moving average type based on user input.
• Returns the chosen MA value.
3. Slope Calculation
• Each slope is calculated as:
• This converts the difference between current and previous MA values into an angle in degrees.
• Positive slope = upward trend, negative slope = downward trend.
4. Combined Slopes
• : Average slope of all three MAs.
• , , : Average slopes of pairs of MAs.
5. Combined Averages
• : Average of MA1 and MA2.
• : Average of MA2 and MA3.
• : Average of MA1 and MA3.
• : Average of all three MAs.
6. Color Function
• : Returns green if value ≥ 0, red if value < 0.
• Used to color table cells for quick visual feedback.
📋 Table Output
The table shows:
1. Individual slopes of MA1, MA2, MA3.
2. Average slope of all three.
3. Combined averages (M1+M2, M2+M3, M1+M3).
4. Combined slopes of pairs.
5. Overall average .
6. Optional: RSI or multi-timeframe averages can also be added.
Each value cell is colored green if positive, red if negative, making it easy to spot bullish or bearish conditions.
🎯 How to Use It
• Trend Strength: Look at the slope values. Steeper positive slopes = stronger uptrend; steep negative slopes = stronger downtrend.
• Confluence: When all three MAs and their combined averages point in the same direction, it signals strong trend alignment.
• Multi-Timeframe Analysis: Configure extra timeframes to see if short-term and long-term averages agree. If they align, confidence in the trend increases.
• RSI Integration (optional): Add RSI to confirm momentum. For example, bullish slope + RSI > 50 = stronger buy signal.
✅ Practical Example
• MA1 = EMA(20), MA2 = SMA(50), MA3 = WMA(100).
• If slope1, slope2, slope3 are all positive and green, and is also green → strong bullish trend.
• If slopes are mixed (some green, some red), the market is consolidating.
• If all slopes are red and is red → strong bearish trend.
Fibonacci Moving Averages [UkutaLabs]█ OVERVIEW
The Fibonacci Moving Averages are a toolkit which allows the user to configure different types of Moving Averages based on key Fibonacci numbers.
Moving Averages are used to visualise short-term and long-term support and resistance which can be used as a signal where price might continue or retrace. Moving Averages serve as a simple yet powerful tool that can help traders in their decision-making and help foster a sense of where the price might be moving next.
The aim of this script is to simplify the trading experience of users by automatically displaying a series of useful Moving Averages, allowing the user to easily configure multiple at once depending on their trading style.
█ USAGE
This script will automatically plot 5 Moving Averages, each with a period of a key Fibonacci Level (5, 8, 13, 21 and 34).
Both the Source and Type of the Moving Averages can be configured by the user (see all options below under SETTINGS), making this a versatile trading tool that can provide value in a wide variety of trading styles.
█ SETTINGS
Configuration
• MA Source: Determines the source of the Moving Averages (open, high, low, close, hl2, hlc3, ohlc4, hlcc4)
• MA Source: Determines the type of the Moving Averages (SMA, EMA, VWMA, WMA, HMA, RMA)
Colors
• 5: Determines the color of the 5 period Moving Average
• 8: Determines the color of the 8 period Moving Average
• 13: Determines the color of the 13 period Moving Average
• 21: Determines the color of the 21 period Moving Average
• 34: Determines the color of the 34 period Moving Average

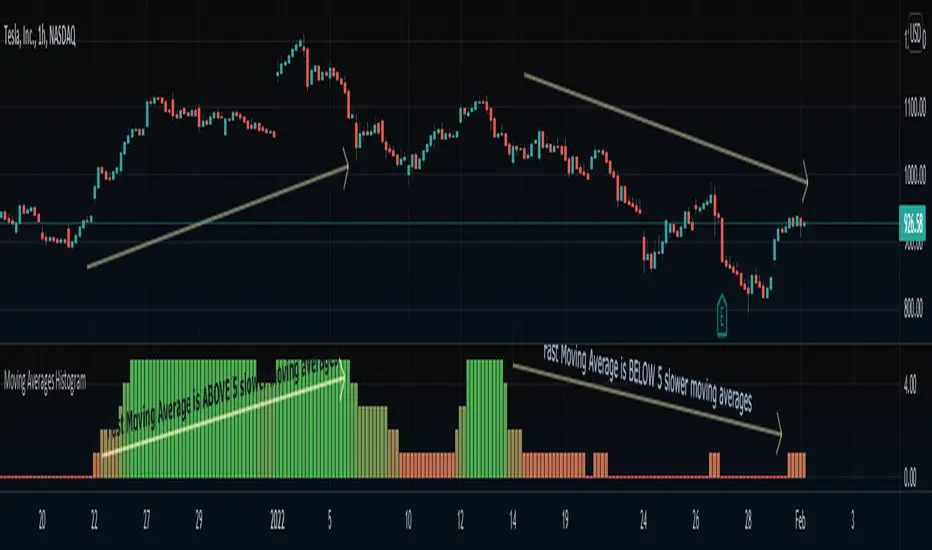
Moving Averages HistogramAn interesting idea is to simplify the display of whether ONE fast-moving average crosses FIVE other slower-moving averages using just a histogram.
The idea is to increase the step counter by 1 every time a fast-moving average crosses OVER one of the five slower-moving averages until reaching 5 (highest value) and decrease the step counter by 1 every time the fast-moving average crosses UNDER each one of the five slower moving averages until reaching 0 (lowest value of the histogram).
=== Cut To Chase ===
If the histogram is at the top value 5 (green), it means the FAST moving average is ABOVE ALL slower-moving averages, Hench, the asset is up trending.
If the histogram is at the bottom value 0 (red), it means the FAST moving average is BELOW ALL slower-moving averages, Hench, the asset is down trending.
If the histogram is in the midways between 0 to 5, it means the FAST moving average is starting to cross the slower moving averages which could lead to a trend reversal, up or down, it depends on the direction of the crossing.
=== Notes ===
You can change from a variety of moving averages like RMA, EMA, ALMA, HMA, and so on.
You can reduce the number of slow-moving averages by placing the same length.
You can visualize the moving averages in case you want to see how it works behind, by going to settings and clicking 'Show MA lines'.
Every moving average length can be modified inside settings.
Note that the fast-moving average should have the lowest length.
You can visualize how the moving average is plotted:
Moving Averages Linear CombinatorLinearly combining moving averages can provide relatively interesting results such as a low-lagging moving averages or moving averages able to produce more pertinent crosses with the price.
As a remainder, a linear combination is a mathematical expression that is based on the multiplication of two variables (or terms) with two coefficients (also called scalars when working with vectors) and adding the results, that is:
ax + by
This expression is a linear combination , with x/y as variables and a/b as coefficients. Lot of indicators are made from linear combinations of moving averages, some examples include the double/triple exponential moving average, least squares moving average and the hull moving average.
Today proposed indicator allow the user to combine many types of moving averages together in order to get different results, we will introduce each settings of the indicator as well as how they affect the final output.
Explaining The Effects Of Linear Combinations
There are various ways to explain why linear combination can produce low-lagging moving averages, lets take for example the linear combination of a fast SMA of period p/2 and slow simple moving average of period p , the linear combination of these two moving averages is described as follows:
MA = 2SMA(p/2) + -1SMA(p)
Which is equivalent to:
MA = 2SMA(p/2) - SMA(p) = SMA(p/2) + SMA(p/2) - SMA(p)
We can see the above linear combinations consist in adding a bandpass filter to the fast moving average, which of course allow to reduce the lag. It is important to note that lag is reduced when the first moving average term is more reactive than the second moving average term. In case we instead use:
MA = -2SMA(p/2) + 1SMA(p)
we would have a combination between a low-pass and band-reject filter.
The Indicator
The indicator is based on the following linear combination:
Coeff × LeadingMA(length) - (Coeff-1) × LaggingMA(length)
The length setting control both moving averages period, leading control the type of moving average used as leading MA, while lagging control the type of MA used as lagging moving average, in order to get low lag results the leading MA should be more reactive than the lagging MA. Coeff control the coefficients of the linear combination, with higher values of coeff amplifying the effects of the linear combination, negative values of coeff would make a low-lag moving average become a lagging moving average, coeff = 1 return the leading MA, coeff = -1 return the lagging MA. The leading period divisor allow to divide the period of the leading MA by the selected number.
The types of moving average available are: simple, exponentially weighted, triangular, least squares, hull and volume weighted. The lagging MA allow you to select another MA on the chart as input.
length = 100, leading period divisor = 2, coeff = 2, with both MA type = SMA. Using coeff = -2 instead would give:
You can select "Plot leading and lagging" in order to show the leading and lagging MA.
Conclusion
The proposed tool allow the user to create a custom moving averages by making use of linear combination. The script is not that useful when you think about it, and might maybe be one of my worst, as it is relatively impractical, not proud of it, but it still took time to make so i decided to post it anyway.

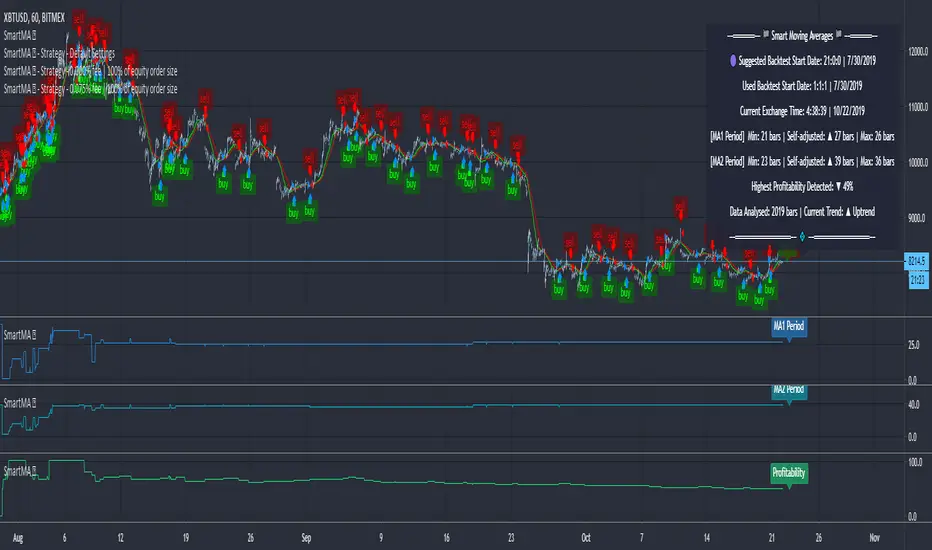
Moving Averages (Self-Adjusting Param for Highest Profitability)Moving Averages (Self-Adjusting Parameters for Highest Profitability)
It is a dual moving average crossover system - Smart Moving Averages .
Moving averages are used to identify current price developments and the potential for a change in an established trend.
The crossover in a dual moving average system can be used as a trigger to buy or to sell an asset, or as a trend reversal indication.
The crossover occurrence depends on the periods for which the moving averages are calculated. Using constant period values may not bring the best results.
The Smart Moving Averages change their periods automatically to get the highest profitability .
The concept is similar to the Smart SuperTrend .
Features:
• Self-Adjusting Period parameters
• The graphs for Profitability, Moving Average 1 Period, Moving Average 2 Period and the Moving Averages themselves are available to choose for display from the indicator settings
• A chart layout can be made just for the Smart Moving Averages, having all the graphs nicely displayed
• Alerts for changes in Trend, Moving Average 1 Period, Moving Average 2 Period, Profitability
• Different types of Moving Averages are available to choose from in the indicator settings (SMA, EMA, RMA, WMA, VWMA, DEMA, TEMA, HullMA, TMA).
The range for Moving Average 1 Period, Moving Average 2 Period and Time can be changed in the indicator settings (suggested optimal values are displayed on the chart).
This affects the loading speed (smaller range, faster to load), as well as the accuracy of the signals.
The indicator switches to the most profitable Moving Average 1 Period and Moving Average 2 Period parameters automatically, in real-time.
It scans across the entire historical data made available by TradingView.
The Smart Moving Average system works on all timeframes and symbols available on TradingView.
Exception for when the Volume Weighted Moving Average is used - it doesn't work for symbols without volume data.
It does not repaint!
But several aspects must be considered:
- 1. TradingView periodically removes access to old data while giving access to new data in real-time.
____ The frequency depends on the timeframe, amount of data. It can happen daily for second charts, weekly for minute charts.
____ Since the Indicator wouldn't have access to that old data anymore, the Profitability may change its value, causing a certain degree of repainting.
- 2. The starting time for Backtest must be inserted in the settings panel.
____ As long as the starting time has available price data, the Smart Moving Averages will NOT get repainted.
____ A suggested starting date for the analysis is shown on the chart. Insert the date in the indicator settings.
This indicator is compatible with the Wrapper Module of the Risk Management System indicator, which means they can work together as a trading bot.