Point and Figure (PnF) Moving Averages HistogramThis is live and non-repainting Point and Figure Chart Moving Average Histogram tool. The script has it’s own P&F engine and not using integrated function of Trading View.
Point and Figure method is over 150 years old. It consist of columns that represent filtered price movements. Time is not a factor on P&F chart but as you can see with this script P&F chart created on time chart.
P&F chart provide several advantages, some of them are filtering insignificant price movements and noise, focusing on important price movements and making support/resistance levels much easier to identify.
Moving averages on Point & Figure charts are based on the average price of each column while bar chart moving averages are based closing price. Average Price means (ClosePrice + OpenPrice) / 2.
Because of there is double smoothing, you should use shorter lengths for moving averages. Double smoothing means: using average price smooths once, using length greater than 2 smooths price second time.
If you are new to Point & Figure Chart then you better get some information about it before using this tool. There are very good web sites and books. Please PM me if you need help about resources.
Options in the Script
Box size is one of the most important part of Point and Figure Charting. Chart price movement sensitivity is determined by the Point and Figure scale. Large box sizes see little movement across a specific price region, small box sizes see greater price movement on P&F chart. There are four different box scaling with this tool: Traditional, Percentage, Dynamic (ATR), or User-Defined
4 different methods for Box size can be used in this tool.
User Defined: The box size is set by user. A larger box size will result in more filtered price movements and fewer reversals. A smaller box size will result in less filtered price movements and more reversals.
ATR: Box size is dynamically calculated by using ATR, default period is 20.
Percentage: uses box sizes that are a fixed percentage of the stock's price. If percentage is 1 and stock’s price is $100 then box size will be $1
Traditional: uses a predefined table of price ranges to determine what the box size should be.
Price Range Box Size
Under 0.25 0.0625
0.25 to 1.00 0.125
1.00 to 5.00 0.25
5.00 to 20.00 0.50
20.00 to 100 1.0
100 to 200 2.0
200 to 500 4.0
500 to 1000 5.0
1000 to 25000 50.0
25000 and up 500.0
Default value is “ATR”, you may use one of these scaling method that suits your trading strategy.
If ATR or Percentage is chosen then there is rounding algorithm according to mintick value of the security. For example if mintick value is 0.001 and box size (ATR/Percentage) is 0.00124 then box size becomes 0.001.
And also while using dynamic box size (ATR or Percentage), box size changes only when closing price changed.
Reversal : It is the number of boxes required to change from a column of Xs to a column of Os or from a column of Os to a column of Xs. Default value is 3 (most used). For example if you choose reversal = 2 then you get the chart similar to Renko chart.
Source: Closing price or High-Low prices can be chosen as data source for P&F charting.
Options for P&F Bollinger Bands:
MA Type: MA type can be EMA or SMA
MA Source: Moving averages on P&F charts are based on the average price of each column. Bar chart moving averages are based on each close price. Average price means “(ClosePrice + OpenPrice) / 2”. You can choose Close Price or Average Price as source. Default is Average Price.
Fast MA Length : Length of Fast Moving average, shorter length than Slow MA
Slow MA Length : Length of Slow Moving average, greater length than Slow MA
There are alerts when Fast MA Crossed over/under Slow MA conditions. While adding alert “Once Per Bar Close” option should be chosen.
In den Scripts nach "averages" suchen

5 Exponential Moving Averages5 Exponential Moving Averages:
8, 13, 21 - fast EMAs: enter when price touches one of them if all of them are parallel
55 - medium EMA: short/medium term trend (if the fast EMAs are above, trend is bullish; if the fast EMAs are below, trend is bearish)
200 - long term EMA: long term trend (if the fast and medium EMAs are above, trend is bullish; if the fast and medium EMAs are below, trend is bearish)
Moving averages cross strategy:
- when the moving averages cross, wait for the price to re-tag the slower one, then enter on market structure breakout (M/W/triangles)
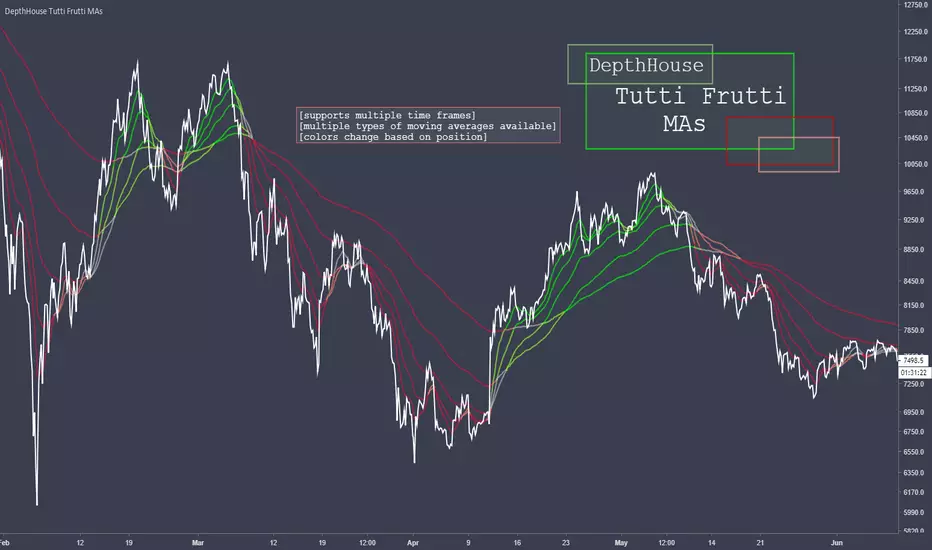
DepthHouse Tutti Frutti Moving AveragesDepthHouse Tutti Frutti Moving Averages combines the use of up to 5 Moving Averages that change colors based upon their position.
This indicator has full MTF support (multiple-time-frame). Meaning you can lock the moving averages to a specific time frame.
Currently Supported MA types:
SMA
EMA
SMMA
Hull MA
WMA
Multiple Time Frame Option
My favorite feature is the ability to lock the displayed moving averages to a specific time frame.
Say you wish to view the 30 min chart while keeping the 60 minute moving averages. Just turn this feature on!
This is a free indicator so please enjoy!
Leave questions and requests in the comments below!
GR-Multiple Moving AveragesA simple indicator that contains all the main Moving Averages you'll probably need.
This indicator can be used on any time frame you wish.
The default periods for the moving averages are 5, 10, 20, 50, 100 & 200.
However you can set these values to whatever works for you, for example 5, 8, 10, 21, etc.
Please let me know in the comments below which values you use the most, so that I can adjust the defaults accordingly.
The lines get darker and thinker the more periods the MA covers.
You can easily adjust the colours of the lines and their thickness too.
The current colours seem to work OK on both the light and dark TradingView themes, but please do make suggestions for better default value.
You can also choose between 7 different ways of calculating the moving averages:
!None = You don't want to see this line
SMA ( Simple Moving Average )
EMA ( Exponential Moving Average )
WMA ( Weighted Moving Average )
DEMA ( Double Exponential Moving Average )
TEMA (Triple Moving Average
HMA ( Hull Moving Average )
Comments and suggestions are most welcome.
I'm available for hire to create custom indicators or to work on more complex projects.

Multiple Moving AveragesA simple indicator that contains all the main Moving Averages you'll probably need.
This indicator can be used on any time frame you wish.
The default periods for the moving averages are 5, 10, 20, 50, 100 & 200.
However you can set these values to whatever works for you, for example 5, 8, 10, 21, etc.
Please let me know in the comments below which values you use the most, so that I can adjust the defaults accordingly.
The lines get darker and thinker the more periods the MA covers.
You can easily adjust the colours of the lines and their thickness too.
The current colours seem to work OK on both the light and dark TradingView themes, but please do make suggestions for better default value.
You can also choose between 7 different ways of calculating the moving averages:
!None = You don't want to see this line
SMA (Simple Moving Average)
EMA (Exponential Moving Average)
WMA (Weighted Moving Average)
DEMA (Double Exponential Moving Average)
TEMA (Triple Moving Average
HMA (Hull Moving Average)
Comments and suggestions are most welcome.
I'm available for hire to create custom indicators or to work on more complex projects.

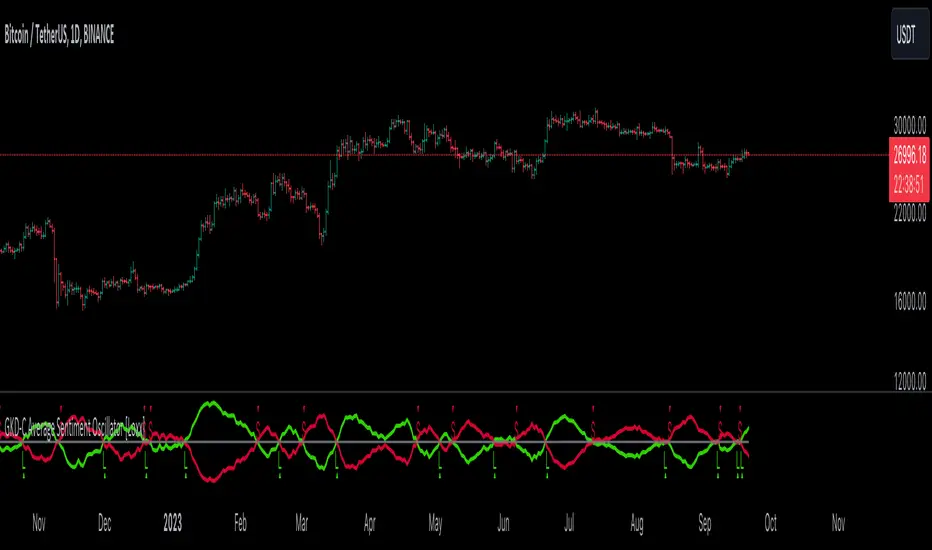
GKD-C Average Sentiment Oscillator [Loxx]The Giga Kaleidoscope GKD-C Average Sentiment Oscillator is a confirmation module included in Loxx's "Giga Kaleidoscope Modularized Trading System."
█ GKD-C Average Sentiment Oscillator
This is an older forx indicator from 2010 and represents an advancement in the formula in the sentiment meter called "FX Multimeter III." It's recommended as a precise method for assessing the sentiment over a specific candlestick duration, suitable for trend filtering or determining entry/exit points.
The oscillator merges two similar algorithms, each with a unique application:
Individual Bar Analysis: This method evaluates the bullish or bearish nature of each bar through OHLC prices, and then averages the percentages over a specified bar group (e.g., 10 bars) to derive the final sentiment percentage. While it provides a detailed intra-bar sentiment, it tends to be more volatile.
Grouped Bar Analysis: This approach views the group of bars as a singular unit, determining the sentiment based on the OHLC values of the entire group. It delivers a more consistent outcome and emphasizes broader price movement ranges.
Within the indicator settings, users can opt for these algorithms independently as Mode 1 and Mode 2, or combine them under Mode 0.
█ Giga Kaleidoscope Modularized Trading System
Core components of an NNFX algorithmic trading strategy
The NNFX algorithm is built on the principles of trend, momentum, and volatility. There are six core components in the NNFX trading algorithm:
1. Volatility - price volatility; e.g., Average True Range, True Range Double, Close-to-Close, etc.
2. Baseline - a moving average to identify price trend
3. Confirmation 1 - a technical indicator used to identify trends
4. Confirmation 2 - a technical indicator used to identify trends
5. Continuation - a technical indicator used to identify trends
6. Volatility/Volume - a technical indicator used to identify volatility/volume breakouts/breakdown
7. Exit - a technical indicator used to determine when a trend is exhausted
8. Metamorphosis - a technical indicator that produces a compound signal from the combination of other GKD indicators*
*(not part of the NNFX algorithm)
What is Volatility in the NNFX trading system?
In the NNFX (No Nonsense Forex) trading system, ATR (Average True Range) is typically used to measure the volatility of an asset. It is used as a part of the system to help determine the appropriate stop loss and take profit levels for a trade. ATR is calculated by taking the average of the true range values over a specified period.
True range is calculated as the maximum of the following values:
-Current high minus the current low
-Absolute value of the current high minus the previous close
-Absolute value of the current low minus the previous close
ATR is a dynamic indicator that changes with changes in volatility. As volatility increases, the value of ATR increases, and as volatility decreases, the value of ATR decreases. By using ATR in NNFX system, traders can adjust their stop loss and take profit levels according to the volatility of the asset being traded. This helps to ensure that the trade is given enough room to move, while also minimizing potential losses.
Other types of volatility include True Range Double (TRD), Close-to-Close, and Garman-Klass
What is a Baseline indicator?
The baseline is essentially a moving average, and is used to determine the overall direction of the market.
The baseline in the NNFX system is used to filter out trades that are not in line with the long-term trend of the market. The baseline is plotted on the chart along with other indicators, such as the Moving Average (MA), the Relative Strength Index (RSI), and the Average True Range (ATR).
Trades are only taken when the price is in the same direction as the baseline. For example, if the baseline is sloping upwards, only long trades are taken, and if the baseline is sloping downwards, only short trades are taken. This approach helps to ensure that trades are in line with the overall trend of the market, and reduces the risk of entering trades that are likely to fail.
By using a baseline in the NNFX system, traders can have a clear reference point for determining the overall trend of the market, and can make more informed trading decisions. The baseline helps to filter out noise and false signals, and ensures that trades are taken in the direction of the long-term trend.
What is a Confirmation indicator?
Confirmation indicators are technical indicators that are used to confirm the signals generated by primary indicators. Primary indicators are the core indicators used in the NNFX system, such as the Average True Range (ATR), the Moving Average (MA), and the Relative Strength Index (RSI).
The purpose of the confirmation indicators is to reduce false signals and improve the accuracy of the trading system. They are designed to confirm the signals generated by the primary indicators by providing additional information about the strength and direction of the trend.
Some examples of confirmation indicators that may be used in the NNFX system include the Bollinger Bands, the MACD (Moving Average Convergence Divergence), and the MACD Oscillator. These indicators can provide information about the volatility, momentum, and trend strength of the market, and can be used to confirm the signals generated by the primary indicators.
In the NNFX system, confirmation indicators are used in combination with primary indicators and other filters to create a trading system that is robust and reliable. By using multiple indicators to confirm trading signals, the system aims to reduce the risk of false signals and improve the overall profitability of the trades.
What is a Continuation indicator?
In the NNFX (No Nonsense Forex) trading system, a continuation indicator is a technical indicator that is used to confirm a current trend and predict that the trend is likely to continue in the same direction. A continuation indicator is typically used in conjunction with other indicators in the system, such as a baseline indicator, to provide a comprehensive trading strategy.
What is a Volatility/Volume indicator?
Volume indicators, such as the On Balance Volume (OBV), the Chaikin Money Flow (CMF), or the Volume Price Trend (VPT), are used to measure the amount of buying and selling activity in a market. They are based on the trading volume of the market, and can provide information about the strength of the trend. In the NNFX system, volume indicators are used to confirm trading signals generated by the Moving Average and the Relative Strength Index. Volatility indicators include Average Direction Index, Waddah Attar, and Volatility Ratio. In the NNFX trading system, volatility is a proxy for volume and vice versa.
By using volume indicators as confirmation tools, the NNFX trading system aims to reduce the risk of false signals and improve the overall profitability of trades. These indicators can provide additional information about the market that is not captured by the primary indicators, and can help traders to make more informed trading decisions. In addition, volume indicators can be used to identify potential changes in market trends and to confirm the strength of price movements.
What is an Exit indicator?
The exit indicator is used in conjunction with other indicators in the system, such as the Moving Average (MA), the Relative Strength Index (RSI), and the Average True Range (ATR), to provide a comprehensive trading strategy.
The exit indicator in the NNFX system can be any technical indicator that is deemed effective at identifying optimal exit points. Examples of exit indicators that are commonly used include the Parabolic SAR, the Average Directional Index (ADX), and the Chandelier Exit.
The purpose of the exit indicator is to identify when a trend is likely to reverse or when the market conditions have changed, signaling the need to exit a trade. By using an exit indicator, traders can manage their risk and prevent significant losses.
In the NNFX system, the exit indicator is used in conjunction with a stop loss and a take profit order to maximize profits and minimize losses. The stop loss order is used to limit the amount of loss that can be incurred if the trade goes against the trader, while the take profit order is used to lock in profits when the trade is moving in the trader's favor.
Overall, the use of an exit indicator in the NNFX trading system is an important component of a comprehensive trading strategy. It allows traders to manage their risk effectively and improve the profitability of their trades by exiting at the right time.
What is an Metamorphosis indicator?
The concept of a metamorphosis indicator involves the integration of two or more GKD indicators to generate a compound signal. This is achieved by evaluating the accuracy of each indicator and selecting the signal from the indicator with the highest accuracy. As an illustration, let's consider a scenario where we calculate the accuracy of 10 indicators and choose the signal from the indicator that demonstrates the highest accuracy.
The resulting output from the metamorphosis indicator can then be utilized in a GKD-BT backtest by occupying a slot that aligns with the purpose of the metamorphosis indicator. The slot can be a GKD-B, GKD-C, or GKD-E slot, depending on the specific requirements and objectives of the indicator. This allows for seamless integration and utilization of the compound signal within the GKD-BT framework.
How does Loxx's GKD (Giga Kaleidoscope Modularized Trading System) implement the NNFX algorithm outlined above?
Loxx's GKD v2.0 system has five types of modules (indicators/strategies). These modules are:
1. GKD-BT - Backtesting module (Volatility, Number 1 in the NNFX algorithm)
2. GKD-B - Baseline module (Baseline and Volatility/Volume, Numbers 1 and 2 in the NNFX algorithm)
3. GKD-C - Confirmation 1/2 and Continuation module (Confirmation 1/2 and Continuation, Numbers 3, 4, and 5 in the NNFX algorithm)
4. GKD-V - Volatility/Volume module (Confirmation 1/2, Number 6 in the NNFX algorithm)
5. GKD-E - Exit module (Exit, Number 7 in the NNFX algorithm)
6. GKD-M - Metamorphosis module (Metamorphosis, Number 8 in the NNFX algorithm, but not part of the NNFX algorithm)
(additional module types will added in future releases)
Each module interacts with every module by passing data to A backtest module wherein the various components of the GKD system are combined to create a trading signal.
That is, the Baseline indicator passes its data to Volatility/Volume. The Volatility/Volume indicator passes its values to the Confirmation 1 indicator. The Confirmation 1 indicator passes its values to the Confirmation 2 indicator. The Confirmation 2 indicator passes its values to the Continuation indicator. The Continuation indicator passes its values to the Exit indicator, and finally, the Exit indicator passes its values to the Backtest strategy.
This chaining of indicators requires that each module conform to Loxx's GKD protocol, therefore allowing for the testing of every possible combination of technical indicators that make up the six components of the NNFX algorithm.
What does the application of the GKD trading system look like?
Example trading system:
Backtest: Multi-Ticker CC Backtest
Baseline: Hull Moving Average
Volatility/Volume: Hurst Exponent
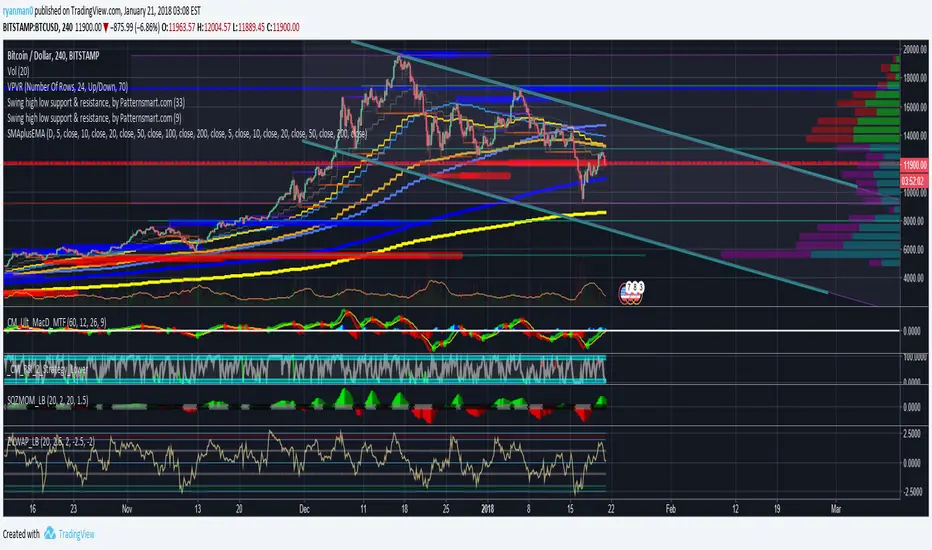
Confirmation 1: Advance Trend Pressure as shown on the chart above
Confirmation 2: uf2018
Continuation: Coppock Curve
Exit: Rex Oscillator
Metamorphosis: Baseline Optimizer
Each GKD indicator is denoted with a module identifier of either: GKD-BT, GKD-B, GKD-C, GKD-V, GKD-M, or GKD-E. This allows traders to understand to which module each indicator belongs and where each indicator fits into the GKD system.
█ Giga Kaleidoscope Modularized Trading System Signals
Standard Entry
1. GKD-C Confirmation gives signal
2. Baseline agrees
3. Price inside Goldie Locks Zone Minimum
4. Price inside Goldie Locks Zone Maximum
5. Confirmation 2 agrees
6. Volatility/Volume agrees
1-Candle Standard Entry
1a. GKD-C Confirmation gives signal
2a. Baseline agrees
3a. Price inside Goldie Locks Zone Minimum
4a. Price inside Goldie Locks Zone Maximum
Next Candle
1b. Price retraced
2b. Baseline agrees
3b. Confirmation 1 agrees
4b. Confirmation 2 agrees
5b. Volatility/Volume agrees
Baseline Entry
1. GKD-B Baseline gives signal
2. Confirmation 1 agrees
3. Price inside Goldie Locks Zone Minimum
4. Price inside Goldie Locks Zone Maximum
5. Confirmation 2 agrees
6. Volatility/Volume agrees
7. Confirmation 1 signal was less than 'Maximum Allowable PSBC Bars Back' prior
1-Candle Baseline Entry
1a. GKD-B Baseline gives signal
2a. Confirmation 1 agrees
3a. Price inside Goldie Locks Zone Minimum
4a. Price inside Goldie Locks Zone Maximum
5a. Confirmation 1 signal was less than 'Maximum Allowable PSBC Bars Back' prior
Next Candle
1b. Price retraced
2b. Baseline agrees
3b. Confirmation 1 agrees
4b. Confirmation 2 agrees
5b. Volatility/Volume agrees
Volatility/Volume Entry
1. GKD-V Volatility/Volume gives signal
2. Confirmation 1 agrees
3. Price inside Goldie Locks Zone Minimum
4. Price inside Goldie Locks Zone Maximum
5. Confirmation 2 agrees
6. Baseline agrees
7. Confirmation 1 signal was less than 7 candles prior
1-Candle Volatility/Volume Entry
1a. GKD-V Volatility/Volume gives signal
2a. Confirmation 1 agrees
3a. Price inside Goldie Locks Zone Minimum
4a. Price inside Goldie Locks Zone Maximum
5a. Confirmation 1 signal was less than 'Maximum Allowable PSVVC Bars Back' prior
Next Candle
1b. Price retraced
2b. Volatility/Volume agrees
3b. Confirmation 1 agrees
4b. Confirmation 2 agrees
5b. Baseline agrees
Confirmation 2 Entry
1. GKD-C Confirmation 2 gives signal
2. Confirmation 1 agrees
3. Price inside Goldie Locks Zone Minimum
4. Price inside Goldie Locks Zone Maximum
5. Volatility/Volume agrees
6. Baseline agrees
7. Confirmation 1 signal was less than 7 candles prior
1-Candle Confirmation 2 Entry
1a. GKD-C Confirmation 2 gives signal
2a. Confirmation 1 agrees
3a. Price inside Goldie Locks Zone Minimum
4a. Price inside Goldie Locks Zone Maximum
5a. Confirmation 1 signal was less than 'Maximum Allowable PSC2C Bars Back' prior
Next Candle
1b. Price retraced
2b. Confirmation 2 agrees
3b. Confirmation 1 agrees
4b. Volatility/Volume agrees
5b. Baseline agrees
PullBack Entry
1a. GKD-B Baseline gives signal
2a. Confirmation 1 agrees
3a. Price is beyond 1.0x Volatility of Baseline
Next Candle
1b. Price inside Goldie Locks Zone Minimum
2b. Price inside Goldie Locks Zone Maximum
3b. Confirmation 1 agrees
4b. Confirmation 2 agrees
5b. Volatility/Volume agrees
Continuation Entry
1. Standard Entry, 1-Candle Standard Entry, Baseline Entry, 1-Candle Baseline Entry, Volatility/Volume Entry, 1-Candle Volatility/Volume Entry, Confirmation 2 Entry, 1-Candle Confirmation 2 Entry, or Pullback entry triggered previously
2. Baseline hasn't crossed since entry signal trigger
4. Confirmation 1 agrees
5. Baseline agrees
6. Confirmation 2 agrees

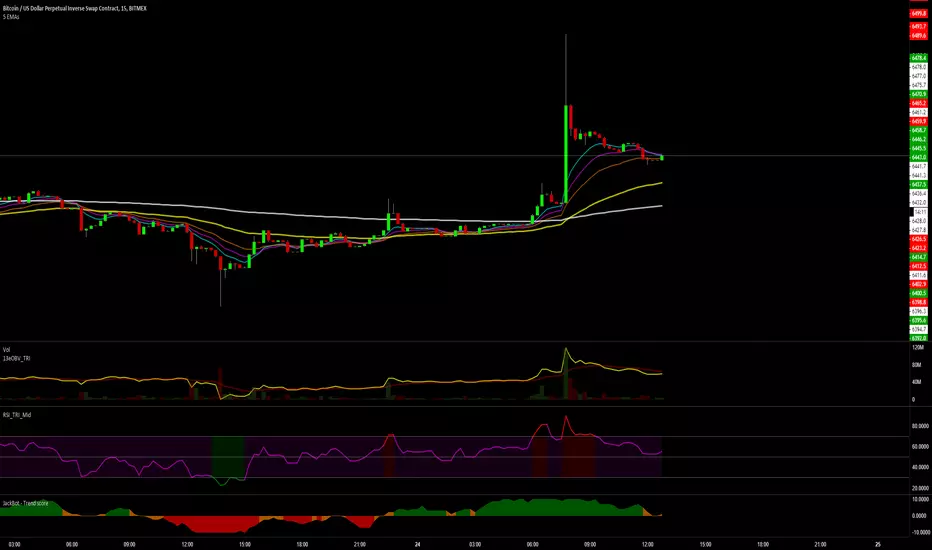
RSI with Moving Averages[UO] EnhancedWhat This Indicator Does
Displays the RSI (Relative Strength Index) with two customizable moving averages to help identify trend direction and momentum shifts.
Key Features
RSI Line: Shows momentum (overbought above 70, oversold below 30)
Two Moving Averages: Smooth RSI signals and show trend direction
Color-Coded Fills: Visual areas between lines indicate bullish/bearish conditions
Support/Resistance Lines: Bull market support (40) and bear market resistance (60)
Customization Options
Moving Average Types: Choose SMA or EMA for each line
Periods: Adjust RSI (14), First MA (13), Second MA (33)
Visual Elements: Toggle background shading and fills on/off
Colors & Styles: Customize all line colors and widths in Style tab
How to Read It
Green Fill: Second MA below first MA (bullish momentum)
Red Fill: Second MA above first MA (bearish momentum)
RSI Above 70: Potentially overbought
RSI Below 30: Potentially oversold
Perfect for traders wanting enhanced RSI analysis with flexible moving average confirmation signals.

MMA, Mid-Price Moving Averages (Open + Close Based MAs)📝 Script Description
This script introduces a custom set of moving averages based on the mid-price, calculated as the average of the open and close prices:
Mid Price = (Open + Close) / 2
Instead of traditional close-based MAs, this approach reflects the average sentiment throughout the trading session, offering a smoother and more realistic view of price action.
🔍 Key Features:
✅ Gap-aware smoothing
Captures opening gaps, offering a better representation of intraday shifts.
✅ Reduced noise
Less vulnerable to sharp closing moves or one-off spikes, making it easier to identify true trend breaks or supports.
✅ Closer to actual flow
Reflects a more natural midline of price movement, ideal for traders who prioritize clean, sustained trends.
✅ Better support/resistance alignment
Especially useful for identifying stable uptrends and minimizing false breakout signals.
📐 Included Moving Averages:
MA 5
MA 10
MA 20
MA 60
MA 120
MA 200
(All based on mid-price, not close)
🎯 Recommended For:
Traders seeking smoother and more reliable trendlines
Those who want a more realistic depiction of support and resistance
Ideal for filtering out noisy movements while focusing on clean, straight-moving charts

6 Moving Averages Difference TableIndicator Summary: 6 Moving Averages Difference Table (6MADIFF)
This TradingView indicator calculates and plots up to six distinct moving averages (MAs) directly on the price chart. Users have extensive control over each MA, allowing selection of:
Type: SMA, EMA, WMA, VWMA, HMA, RMA
Length: Any positive integer
Color: User-defined
Visibility: Can be toggled on/off
A core feature is the on-chart data table, designed to provide a quick overview of the relationships between the MAs and the price. This table displays:
$-MA Column: The absolute difference between the user-selected Input Source (e.g., Close, Open, HLC3) and the current value of each MA.
MA$ Column: The actual calculated price value of each MA for the current bar.
MA vs. MA Matrix: A grid showing the absolute difference between every possible pair of the calculated MAs (e.g., MA1 vs. MA2, MA1 vs. MA3, MA2 vs. MA5, etc.).
Customization Options:
Input Source: Select the price source (Open, High, Low, Close, HL2, HLC3, OHLC4) used for all MA calculations and the price difference column.
Table Settings: Control the table's visibility, position on the chart, text size, decimal precision for displayed values, and the text used for the column headers ("$-MA" and "MA$").
Purpose:
This indicator is useful for traders who utilize multiple moving averages in their analysis. The table provides an immediate, quantitative snapshot of:
How far the current price is from each MA.
The exact value of each MA.
The spread or convergence between different MAs.
This helps in quickly assessing trend strength, potential support/resistance levels based on MA clusters, and the relative positioning of short-term versus long-term averages.

Daily Moving Averages on Intraday ChartsThis moving average script displays the chosen 5 daily moving averages on intraday (minute) charts. It automatically adjusts the intervals to show the proper moving averages.
In a day there are 375 trading minutes from 9:15 AM to 3:30PM in Indian market. In 5 days there are 1875 minutes. For other markets adjust this data accordingly.
If 5DMA is chosen on a five minute chart the moving average will use 375 interval values (1875/5 = 375) of 5minute chart to calculate moving average. Same 5DMA on 25minute chart will use 75 interval values (1875/25 = 75).
On a 1minute chart the 5DMA plot will use 1875 interval values to arrive at the moving average.
Since tradingview only allows 5000 intervals to lookback, if a particular daily moving average on intraday chart needs more than 5000 candle data it won't be shown. E.g 200DMA on 5minute chart needs 15000 candles data to plot a correct 200DMA line. Anything less than that would give incorrect moving average and hence it won't be shown on the chart.
MA crossover for the first two MAs is provided. If you want to use that option, make sure you give the moving averages in the correct order.
You can enhance this script and use it in any way you please as long as you make it opensource on TradingView. Feedback and improvement suggestions are welcome.
Special thanks to @JohnMuchow for his moving averages script for all timeframes.

Moving Averages w/Signals [CSJ7]Unlock the power of three dynamic moving averages: Fast, Medium, and Slow. Choose between the reliability of Simple or the responsiveness of Exponential MAs. Plus, with our tailored Buy and Sell signals based on user-defined crossing scenarios, you're equipped with a clear roadmap in the ever-changing landscape of the markets.
1. Spot Trends with Ease: Our color-coded system makes identifying the market's direction intuitive. Green signals bullish momentum, while red indicates bearish movements.
2. Precision Signals: Navigate the markets confidently with our Buy and Sell signals, designed to highlight potential entry and exit points.
3. Gauge Trend Strength: The color intensity between the Medium and Slow MAs offers a visual cue on the trend's strength, ensuring you're always in the know.
Limitations:
- Inherent Lag: As with all moving average tools, there's a natural delay. But it's this reflective nature that offers valuable insights.
- Stay Alert in Sideways Markets: During consolidative phases, the indicator might produce occasional false signals. Always cross-reference with other tools.
- Customization is Key: The tool's true potential shines when you adjust the settings to align with your trading style and strategy.
4. How to Use:
Quick Setup: Select your preferred MA type, set the lengths, and define your ideal crossover scenarios. It's that simple!
Interpreting Signals: A green triangle below the price suggests a potential buying zone, while a red triangle above hints at a selling opportunity.
Trend Insights: The color gradient between the Medium and Slow MAs offers a visual representation of the trend's vigor. The more vibrant, the stronger the trend.
Elevate your trading strategy with the Moving Averages w/Signals & AutoTrade . With clarity and precision, it's the companion every trader deserves.

NET on Variety Moving Averages [Loxx]NET (Noise Elimination Technology) on Variety Moving Averages is a moving average indicator that applies John Ehlers' NET (Noise Elimination Technology) to your choice of 36 different moving averages.
█ What is NET (Noise Elimination Technology)?
Noise Elimination Technology (NET) is a method introduced by John Ehlers to enhance the clarity of technical indicators by removing noise without resorting to filtering. Here's a more detailed explanation:
Purpose of Technical Indicators: Technical indicators aim to provide insights into market inefficiencies, assisting traders in making informed decisions. However, many indicators are inherently noisy due to their reliance on a limited amount of data.
Traditional Noise Removal: Noise in indicators is typically removed using smoothing filters. While these filters can reduce noise, they introduce lag, leading to potentially delayed trading decisions which can be costly.
NET's Approach: NET offers a solution to this problem by using the nonlinearity of a rank-ordered Kendall correlation. Instead of filtering, NET clarifies indicators by focusing on their main direction and stripping out noise components.
Kendall Correlation: This is a statistical method that compares the ranked order of two sets of random variables. These pairs of ranked variables can be either concordant or discordant. In the context of NET:
The "y" variable represents a straight line with a positive slope.
The "x" variable is the output of the technical indicator.
When applied, the Kendall correlation in this configuration removes noise components that don't align with the primary direction of the indicator.
NET's Mechanism:
The "y" variable (a straight line with a positive slope) and the "x" variable (indicator output) are used in the Kendall correlation.
This correlation essentially removes noise components not aligned with the main direction of the indicator in a nonlinear manner.
The effectiveness of NET lies in its ability to reduce noise without introducing lag.
Flexibility: NET is designed to be versatile and can be applied to various technical indicators. It doesn't necessarily replace traditional smoothing filters but can complement them to provide a clearer visual representation of the indicator's behavior.
In essence, NET offers a novel approach to refining technical indicators by removing noise using the principles of Kendall correlation, without the drawbacks associated with traditional smoothing filters.
█ Moving Average Types
ADXvma - Average Directional Volatility Moving Average
Ahrens Moving Average
Alexander Moving Average - ALXMA
Double Exponential Moving Average - DEMA
Double Smoothed Exponential Moving Average - DSEMA
Exponential Moving Average - EMA
Fast Exponential Moving Average - FEMA
Fractal Adaptive Moving Average - FRAMA
Hull Moving Average - HMA
IE/2 - Early T3 by Tim Tilson
Integral of Linear Regression Slope - ILRS
Instantaneous Trendline
Laguerre Filter
Leader Exponential Moving Average
Linear Regression Value - LSMA (Least Squares Moving Average)
Linear Weighted Moving Average - LWMA
McGinley Dynamic
McNicholl EMA
Non-Lag Moving Average
Parabolic Weighted Moving Average
Recursive Moving Trendline
Simple Moving Average - SMA
Sine Weighted Moving Average
Smoothed Moving Average - SMMA
Smoother
Super Smoother
Three-pole Ehlers Butterworth
Three-pole Ehlers Smoother
Triangular Moving Average - TMA
Triple Exponential Moving Average - TEMA
Two-pole Ehlers Butterworth
Two-pole Ehlers smoother
Volume Weighted EMA - VEMA
Zero-Lag DEMA - Zero Lag Double Exponential Moving Average
Zero-Lag Moving Average
Zero Lag TEMA - Zero Lag Triple Exponential Moving Average
█ Included
Bar coloring
Alerts
Channels fill
Loxx's Expanded Source Types
█ Libraries included
loxxmas - moving averages used in Loxx's indis & strats
loxxexpandedsourcetypes

Planetary Tunings Moving AveragesThe Pine Script "Planetary Tunings Moving Averages" is a unique tool that plots moving averages (MAs) on a chart, representing the wavelengths of different planets as derived from the book Quadrivium. These wavelengths, also referred to as 'planetary tunings', are related to the orbital resonance of each planet.
Each planetary tuning value is first transformed into a whole number by multiplying it by 1000 and removing the decimal. This whole number is then used as the length parameter for a Simple Moving Average (SMA) function. This function calculates the average of the closing prices over the defined number of periods, thereby creating a moving average line on the chart.
The moving average lines are color-coded according to the planet they represent, allowing for quick and easy interpretation. For example, Mercury's moving average line is blue, Venus's line is orange, and so forth. These colors can be adjusted directly in the Pine Script code if desired.
Additionally, the script computes the mean of all these moving averages and plots it on the chart. This line provides an overall trend line, summarizing the collective behavior of all the planetary tuning moving averages.
The drawings in the chart are fib channels and fib circles that I use to capture liquidity in time.
Please note that this script is written for Pine Script Version 4. It's crucial to ensure your TradingView platform is compatible with this version. For any issues or further clarification, consider referring to TradingView's Pine Script documentation or its community forums.

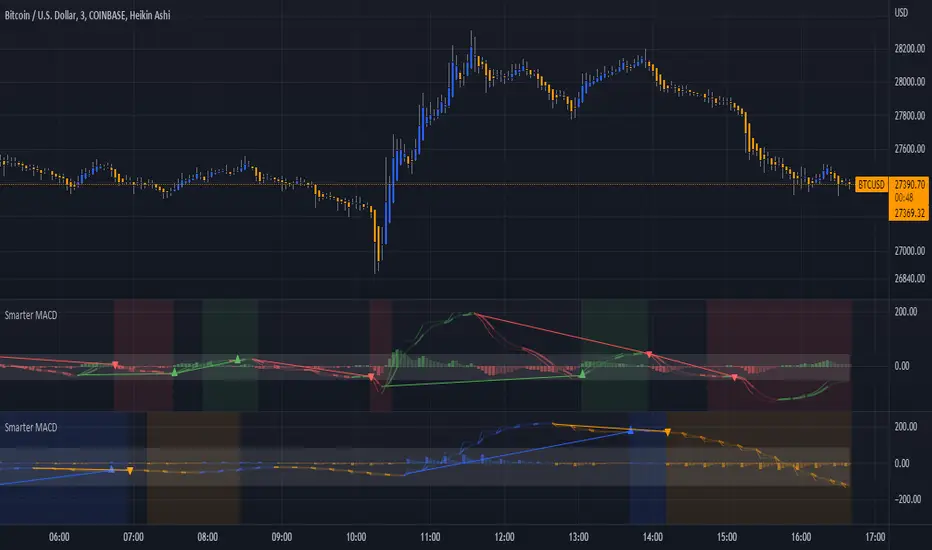
Smarter MACDA classic MACD with average peak and dip lines. The lighter green and red horizontal lines are the average peak and dip of the entire span, respectively. The second, bolder of the two lines are the averages of the peaks and dips above and below the overall peak and dip averages. The filled in color is to help visualize these averages and possible trade setups. Rework of the MACD + Averages script.
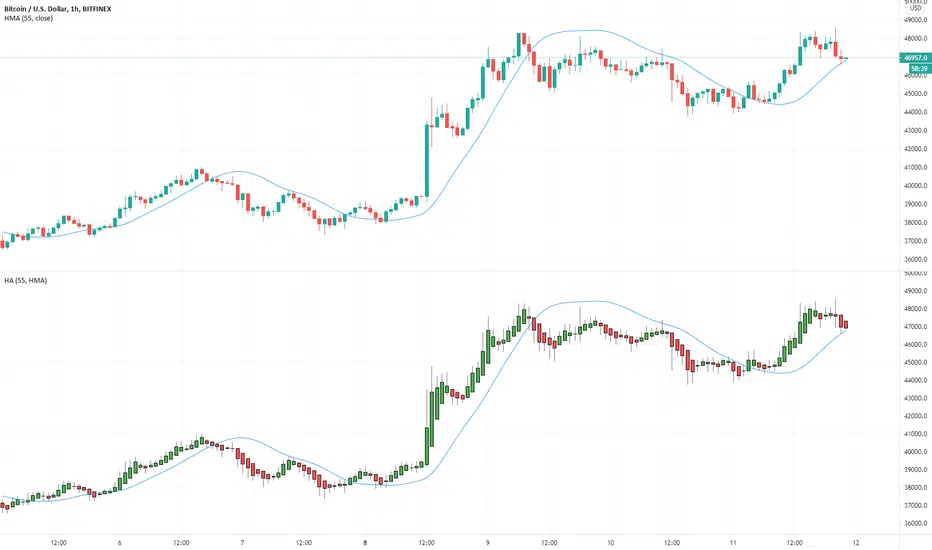
Multiple Moving Averages for Heikin Ashi I want to give credits to @QuantNomad, i got the heikin ashi part of the script from this open script /0iKy7lyG-QuantNomad-Heikin-Ashi-PSAR-Strategy/;
and to the other guy that provided a 17 type of moving average script open source but i forgot his name, if someone remember please tell me.
My idea was to see how the different types of moving averages behaves in a Heinkin Ashi chart, you can change to more than 15 types of Moving Average and use it the way you want it.
For the source of the moving averages i used a simple moving average of 1 period using the high of the heikin ashi candle, low of it and divided by 2 as the source of the different types of moving averages.
Different types of Moving Averages
Moving Average Types
SMA ---> Simple
WMA ---> Weighted
VWMA ---> Volume Weighted
EMA ---> Exponential
DEMA ---> Double EMA
ALMA ---> Arnaud Legoux
HMA ---> Hull MA
SMMA ---> Smoothed
LSMA ---> Least Squares
KAMA ---> Kaufman Adaptive
TEMA ---> Triple EMA
ZLEMA ---> Zero Lag
FRAMA ---> Fractal Adaptive
VIDYA ---> Variable Index Dynamic Average
JMA ---> Jurik Moving Average
T3 ---> Tillson
TRIMA ---> Triangular
The type of moving average you select will appear in a separated chart with Heikin Ashi candles, like in the image above.
MAVC: Moving Averages Combo by Mehmet YildizliMAVC: Moving Averages Combo by Mehmet Yildizli
==========================================
You can use this indicator to add more than one moving average on the same chart. At the beginning of the indicator settings, the "Volume For Tillson" parameter is used only when you select the Tillson moving average.
When you check the "Use (high + low + 2 * close) / 4" checkbox, this value is used as the source data to be included in the calculations of all moving averages. When you clear this check box, calculations are made according to the selection you make in the SOURCE section.
You can add 4 moving averages at the same time to the chart.
You can choose a different period and a different calculation method for each moving average.
In this way, you can make a buying / selling decision by considering the relative positions of more than one moving average.
The risks you may be exposed to as a result of your transactions will be entirely at your own risk, as the buy / sell signals you will receive through this indicator will be revealed by your interpretation of the curves that will emerge according to the parameters and calculation methods you choose.
Moving Average Calculation Methods:
1. "S: Simple": Simple Moving Average (SMA)
2. "E: Exponential": Exponential Moving Average (EMA)
3. "DE: Double Exponential": Double Exponential Moving Average (DEMA)
4. "W: Weighted": Weighted Moving Average (WMA)
5. "VIDYA 1: VIDYA via St Dev": Variable Index Dynamic Average - by standard deviation (VIDYA)
6. "VIDYA 2: VIDYA via CMO": Variable Index Dynamic Average - via CMO (VIDYA)
7. "T: Tillson": Tillson - T3
8. "RMA: Running Mov Av": Running Moving Average (RMA)
Hope you will benefit from the indicator.
TÜRKÇE AÇIKLAMA
=================
MAVC: Moving Averages Combo by Mehmet Yildizli
==========================================
Bu indikatör ile birden fazla hareketli ortalamayı aynı grafik üzerine ekleyebilirsiniz. İndikatör ayarlarının başında, "Volume For Tillson" parametresi sadece Tillson hareketli ortalama seçimi yaptığınız zaman kullanılmaktadır.
"Use (high+low+2*close)/4" onay kutusunu onayladığınızda ise, bütün hareketli ortalamaların hesaplamalarına dahil edilecek kaynak veri olarak bu değer kullanılır. Bu onay kutusundaki onayı kaldırdığınızda ise KAYNAK kısmında yapacağınız seçime göre hesaplamalar yapılır.
Aynı anda 4 hareketli ortalamayı grafiğe ekleyebilirsiniz.
Her hareketli ortalama için farklı bir periyot ve farklı bir hesaplama yöntemi seçimi yapabilirsiniz.
Bu şekilde birden fazla hareketli ortalamanın birbirine göre durumlarını dikkate alarak alış/satış kararı verebilirsiniz.
Bu indikatör yoluyla alacağınız alış/satış sinyalleri, tamamen sizin belirleyeceğiniz parametre ve seçtiğiniz hesaplama yöntemlerine göre ortaya çıkacak eğrilerin sizin tarafınızdan yorumlanarak ortaya çıkacağı için işlemleriniz sonucunda maruz kalabileceğiniz riskler tamamen size ait olacaktır.
Hareketli Ortalama Hesaplama Yöntemleri:
1. "S:Simple" : Basit Hareketli Ortalama (SMA)
2. "E:Exponential" :Üstel Hareketli Ortalama (EMA)
3. "DE:Double Exponential": İkili Üstel Hareketli Ortalama (DEMA)
4. "W:Weighted": Ağırlıklı Hareketli Ortalama (WMA)
5. "VIDYA 1: VIDYA via St Dev": Değişken Hareketli Ortalama - standart sapma yoluyla (VIDYA)
6. "VIDYA 2: VIDYA via CMO": Değişken Hareketli Ortalama - CMO yoluyla (VIDYA)
7. "T:Tillson": Tillson - T3
8. "RMA:Running Mov Av": Running Moving Average (RMA)
İndikatörden faydalanmanız dileğiyle.

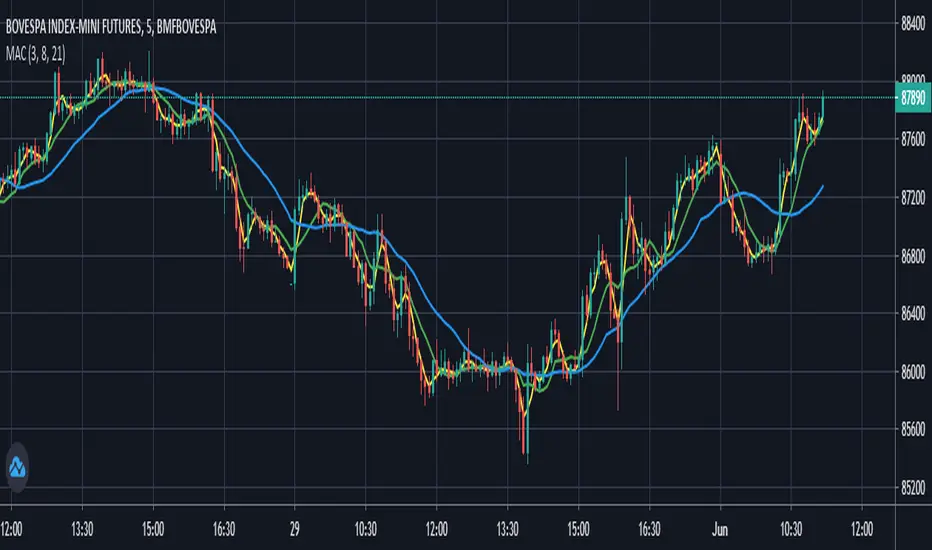
Moving Averages Convergence (Agulhada do Didi)The script is based on a strategy developed by Odir “Didi” Aguiar called “Agulhada do Didi”.
It consists in the use of 3 moving averages:
SMA 3
SMA 8
SMA 21
Strategy:
When the averages come together, preferably they pass through a candle, there is a signal. The crossing of the short average (3) with the long average (21) provides us with a confirma-tion of the entry.
Buy:
The average of 3 periods comes out on top, 8 goes in the middle and 21 goes down.
Sell:
Average of 21 periods comes out on top, 8 in the middle and 3 down.
Multi Moving Averages by Atilla YurtsevenFrom time to time, we both need to add multiple moving averages. I wanted to make it a bit easier.
Multi Moving Averages support 6 different moving averages and can plot up to 10 at the same time.
Supported moving averages
Simple Moving Average - SMA
Weighted Moving Average - WMA
Exponential Moving Average - EMA
Rolling Moving Average - RMA
Linear Moving Average - Linear
Ranking - Rank
By enabling Advanced Mode, you will be able to select different moving average types and different sources for each moving average.
This is not a financial advice and published for educational purposes only!
Happy trading
Atilla Yurtseven

6 Simple Blue & 5 Exponential Yellow Moving Averages6 simple and 5 exponential Moving Averages in one indicator.
I made this because its not always easy to tell what average the price might be bouncing off from when you only have a couple at a time.
For some reason, the defaults aren't working.
To fix this, just open the configuration for the indicator after the first time that you load it.
Then check/uncheck the box and set the time period.
If anyone knows how I can fix this in the code, please let me know.
Blue indicators are simple and the Yellow are exponential.
Thinner more transparent lines are shorter term averages and Thicker lines are longer term averages.
I modeled it after the source of several other scripts which had less averages
Weekly Moving Averages (MAs) to Intraday ChartThis indicator overlays key weekly timeframe moving averages onto your intraday chart, allowing you to visualize important long-term support and resistance levels while trading shorter timeframes. The indicator includes:
330-period Simple Moving Average (white): Ultra long-term trend indicator
200-period Simple Moving Average (fuchsia): Major long-term trend indicator often watched by institutional traders
100-period Simple Moving Average (purple): Medium-to-long term trend indicator
50-period Exponential Moving Average (blue): Medium-term trend indicator, more responsive to recent price action
21-period Exponential Moving Average (teal): Short-to-medium term trend indicator
9-period Exponential Moving Average (aqua): Short-term trend indicator, highly responsive to recent price movements
This multi-timeframe approach helps identify significant support/resistance zones that might not be visible on your current timeframe. When price interacts with these weekly moving averages during intraday trading, it often signals important areas where institutional orders may be placed.
The indicator uses color-coding with increasing line thickness to help you quickly distinguish between different moving averages. Consider areas where multiple MAs cluster together as particularly strong support/resistance zones.
Perfect for day traders and swing traders who want to maintain awareness of the bigger picture while focusing on shorter-term price action.

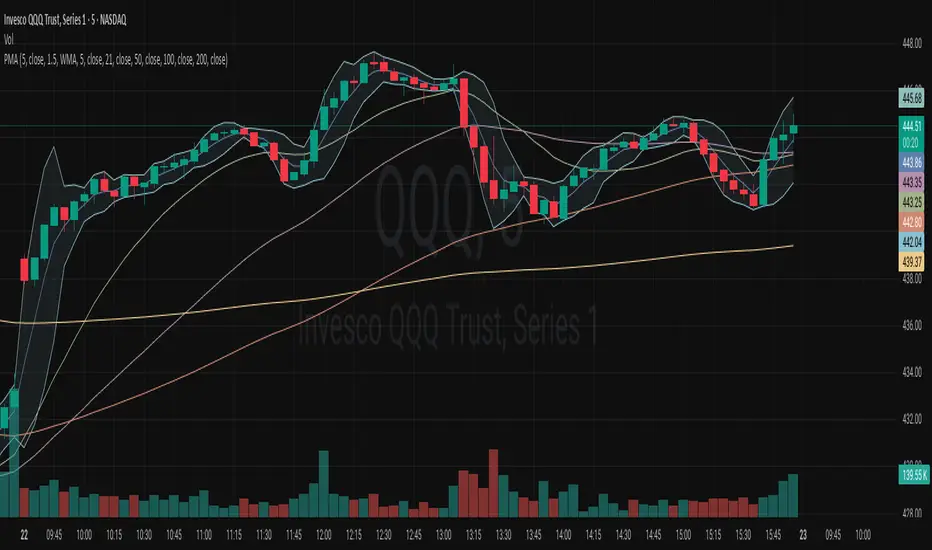
Polygot Moving AveragesDescription
This is essentially a source merger of Bollinger Bands by Trading View and Simple Moving Averages by stoxxinbox. My additions and subtractions are minimal. There is the BB MA, which I default at 5d, and the other 4 averages are the standard 21, 50, 100, 200, day moving averages. I default the averaging method to WMA (Weighted Moving Average). The method of averaging can be changed as also can the lengths of the inputs to match user preferences. This is what I wanted for an indicator and didn't find.
Usage
The same as you would use any other BB or MA indicator. The benefit of this one is that it has 4 MAs, one MA with the Bollinger Bands attached, and the colours adjusted to be easy on the eyes when using high contrast themes, to be discernible yet sit quietly in the background with lines and candle sticks everywhere shouting for attention. I use it as a base first indicator which I can hide easily (imagine hiding five MA indicators individually constantly) when the more serious indicators come into play.
Moving averages & clouds
Hi all!
This is a script that lets you have 3 moving averages (of a user defined type) and maybe have an alternative cloud (fill) between them. The cloud can be customized and turned on/off in the "style" tab for the indicator.
Alerts can be configured to fire on up/down/all crosses and are activated when the whole candle has crossed the morning average.
A higher time frame can be configured for the moving averages.
You can hide the moving average, but show the cloud:
You can have multiple clouds:
You can have moving averages from a higher time frame (here from weekly time frame on a daily chart):
Best of trading luck!
