JS-TechTrading: VWAP Momentum_Pullback StrategyGeneral Description and Unique Features of this Script
Introducing the VWAP Momentum-Pullback Strategy (long-only) that offers several unique features:
1. Our script/strategy utilizes Mark Minervini's Trend-Template as a qualifier for identifying stocks and other financial securities in confirmed uptrends.
NOTE: In this basic version of the script, the Trend-Template has to be used as a separate indicator on TradingView (Public Trend-Template indicators are available on TradingView – community scripts). It is recommended to only execute buy signals in case the stock or financial security is in a stage 2 uptrend, which means that the criteria of the trend-template are fulfilled.
2. Our strategy is based on the supply/demand balance in the market, making it timeless and effective across all timeframes. Whether you are day trading using 1- or 5-min charts or swing-trading using daily charts, this strategy can be applied and works very well.
3. We have also integrated technical indicators such as the RSI and the MA / VWAP crossover into this strategy to identify low-risk pullback entries in the context of confirmed uptrends. By doing so, the risk profile of this strategy and drawdowns are being reduced to an absolute minimum.
Minervini’s Trend-Template and the ‘Stage-Analysis’ of the Markets
This strategy is a so-called 'long-only' strategy. This means that we only take long positions, short positions are not considered.
The best market environment for such strategies are periods of stable upward trends in the so-called stage 2 - uptrend.
In stable upward trends, we increase our market exposure and risk.
In sideways markets and downward trends or bear markets, we reduce our exposure very quickly or go 100% to cash and wait for the markets to recover and improve. This allows us to avoid major losses and drawdowns.
This simple rule gives us a significant advantage over most undisciplined traders and amateurs!
'The Trend is your Friend'. This is a very old but true quote.
What's behind it???
• 98% of stocks made their biggest gains in a Phase 2 upward trend.
• If a stock is in a stable uptrend, this is evidence that larger institutions are buying the stock sustainably.
• By focusing on stocks that are in a stable uptrend, the chances of profit are significantly increased.
• In a stable uptrend, investors know exactly what to expect from further price developments. This makes it possible to locate low-risk entry points.
The goal is not to buy at the lowest price – the goal is to buy at the right price!
Each stock goes through the same maturity cycle – it starts at stage 1 and ends at stage 4
Stage 1 – Neglect Phase – Consolidation
Stage 2 – Progressive Phase – Accumulation
Stage 3 – Topping Phase – Distribution
Stage 4 – Downtrend – Capitulation
This strategy focuses on identifying stocks in confirmed stage 2 uptrends. This in itself gives us an advantage over long-term investors and less professional traders.
By focusing on stocks in a stage 2 uptrend, we avoid losses in downtrends (stage 4) or less profitable consolidation phases (stages 1 and 3). We are fully invested and put our money to work for us, and we are fully invested when stocks are in their stage 2 uptrends.
But how can we use technical chart analysis to find stocks that are in a stable stage 2 uptrend?
Mark Minervini has developed the so-called 'trend template' for this purpose. This is an essential part of our JS-TechTrading pullback strategy. For our watchlists, only those individual values that meet the tough requirements of Minervini's trend template are eligible.
The Trend Template
• 200d MA increasing over a period of at least 1 month, better 4-5 months or longer
• 150d MA above 200d MA
• 50d MA above 150d MA and 200d MA
• Course above 50d MA, 150d MA and 200d MA
• Ideally, the 50d MA is increasing over at least 1 month
• Price at least 25% above the 52w low
• Price within 25% of 52w high
• High relative strength according to IBD.
NOTE: In this basic version of the script, the Trend-Template has to be used as a separate indicator on TradingView (Public Trend-Template indicators are available in TradingView – community scripts). It is recommended to only execute buy signals in case the stock or financial security is in a stage 2 uptrend, which means that the criteria of the trend-template are fulfilled.
This strategy can be applied to all timeframes from 5 min to daily.
The VWAP Momentum-Pullback Strateg y
For the JS-TechTrading VWAP Momentum-Pullback Strategy, only stocks and other financial instruments that meet the selected criteria of Mark Minervini's trend template are recommended for algorithmic trading with this startegy.
A further prerequisite for generating a buy signals is that the individual value is in a short-term oversold state (RSI).
When the selling pressure is over and the continuation of the uptrend can be confirmed by the MA / VWAP crossover after reaching a price low, a buy signal is issued by this strategy.
Stop-loss limits and profit targets can be set variably.
Relative Strength Index (RSI)
The Relative Strength Index (RSI) is a technical indicator developed by Welles Wilder in 1978. The RSI is used to perform a market value analysis and identify the strength of a trend as well as overbought and oversold conditions. The indicator is calculated on a scale from 0 to 100 and shows how much an asset has risen or fallen relative to its own price in recent periods.
The RSI is calculated as the ratio of average profits to average losses over a certain period of time. A high value of the RSI indicates an overbought situation, while a low value indicates an oversold situation. Typically, a value > 70 is considered an overbought threshold and a value < 30 is considered an oversold threshold. A value above 70 signals that a single value may be overvalued and a decrease in price is likely , while a value below 30 signals that a single value may be undervalued and an increase in price is likely.
For example, let's say you're watching a stock XYZ. After a prolonged falling movement, the RSI value of this stock has fallen to 26. This means that the stock is oversold and that it is time for a potential recovery. Therefore, a trader might decide to buy this stock in the hope that it will rise again soon.
The MA / VWAP Crossover Trading Strategy
This strategy combines two popular technical indicators: the Moving Average (MA) and the Volume Weighted Average Price (VWAP). The MA VWAP crossover strategy is used to identify potential trend reversals and entry/exit points in the market.
The VWAP is calculated by taking the average price of an asset for a given period, weighted by the volume traded at each price level. The MA, on the other hand, is calculated by taking the average price of an asset over a specified number of periods. When the MA crosses above the VWAP, it suggests that buying pressure is increasing, and it may be a good time to enter a long position. When the MA crosses below the VWAP, it suggests that selling pressure is increasing, and it may be a good time to exit a long position or enter a short position.
Traders typically use the MA VWAP crossover strategy in conjunction with other technical indicators and fundamental analysis to make more informed trading decisions. As with any trading strategy, it is important to carefully consider the risks and potential rewards before making any trades.
This strategy is applicable to all timeframes and the relevant parameters for the underlying indicators (RSI and MA/VWAP) can be adjusted and optimized as needed.
Backtesting
Backtesting gives outstanding results on all timeframes and drawdowns can be reduced to a minimum level. In this example, the hourly chart for MCFT has been used.
Settings for backtesting are:
- Period from April 2020 until April 2021 (1 yr)
- Starting capital 100k USD
- Position size = 25% of equity
- 0.01% commission = USD 2.50.- per Trade
- Slippage = 2 ticks
Other comments
• This strategy has been designed to identify the most promising, highest probability entries and trades for each stock or other financial security.
• The RSI qualifier is highly selective and filters out the most promising swing-trading entries. As a result, you will normally only find a low number of trades for each stock or other financial security per year in case you apply this strategy for the daily charts. Shorter timeframes will result in a higher number of trades / year.
• As a result, traders need to apply this strategy for a full watchlist rather than just one financial security.
In den Scripts nach "algo" suchen

Investments/swing trading strategy for different assetsStop worrying about catching the lowest price, it's almost impossible!: with this trend-following strategy and protection from bearish phases, you will know how to enter the market properly to obtain benefits in the long term.
Backtesting context: 1899-11-01 to 2023-02-16 of SPX by Tvc. Commissions: 0.05% for each entry, 0.05% for each exit. Risk per trade: 2.5% of the total account
For this strategy, 5 indicators are used:
One Ema of 200 periods
Atr Stop loss indicator from Gatherio
Squeeze momentum indicator from LazyBear
Moving average convergence/divergence or Macd
Relative strength index or Rsi
Trade conditions:
There are three type of entries, one of them depends if we want to trade against a bearish trend or not.
---If we keep Against trend option deactivated, the rules for two type of entries are:---
First type of entry:
With the next rules, we will be able to entry in a pull back situation:
Squeeze momentum is under 0 line (red)
Close is above 200 Ema and close is higher than the past close
Histogram from macd is under 0 line and is higher than the past one
Once these rules are met, we enter into a buy position. Stop loss will be determined by atr stop loss (white point) and break even(blue point) by a risk/reward ratio of 1:1.
For closing this position: Squeeze momentum crosses over 0 and, until squeeze momentum crosses under 0, we close the position. Otherwise, we would have closed the position due to break even or stop loss.
Second type of entry:
With the next rules, we will not lose a possible bullish movement:
Close is above 200 Ema
Squeeze momentum crosses under 0 line
Once these rules are met, we enter into a buy position. Stop loss will be determined by atr stop loss (white point) and break even(blue point) by a risk/reward ratio of 1:1.
Like in the past type of entry, for closing this position: Squeeze momentum crosses over 0 and, until squeeze momentum crosses under 0, we close the position. Otherwise, we would have closed the position due to break even or stop loss.
---If we keep Against trend option activated, the rules are the same as the ones above, but with one more type of entry. This is more useful in weekly timeframes, but could also be used in daily time frame:---
Third type of entry:
Close is under 200 Ema
Squeeze momentum crosses under 0 line
Once these rules are met, we enter into a buy position. Stop loss will be determined by atr stop loss (white point) and break even(blue point) by a risk/reward ratio of 1:1.
Like in the past type of entries, for closing this position: Squeeze momentum crosses over 0 and, until squeeze momentum crosses under 0, we close the position. Otherwise, we would have closed the position due to break even or stop loss.
Risk management
For calculating the amount of the position you will use just a small percent of your initial capital for the strategy and you will use the atr stop loss for this.
Example: You have 1000 usd and you just want to risk 2,5% of your account, there is a buy signal at price of 4,000 usd. The stop loss price from atr stop loss is 3,900. You calculate the distance in percent between 4,000 and 3,900. In this case, that distance would be of 2.50%. Then, you calculate your position by this way: (initial or current capital * risk per trade of your account) / (stop loss distance).
Using these values on the formula: (1000*2,5%)/(2,5%) = 1000usd. It means, you have to use 1000 usd for risking 2.5% of your account.
We will use this risk management for applying compound interest.
In settings, with position amount calculator, you can enter the amount in usd of your account and the amount in percentage for risking per trade of the account. You will see this value in green color in the upper left corner that shows the amount in usd to use for risking the specific percentage of your account.
Script functions
Inside of settings, you will find some utilities for display atr stop loss, break evens, positions, signals, indicators, etc.
You will find the settings for risk management at the end of the script if you want to change something. But rebember, do not change values from indicators, the idea is to not over optimize the strategy.
If you want to change the initial capital for backtest the strategy, go to properties, and also enter the commisions of your exchange and slippage for more realistic results.
If you activate break even using rsi, when rsi crosses under overbought zone break even will be activated. This can work in some assets.
---Important: In risk managment you can find an option called "Use leverage ?", activate this if you want to backtest using leverage, which means that in case of not having enough money for risking the % determined by you of your account using your initial capital, you will use leverage for using the enough amount for risking that % of your acount in a buy position. Otherwise, the amount will be limited by your initial/current capital---
Some things to consider
USE UNDER YOUR OWN RISK. PAST RESULTS DO NOT REPRESENT THE FUTURE.
DEPENDING OF % ACCOUNT RISK PER TRADE, YOU COULD REQUIRE LEVERAGE FOR OPEN SOME POSITIONS, SO PLEASE, BE CAREFULL AND USE CORRECTLY THE RISK MANAGEMENT
Do not forget to change commissions and other parameters related with back testing results!
Some assets and timeframes where the strategy has also worked:
BTCUSD : 4H, 1D, W
SPX (US500) : 4H, 1D, W
GOLD : 1D, W
SILVER : 1D, W
ETHUSD : 4H, 1D
DXY : 1D
AAPL : 4H, 1D, W
AMZN : 4H, 1D, W
META : 4H, 1D, W
(and others stocks)
BANKNIFTY : 4H, 1D, W
DAX : 1D, W
RUT : 1D, W
HSI : 1D, W
NI225 : 1D, W
USDCOP : 1D, W

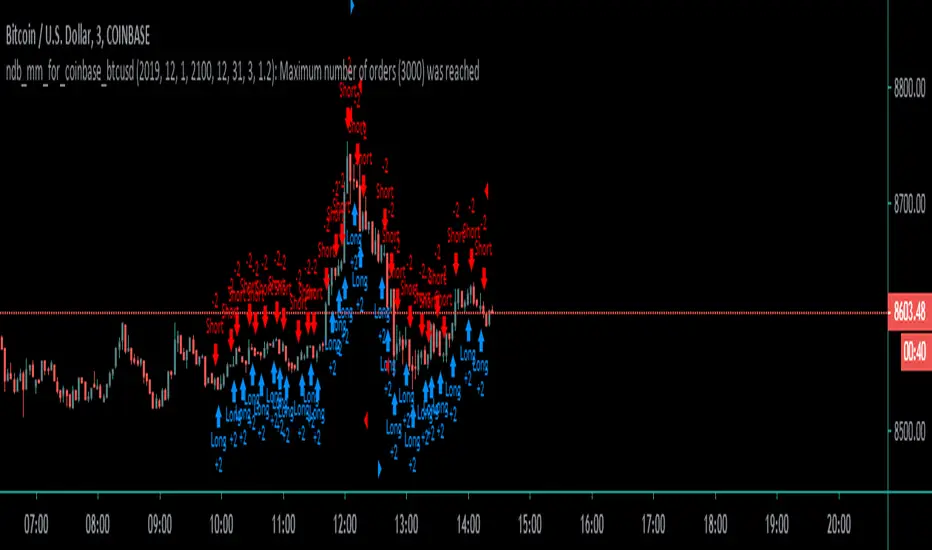
Super 8 - 30M BTCWelcome to Super 8, the ultimate automatic trading script for Pine!
This bad boy is designed to go both long and short, and it's equipped with all the tools you need to maximize your profits. Whether you're looking to take profit, set a trailing stop, or protect yourself with a stop loss, Super 8 has you covered.
But that's not all! Super 8 is also loaded with 8 powerful indicators to help you make informed decisions. We've got the EMA, ADX, SAR, MACD, VOLUME, BOLLINGER BANDS, DONCHIAN, and ATR all working together to give you the best possible trading experience.
And if you want to take it to the next level, Super 8 also has a feature that lets you use stepped entries in normal mode or incremental 1,2,3,... to improve your average price. Plus, if you're using trailing stop, you can activate the Backtest precision to use lower timeframes.
But what's in a name? Super 8 is called that because it's just that... super! It's tailored specifically for the OKX:BTCUSDT.P pair, so you know you're getting the best possible results. it's highly adjustable and can be used with any other pair. So no matter what market you're trading in, Super 8 has got you covered.
So if you want to level up your trading game, give Super 8 a try. You won't be disappointed.
Certain Risks of Live Algorithmic Trading:
Backtesting Cannot Assure Actual Results.
The relevant market might fail or behave unexpectedly.
Your broker may experience failures in its infrastructure, fail to execute your orders in a correct or timely fashion or reject your orders.
The system you use for generating trading orders, communicating those orders to your broker, and receiving queries and trading results from your broker may fail.
Time lag at various point in live trading might cause unexpected behavior.
The systems of third parties in addition to those of the provider from which we obtain various services, your broker, and the applicable securities market may fail or malfunction.

Extended Recursive Bands StrategyThe original indicator was created by alexgrover .
All credit goes to alexgrover for creating the indicator that this strategy uses.
This strategy was posted because there were multiple requests for it, and no strategy based on this indicator exists yet.
The Recursive Bands Indicator, an indicator specially created to be extremely efficient, I think you already know that calculation time is extra important in algorithmic trading, and this is the principal motivation for the creation of the proposed indicator. Originally described in Alex's paper "Pierrefeu, Alex (2019): Recursive Bands - A New Indicator For Technical Analysis", the indicator framework has been widely used in his previous uploaded indicators, however it would have been a shame to not upload it, however user experience being a major concern for me, I decided to add extra options, which explain the term "extended".
The Indicator
The indicator displays one upper and one lower band, every common usages applied to bands indicators such as support/resistance , breakout, trailing stop, etc, can also be applied to this one. Length controls how reactive the bands are, higher values will make the bands cross the price less often.
In order to provide more flexibility for the user alexgrover added the option to use various methods for the calculation of the indicator, therefore the indicator can use the average true range , standard deviation, average high-low range, and one totally exclusive method specially designed for this indicator.
Added logic:
We have implemented a logic that checks whether the bands have been following in the same direction for a set amount of bars. This logic must be true before it can enter trades. This is completely new code that was written by us entirely, and it makes a huge difference on strategy performance.
Strategy Long conditions:
1 — Price low is below the the lower band.
2 — The lower band keeps increasing in value until the 'lookback' setting amount of bars is reached.
Strategy Short conditions:
1 — Price high is above the upper band.
2 — The upper band keeps decreasing in value until the 'lookback' setting amount of bars is reached.
Strategy Properties:
We have set a default commission of 0.06% because these are Bybit's fees. The strategy uses an order size of 10% of equity, since drawdown is very low like this. We also use a 10 tick slippage to keep results realistic and account for this. All other settings were left as default apart from initial capital, just to decrease the size of the numbers.

RSI Buy & Sell Trading ScriptThis is my first attempt at a trading script using the RSI indicator for Buy & Sell signals (so please be nice but would appreciate any constructive comments).
Starting with $100 initial capital and using 10% per trade
You can select which month the backtesting starts
There is also a monthly table (sorry can’t remember who I got this from) that shows the total monthly profits, but you’ll need to turn it on by going into settings, Properties and in the Recalculate section tick the “On every tick” box
It should do the following:
Open Buy order if the RSI > 68 and the current Moving Average is greater than the previous Moving average
• TP1 = 50% of Order at 0.4%
• TP2 = 50% of order at 0.8%
• SL = 2% below entry
• Close Buy order if the RSI < 30
Open Sell order if the RSI < 28 and the current Moving Average is less than the previous Moving average
• TP1 = 50% of Order at 0.4%
• TP2 = 50% of order at 0.8%
• SL = 2% above entry
• Close Buy order if the RSI < 60
I would like to build on this if you have any ideas/ code that could help like the following:
• Move the SL to break even when it hits TP1
• Move the SL to TP1 when TP2 hits
• Moving take profit code so I can let the some of the trade stay in play (activate if it hits 1% profit and close trade if price retracts 0.5%)

supertrend advanceHELLO FRIENDS ...............THIS IS SUPERTREND ADVANCE WITH HENKIASHI CANDLE ...I got so many request on supertrend with henkiashi. This is for all of them ..I am making it open for all so you can change its coding according to your need
SOME IMPONTENT UPDATE IN THIS SUPERTRNED
1) You Can Use It for option trading ...you can do algo option trading using this strategy
2) YOU CAN USE CUSTOME SYNTAX TO ALGO TRADE IN STOCK,FOREX,COMMODITY AND CRYPTO
3) YO CAN USE IT IN INTRADAY TIME PERIOD ALSO U CAN SET ITS ENTRY AND EXIT TIME
4) YOU CAN USE HENKIASHI SUPERTREND ON NORMAL CANDLE STICK CHART
5) YOU CAN USE ITS QUNTITY FEATURE .BY THIS WAY U CAN DOUBLE YOUR QUNTITY SIZE ON LOSSING TRADE AND WHEN PROIFT TRADE OCCUR ITS QUNTITY AGAIN AUTOMATICALLY SHIFTED TO NORMAL QUNTITY ....THIS FEATURE ONLY HELP TRADER WITH MORE MARGIN....USE THIS FEATURE PROPERLY.THIS FEATURE BEST WORK ON ONE SIDE MEANS ONLY BUY SIDE TRADE OR SELL SIDE TRADE
6)YOU CAN SET YOUR TARGET AND STOPLOSS IN POINTS AND IN PERCENTAGE
7) YOU CAN CHOSE ONE SIDE TO TRADE ONLY BUY SIDE OR SELL SIDE
HOPE THIS FEARTURES HELPS EVERY ONE
ALL THE BEST FOR SUCESSFULL TRADING

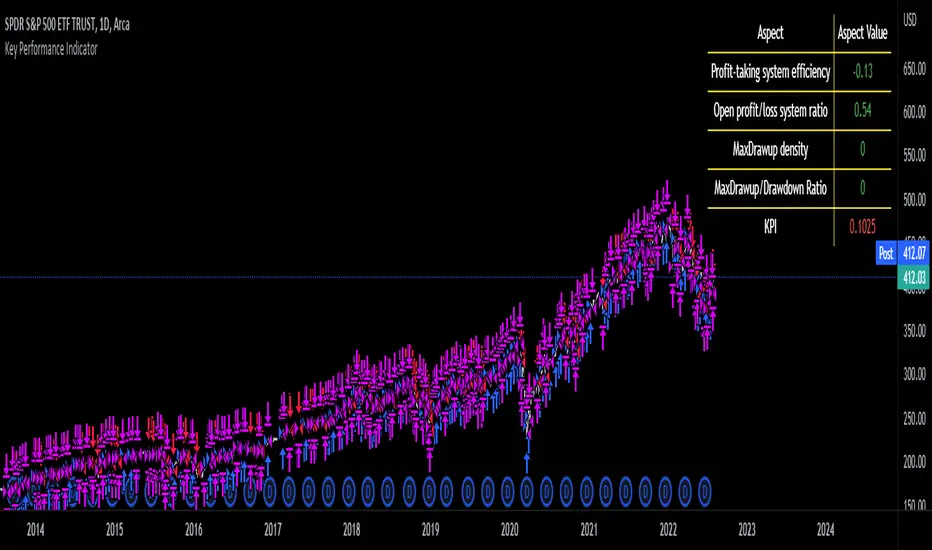
Key Performance IndicatorWe are happy to introduce the Key Performance Indicator by Detlev Matthes. This is an amazing tool to quantify the efficiency of a trading system and identify potential spots of improvement.
Abstract
A key performance indicator with high explanatory value for the quality of trading systems is introduced. Quality is expressed as an indicator and comprises the individual values of qualitative aspects. The work developing the KPI was submitted for the 2017 VTAD Award and won first prize.
Introduction
Imagine that you have a variety of stock trading systems from which to select. During backtesting, each trading system will deliver different results with regard to its indicators (depending on, inter alia, its parameters and the stock used). You will also get different forms of progression for profit development. It requires great experience to select the “best” trading system from this variety of information (provided by several indicators) and significantly varying equity progression forms. In this paper, an indicator will be introduced that expresses the quality of a trading system in just one figure. With such an indicator, you can view the results of one backtest at a glance and also more easily compare a variety of backtesting results with one another.
If you are interested in learning more about the calculations behind this indicator then I have included a link to the english version of his research paper.
Along with this, we now offer indicator development services. If you are interested in learning more then feel free to reach out to get a quote for your project.
**Please note that we have NOT inputted any real strategy into the code and therefore it is not producing any real value. Feel free to change the code as desired to test any strategy!**
drive.google.com
Joint Conditions Strategy Suite + TradingConnector alerts bot"Please give us combined alerts with the possibility of having several conditions in place to trigger the alert." - was the top voted request from users under one of the recent blogposts by TradingView.
Ask and you shall receive ;)
TradingView is a great platform, with unmatched set of functionalities, yet this particular combo of features indeed seems not to be in place. Fortunately, TradingView is also very open platform, thanks to PineScript coding language, which enables developing combos like the requried one and plenty of other magic.
I have already published numerous "educational" scripts, showing how to code indicators and alerts with PineScript, but... this is not one of them. This one is for real. READY FOR USE on real markets, also by the non-coding traders. Just take my script, set parameters with dropdowns, backtest the strategy, fire the alerts and execute them.
HOW TO USE IT
In "Settings" popup I tried to mimic the CreateAlert popup dropdowns for selecting logic. Let's say you want to enter Long position at Stochastic KxD crossover. In first line of Long Entry conditions set "StochK" + "Crossing Up" + "StochD". Last field doesn't matter because in 3rd dropdown something else than "value" was selected. In second line you could set "maB" + "Greater Than" + "maC" to filter out those entries which are in direction of the uptrend. And yeah, add ADX>25 to make sure the market is actually moving: "ADX" + "Greater Than" + "value" + "25". All condition lines must be TRUE (or skipped) for the entry to be triggered. Toghether with an alert.
The same for Short entries. Combinations are limitless.
INDICATORS AND MTF (MULTI-TIMEFRAME)
In those dropdowns you can select candle values like open/close/high/low/ohlc4, but also some most popular indicators, which I have pre-built into this script: RSI, various Moving Averages, ADX-DMI, Stochastic and Bollinger Bands for start. You can configure parameters of those indicators also in "Settings" popup, in "Indicator Definitions" section. What's important, you can use any of these indicators from higher timeframe, setting MTF multiplier. So if you applied this indicator to 1h chart, but want to use rsi(close,14) from 4h chart, set MTF to 4. If you want to use current timeframe indicators, keep MTF at 1, which is a default setting here.
Note for coders: to keep focus of this script on joining conditions, entire logic for those indicators has been moved to external library, also open source. I encourage you to dig into the code and see how it's done. I love the addition of libraries concept in PineScript.
CUSTOM INDICATOR
Following the "openness" spirit of my master - which is TradingView itself - my work is also open, in 2 ways:
1. This script is open source. So you can grab it, modify or add any functionalities you want. I cannot and don't want to stop you from doing that. I'm asking for only one favor - please mention this source script in your credits.
2. You can import the plot (series) from any other indicator on TradingView. In Settings popup of my script, scroll down to "Indicator Definitions" section, and select the series of your choice in the first dropdown. Now it is ready to use in conditions dropdowns on top of the Settings popup.
Let me give you an example of that last scenario. Take another script of mine, "Pivot Points on SR lines DEMO". You can find it in "Indicators & Strategies" library or here: (). Attach it to your chart. Now come back to THIS script, open Settings popup and in "Custom Indicator aka Imported Source" select "Pivot Points on SR lines: ...". The way it works - it detects if a pivot point happened on Support/Resistance line from the past and returns 1 for PivotLow and -1 for Pivot High. Now in first Long Entry condition set: "custom indicator" + "Greater Than" + "value" + "0" and long entries will be marked on every pivot low noticed on Support/Resistance line.
ALERTS
Last but not least - the alerts. This script produces alerts on the entries calculated by strategy logic, as marked on the chart by the backtester. Moreover, syntax of those alerts is already prepared and fully compatible with TradingConnector - alerts executing tool (bot), if you want to auto-execute those trades. Apart from installing the tool, you need to set
up the alerts in TradingView, here is how:
open CreateAlert popup
in first dropdown select "Joint Conditions Strategy Template"
in second dropdown select "alert() function calls only"
And that's all. You only need to set one alert for the whole script, not one for Longs and one for Shorts as it was in the past. Also, you don't need to setup closing alerts, because stop-loss/take-profit/trailing-stop information is embedded in the entry alert so your broker receives it as early as possible. Alerts sent will look like this: "long sl=40 tp=80", which is exactly what TradingConnector expects.
Phew, that's all folks. If you think I should add something to this template (maybe other indicators?) please let me know in comments or via DM. Happy trading!
P.S. Pyramiding is not supported in this script.
Disclaimer : I'm not saying above combination of conditions will make you money. Actually none of this can be considered financial advice. It is only a software tool. Use it wisely, be aware of the risk and do your own research!

Bollinger band & Volume based strategy V2this script is upgraded version of previous one the major change is deleted script which find a highest price after entry the last of strategy is same.
If current volume is above daily average volume, and three bollinger band`s Standard Deviation, 1 and 1.5 and 2 if the current lowest price is bigger then 1 stdev and current closed is bigger then 1.5 stdev and the last,highest price is above 2.0 stdev, it defined current market is bullish and had momentum.
and the Short will entered when ma60 and ma120 is undercrossed it work as prevent current price is way lower then entry price.
**this script is working in 15min Only in BTC market or USDT**
** basic equity setting is 500$, set your own**
**if you will use this in real-trade,plz comment the result to me**
Ps: i wanna know why my script is only working well in 15 min tick, anyone who has similar phenomenon or if you had a answer about it, please comment me.

Linear SSL ShortThis script consist of two parts: linear SSL and DEMA. The difference between original SSL and current is that it calculated by linear regression. The logic is simple: when SSL "crossunder" and DEMA is above the price - we get short signal. When price became above DEMA and SSL "crossover" - close short.

Double Bollinger StrategyFrom "Bitcoin Trading Strategies: Algorithmic Trading Strategies For Bitcoin And Cryptocurrency That Work" by David Hanson.
*Works better with 1hr time frame and some input optimisations.
"Double Bollinger Band Scalping System
Recommended Timeframe: 1 minute or 5 minute *
Required Indicators:
// - RSI with a length of 14 (default settings)
// - Bollinger band #1 settings: Length = 50, stDev = 1 Hide the basis/middle line (basis line not needed for this strategy)
Note: This is the slower bollinger band in the directions
// - Bollinger band #2 settings: Length 20, stDev = 1 Hide the basis/middle line (basis line not needed for this strategy)
Note: This is the faster bollinger band in the directions
Enter Long/Buy Trade When:
// - RSI is above the level 50
// - A candle closes above the top of the faster bollinger band
Enter a long when a candle then closes above the top of the slower bollinger band, and price is above the top of both bands
Place a stop loss under the low of the entry candle Example of a long trade using this strategy
Exit Long Trade When: A candle closes below the top band of the fast bollinger band
Enter Short/Sell Trade When:
// - RSI is below the level 50
// - A candle closes below the bottom of the faster bollinger band
Enter a short when a candle then closes below the bottom of the slower bollinger band, and price is below both bands
Place a stop loss above the high of the entry candle Example of a short trade using this strategy
Exit Short Trade When: Price closes inside the bottom of the faster bollinger band"

HYE Mean Reversion SMA [Strategy]An RSI filtered version of PJ Sutherland's Jaws Mean Reversion algorithm.
"Long" on the close when;
1-) 2 period simple moving average closes 3% or more below the 5 period simple moving average,
2-) 5 period exponential average of the 2 period RSI is below 30.
"Exit Long" on the close when;
1-) 2 period simple moving average closes above the 5 period moving average.
"Short" on the close when;
1-) 2 period simple moving average closes 3% or more above the 5 period simple moving average,
2-) 5 period exponential average of the 2 period RSI is above 70.
"Exit Short" on the close when;
1-) 2 period simple moving average closes below the 5 period moving average.
*** You can change the needed percentage for long and short trades, periods of simple moving averages and RSI levels.
*** You can select the trend direction: "Long Only" , "Short Only" or "Both". Default is "Long Only".

5MA_X_LThis is a 5 day moving average crossing long strategy in 10 min. chart, used in short term momentum trading strategy.
Momentum trading Strategy: When S&P 500 index is at up trend (or above 60 sma ), buy 10+ stocks in top 20% stock RS ranking at equal weight using this MA5X_L strategy. Change stocks when any stock exited by algorithm.
Back test start since 2020/7/1, each long entry for condition 1 is $30000, condition 2 is $20000, with max of 2 long positions.
Setup: 10 minutes chart
Buy condition 1) 3 wma cross up 195 wma (5day) 2) 3wma > 78wma > 195wma UP Trend Arrangement (UTA)
Exit condition 1) 3 wma cross under 195 wma 2) position profit > 20% and 3 wma cross under 6 ATRs line (green)

Stochastic TrendDear community,
I've made another simple trading bot for you to use. This bot is based on the Stochastic Oscillator. It only produces long trades currently.
I changed the oscillation period to a much longer one, which in turn creates opportunities to trade long term trends.
The bot goes long when the Entry lines is crossed from below and it will close its long position once the Exit line has been crossed from above.

Strategy NNFX Tester Strategy NNFX, Baseline, QQEs Fast C1, Slow C2, ATR, Volume and Exit
This is a Strategy Tester designed to work with Study (Alerts) of the same.
At time of creation based on Revision 8 of the Study.
DO NOT USE the Currency/Money Management section under settings. use the position sizing under "Inputs" - "Money Management" - "Risk per trade" which is defaulted to 2%
This has adjustable Baselines, Exits, ATR calculations, C1 and C2 are currently QQE & QQE Histo with adjustable settings but I'll include more choice of C1 & C2 as time goes on.
Find settings that work for you, then move them over to the Study version for best results.
Forward plans are to add much more options to both Alert/Strategy.
If anyone wants to collaborate or anything hit me up.

RSI-VWAP Indicator %█ OVERALL
Simple and effective script that, as you already know, uses vwap as source of the rsi, and with good results as long as the market has no long-term downtrend.
RsiVwap = rsi (vwap (close), Length)
The default settings are for BTC in a 30 minute time frame. For other pairs and time frames you just have to play with the settings.
█ FEATURES
• The option to start trading from a certain date has been added.
• To make the profit more progressive, a percentage of your equity is used for entries and a percentage of your position is used for closings.
• The option to trade in Spot mode has been added, since, for the TradingView backtest, the money is infinite and if you do not limit it somehow,
it would offer you much better profits than the live trading.
QuantityOnLong = Spot ? (EquityPercent / 100) * ((strategy.equity / close) - strategy.position_size) : (EquityPercent / 100) * (strategy.equity / close)
• The option to stop the system when the drawdown exceeds the fixed limit has been added.
Drawdown, as you already know, is a very important measure of risk in trading systems.
The maximum drawdown will tell us what the maximum loss of a trading system has been during a period. This maximum loss is determined by:
strategy.risk.max_drawdown(Risk, strategy.percent_of_equity)
• Leverage plotted on labels added.
█ ALERTS
To enjoy the benefits of automatic trading, TradingView alerts can be used as direct buy-sell orders on spot, or long-close orders with leverage.
Currently there are Chrome extensions that act as a bridge between TradingView and your Exchange or Broker.
This is an example of syntax for this type of extensions. Copy and paste a message like this into the alert window:
{{strategy.order.action}} @ {{strategy.order.price}} | e = {{exchange}} a = account s = {{ticker}} b = {{strategy.order.action}} {{strategy.order.alert_message}}
█ NOTE
Certain Risks of Live Algorithmic Trading You Should Know:
• Backtesting cannot assure actual results.
• The relevant market might fail or behave unexpectedly.
• Your broker may experience failures in its infrastructure, fail to execute your orders in a correct or timely fashion or reject your orders.
• The system you use for generating trading orders, communicating those orders to your broker, and receiving queries and trading results from your broker may fail.
• Time lag at various point in live trading might cause unexpected behavior.
• The systems of third parties in addition to those of the provider from which we obtain various services, your broker, and the applicable securities market may fail or malfunction.
█ THANKS
Thanks to TradingView, its Pine code, its community and especially those Pine wizards who post their ideas that helps us to learn.
If the world is heading toward a equitable new world economic order, let's get rich first ...
Happy trading!

Keltner Channel [LINKUSDT] 1HThis is a long-only strategy tested on LINK/USDT, 1 hour bar, from Feb 2019. The entry is determined by the breakout of upper Keltnel Channel and when the +DI is higher than 32. Instead of a fixed stop-loss from the original script , I change the exit to the middle band of the Keltnel Channel. 1st profit target will close 20% of the position. 2nd profit target will close 30% of the position. While the remaining 50% position will be closed when the price closes below the middle band of the Keltnel Channel, to take advantage of big trend. All parameters are adjustable. I added another option to enable or disable the ribbon trend filter.
My thoughts: For the same period, LINK appreciated 3000%. So I guess most in and out strategies couldn’t beat a buy and hold strategy during this period. But this doesn’t mean that this strategy is not feasible as each strategy is designed to only take advantage of a certain pattern or behavior of the market. Also, short term strategies allow you to use leverage and hence enable you to use you capital efficiently. Commission is set to 0.1%, taking account of the slippage.
Suggestion: Please perform walk forward analysis before you use real money for trading. Parameters need to be adjusted from time to time depends on your analysis. Can try using ATR for profit targets as over a longer term, the volatility might drop hence a high fixed % profit targets might not be realistic.
Any suggestions are welcome!

Simple and efficient swing RSI systemHello there,
I am glad to bring you another simple and efficient algorithm.
Its made purely from RSI which can be used directly or inversed. Its suited for swing trading 15 min chart or more minimum.
Can be adapted to all types of financial markets.
Rules for entry are easy : First we have the stop loss and take profits levels. Based on SL , we have the risk % of our equity, where the minimum lot we can trade its setted on 0.1 lots , can be modified tho.
For entries, we have the overbought and oversold levels.
Whenever we cross one of them we enter the trade . We close the trade whenever we reach sl/tp or inverse crosses.
Although its has a low win rate, its a very good system to catch big trends, so there you can recover all the small losses that you had in a untrend market .
Aswell it requires a lot of patience, since a position can be kept for weeks, even months.
Hope you enjoyed it .

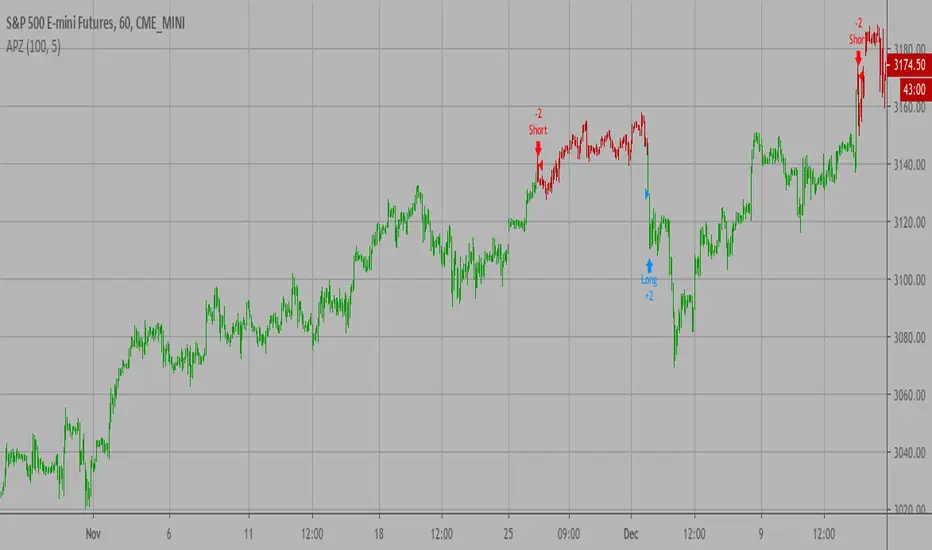
Coinbase_3-MIN_HFT-StrategyThis conceptual strategy trades against the short-term trend. The first position can be either long or short.
In the short-term, prices fluctuate up and down on wide spread exchanges.
And if the price moves to one side, the price tends to return to its original position momentarily.
This strategy set stop order. Stop price is calculated with upper and lower shadows.
Combo Backtest 123 Reversal & CMOaDisparity Index This is combo strategies for get a cumulative signal.
First strategy
This System was created from the Book "How I Tripled My Money In The
Futures Market" by Ulf Jensen, Page 183. This is reverse type of strategies.
The strategy buys at market, if close price is higher than the previous close
during 2 days and the meaning of 9-days Stochastic Slow Oscillator is lower than 50.
The strategy sells at market, if close price is lower than the previous close price
during 2 days and the meaning of 9-days Stochastic Fast Oscillator is higher than 50.
Second strategy
The related CMOaDisparity Index article is copyrighted material from Stocks & Commodities Dec 2009
My strategy modification.
WARNING:
- For purpose educate only
- This script to change bars colors.

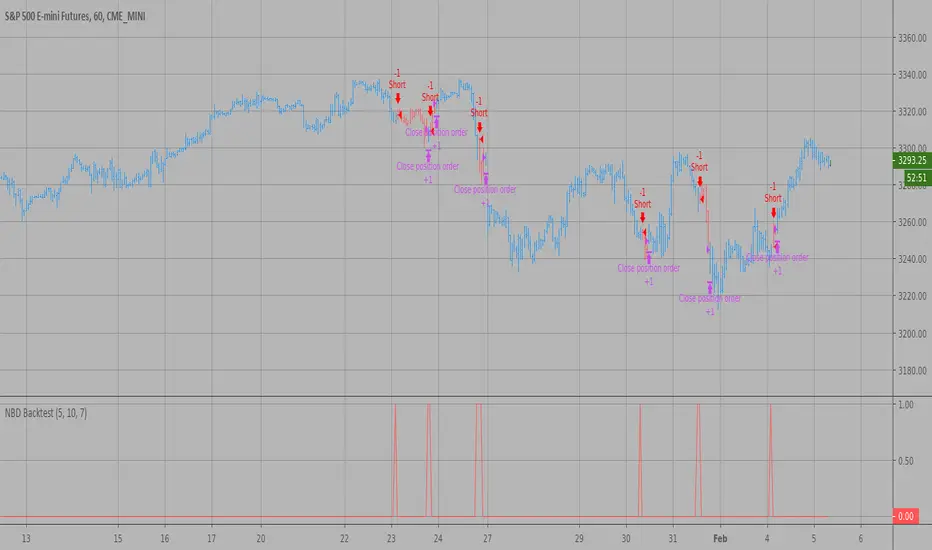
N Bars Down Backtest Evaluates for n number of consecutive lower closes. Returns a value
of 1 when the condition is true or 0 when false.
WARNING:
- For purpose educate only
- This script to change bars colors.
N Bars Up Backtest Evaluates for n number of consecutive higher closes. Returns a value
of 1 when the condition is true or 0 when false.
WARNING:
- For purpose educate only
- This script to change bars colors.

Adaptive Price Zone Backtest The adaptive price zone (APZ) is a volatility-based technical indicator that helps investors
identify possible market turning points, which can be especially useful in a sideways-moving
market. It was created by technical analyst Lee Leibfarth in the article “Identify the
Turning Point: Trading With An Adaptive Price Zone,” which appeared in the September 2006 issue
of the journal Technical Analysis of Stocks and Commodities.
This indicator attempts to signal significant price movements by using a set of bands based on
short-term, double-smoothed exponential moving averages that lag only slightly behind price changes.
It can help short-term investors and day traders profit in volatile markets by signaling price
reversal points, which can indicate potentially lucrative times to buy or sell. The APZ can be
implemented as part of an automated trading system and can be applied to the charts of all tradeable assets.
WARNING:
- For purpose educate only
- This script to change bars colors.