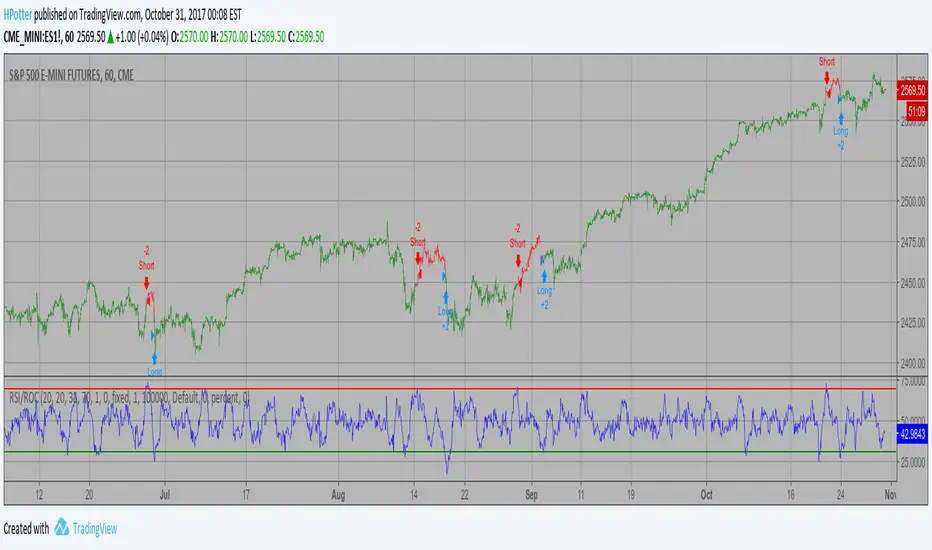
RSI based on ROC Backtest This is the new-age indicator which is version of RSI calculated upon
the Rate-of-change indicator.
The name "Relative Strength Index" is slightly misleading as the RSI
does not compare the relative strength of two securities, but rather
the internal strength of a single security. A more appropriate name
might be "Internal Strength Index." Relative strength charts that compare
two market indices, which are often referred to as Comparative Relative Strength.
And in its turn, the Rate-of-Change ("ROC") indicator displays the difference
between the current price and the price x-time periods ago. The difference can
be displayed in either points or as a percentage. The Momentum indicator displays
the same information, but expresses it as a ratio.
You can change long to short in the Input Settings
WARNING:
- For purpose educate only
- This script to change bars colors.
In den Scripts nach "algo" suchen
Relative Volatility Index Backtest The RVI is a modified form of the relative strength index (RSI).
The original RSI calculation separates one-day net changes into
positive closes and negative closes, then smoothes the data and
normalizes the ratio on a scale of zero to 100 as the basis for the
formula. The RVI uses the same basic formula but substitutes the
10-day standard deviation of the closing prices for either the up
close or the down close. The goal is to create an indicator that
measures the general direction of volatility. The volatility is
being measured by the 10-days standard deviation of the closing prices.
You can change long to short in the Input Settings
WARNING:
- For purpose educate only
- This script to change bars colors.

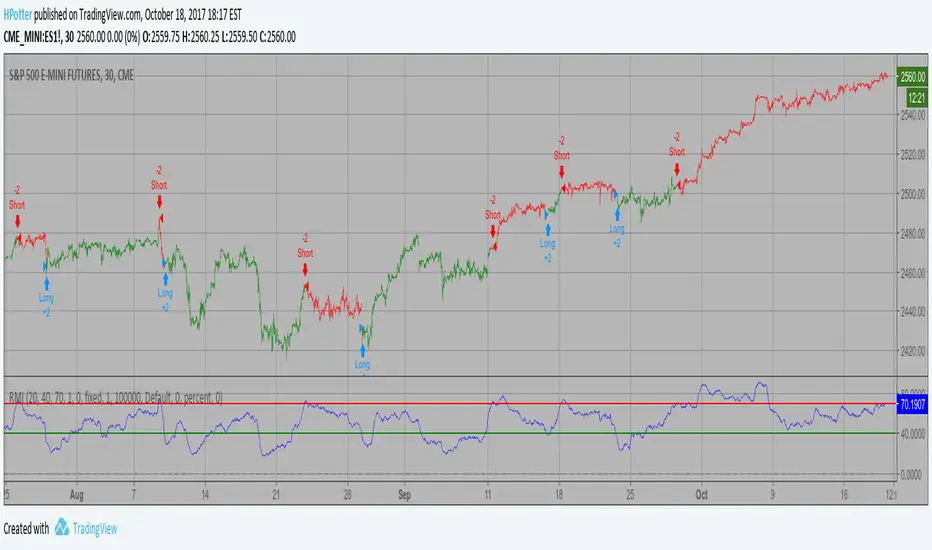
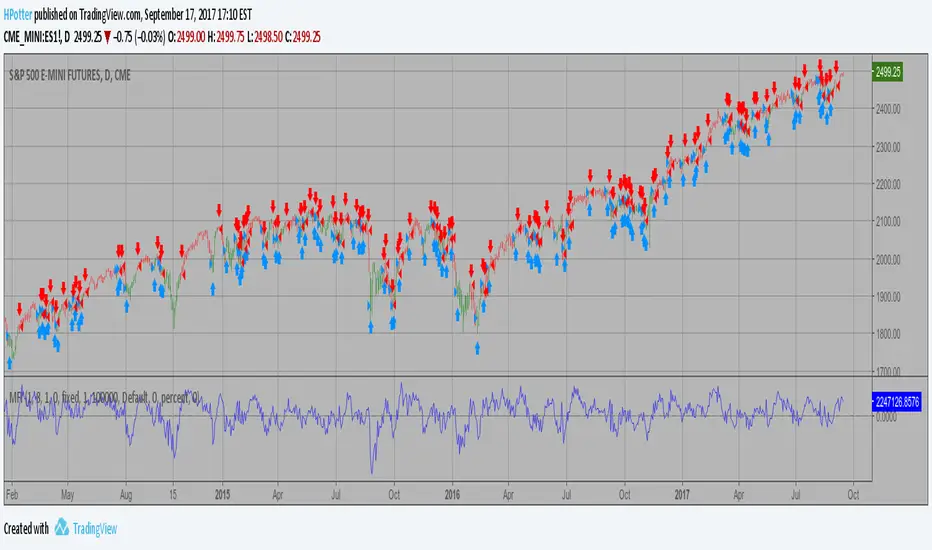
Relative Momentum Index Backtest The Relative Momentum Index (RMI) was developed by Roger Altman. Impressed
with the Relative Strength Index's sensitivity to the number of look-back
periods, yet frustrated with it's inconsistent oscillation between defined
overbought and oversold levels, Mr. Altman added a momentum component to the RSI.
As mentioned, the RMI is a variation of the RSI indicator. Instead of counting
up and down days from close to close as the RSI does, the RMI counts up and down
days from the close relative to the close x-days ago where x is not necessarily
1 as required by the RSI). So as the name of the indicator reflects, "momentum" is
substituted for "strength".
You can change long to short in the Input Settings
WARNING:
- For purpose educate only
- This script to change bars colors.
Range Action Verification Index (RAVI) Backtest The indicator represents the relative convergence/divergence of the moving
averages of the financial asset, increased a hundred times. It is based on
a different principle than the ADX. Chande suggests a 13-week SMA as the
basis for the indicator. It represents the quarterly (3 months = 65 working days)
sentiments of the market participants concerning prices. The short moving average
comprises 10% of the one and is rounded to seven.
You can change long to short in the Input Settings
WARNING:
- For purpose educate only
- This script to change bars colors.

Positive Volume Index Backtest The theory behind the indexes is as follows: On days of increasing volume,
you can expect prices to increase, and on days of decreasing volume, you can
expect prices to decrease. This goes with the idea of the market being in-gear
and out-of-gear. Both PVI and NVI work in similar fashions: Both are a running
cumulative of values, which means you either keep adding or subtracting price
rate of change each day to the previous day`s sum. In the case of PVI, if today`s
volume is less than yesterday`s, don`t add anything; if today`s volume is greater,
then add today`s price rate of change. For NVI, add today`s price rate of change
only if today`s volume is less than yesterday`s.
You can change long to short in the Input Settings
WARNING:
- For purpose educate only
- This script to change bars colors.

Simply Stochastic Backtest This back testing strategy generates a long trade at the Open of the following
bar when the %K line crosses up UpBand line.
It generates a short trade at the Open of the following bar when the %K line
crosses down DownBand line.
You can change long to short in the Input Settings
WARNING:
- For purpose educate only
- This script to change bars colors.

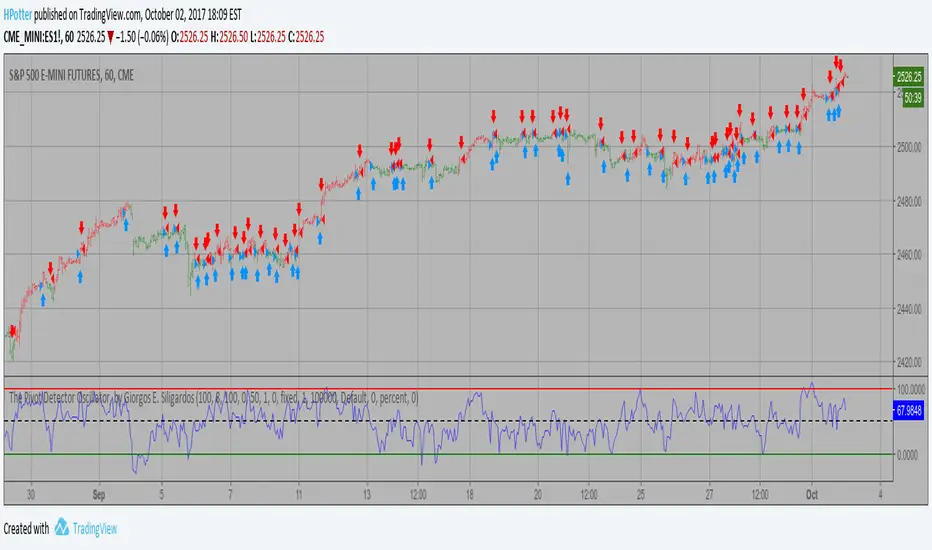
The Pivot Detector Oscillator Backtest The Pivot Detector Oscillator, by Giorgos E. Siligardos
The related article is copyrighted material from Stocks & Commodities 2009 Sep
You can change long to short in the Input Settings
WARNING:
- For purpose educate only
- This script to change bars colors.
PFE (Polarized Fractal Efficiency) Backtest The Polarized Fractal Efficiency (PFE) indicator measures the efficiency
of price movements by drawing on concepts from fractal geometry and chaos
theory. The more linear and efficient the price movement, the shorter the
distance the prices must travel between two points and thus the more efficient
the price movement.
You can change long to short in the Input Settings
WARNING:
- For purpose educate only
- This script to change bars colors.

Percentage Volume Oscillator (PVO) Backtest The Percentage Volume Oscillator (PVO) is a momentum oscillator for volume.
PVO measures the difference between two volume-based moving averages as a
percentage of the larger moving average. As with MACD and the Percentage Price
Oscillator (PPO), it is shown with a signal line, a histogram and a centerline.
PVO is positive when the shorter volume EMA is above the longer volume EMA and
negative when the shorter volume EMA is below. This indicator can be used to define
the ups and downs for volume, which can then be use to confirm or refute other signals.
Typically, a breakout or support break is validated when PVO is rising or positive.
You can change long to short in the Input Settings
WARNING:
- For purpose educate only
- This script to change bars colors.

Overbought/Oversold Simple Overbought/Oversold indicator
You can change long to short in the Input Settings
WARNING:
- For purpose educate only
- This script to change bars colors.
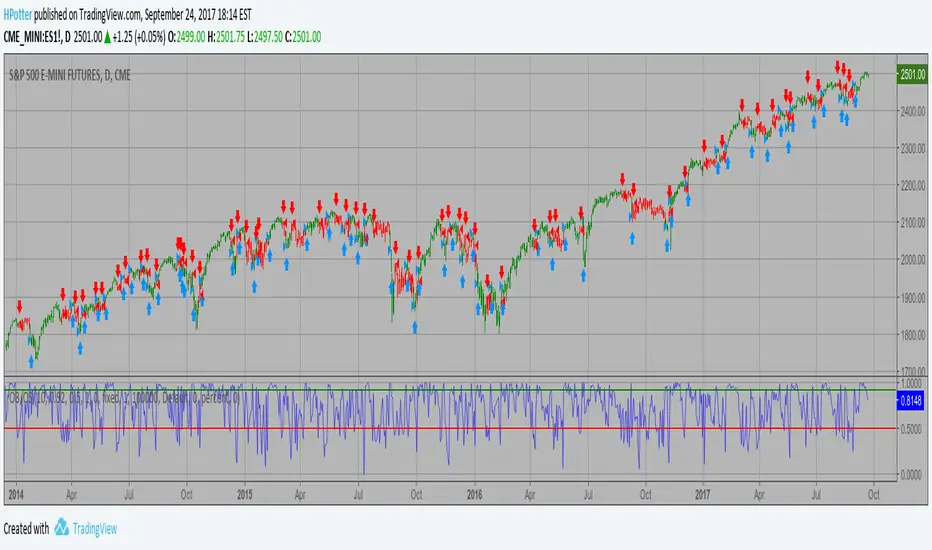
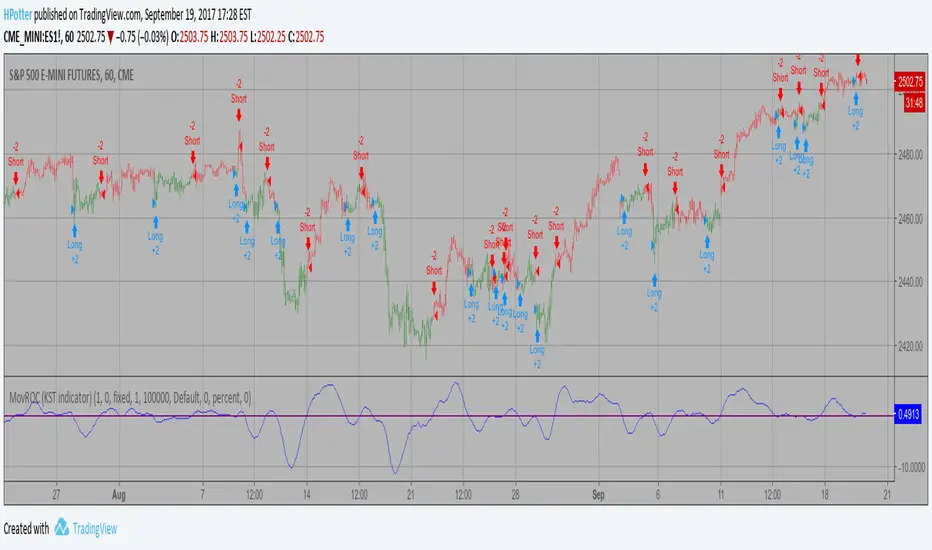
MovROC (KST indicator) Backtes This indicator really is the KST indicator presented by Martin Pring.
the KST indicator is a weighted summed rate of change oscillator that
is designed to identify meaningful turns. Various smoothed rate of change
indicators can be combined to form different measurements of cycles.
You can change long to short in the Input Settings
WARNING:
- For purpose educate only
- This script to change bars colors.
Money Flow Indicator (Chaikin Oscillator) Indicator plots Money Flow Indicator (Chaikin). This indicator looks
to improve on Larry William's Accumulation Distribution formula that
compared the closing price with the opening price. In the early 1970's,
opening prices for stocks stopped being transmitted by the exchanges.
This made it difficult to calculate Williams' formula. The Chaikin
Oscillator uses the average price of the bar calculated as follows
(High + Low) /2 instead of the Open.
The indicator subtracts a 10 period exponential moving average of the
AccumDist function from a 3 period exponential moving average of the
AccumDist function.
You can change long to short in the Input Settings
WARNING:
- For purpose educate only
- This script to change bars colors.
MASS Index Backtest The Mass Index was designed to identify trend reversals by measuring
the narrowing and widening of the range between the high and low prices.
As this range widens, the Mass Index increases; as the range narrows
the Mass Index decreases.
The Mass Index was developed by Donald Dorsey.
You can change long to short in the Input Settings
WARNING:
- For purpose educate only
- This script to change bars colors.

MACD Crossover Backtest MACD – Moving Average Convergence Divergence. The MACD is calculated
by subtracting a 26-day moving average of a security's price from a
12-day moving average of its price. The result is an indicator that
oscillates above and below zero. When the MACD is above zero, it means
the 12-day moving average is higher than the 26-day moving average.
This is bullish as it shows that current expectations (i.e., the 12-day
moving average) are more bullish than previous expectations (i.e., the
26-day average). This implies a bullish, or upward, shift in the supply/demand
lines. When the MACD falls below zero, it means that the 12-day moving average
is less than the 26-day moving average, implying a bearish shift in the
supply/demand lines.
A 9-day moving average of the MACD (not of the security's price) is usually
plotted on top of the MACD indicator. This line is referred to as the "signal"
line. The signal line anticipates the convergence of the two moving averages
(i.e., the movement of the MACD toward the zero line).
Let's consider the rational behind this technique. The MACD is the difference
between two moving averages of price. When the shorter-term moving average rises
above the longer-term moving average (i.e., the MACD rises above zero), it means
that investor expectations are becoming more bullish (i.e., there has been an
upward shift in the supply/demand lines). By plotting a 9-day moving average of
the MACD, we can see the changing of expectations (i.e., the shifting of the
supply/demand lines) as they occur.
You can change long to short in the Input Settings
WARNING:
- For purpose educate only
- This script to change bars colors.

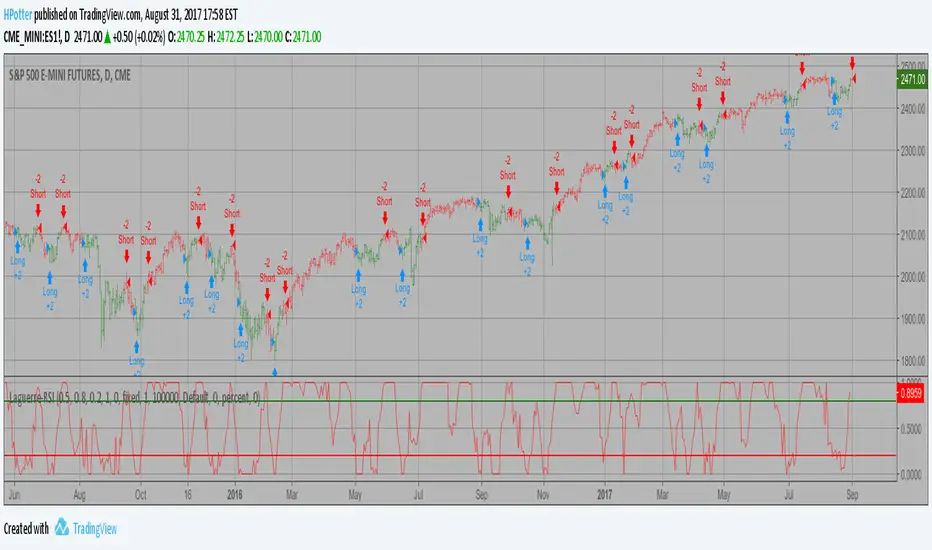
Laguerre-based RSI Backtest This is RSI indicator which is more sesitive to price changes.
It is based upon a modern math tool - Laguerre transform filter.
With help of Laguerre filter one becomes able to create superior
indicators using very short data lengths as well. The use of shorter
data lengths means you can make the indicators more responsive to
changes in the price.
You can change long to short in the Input Settings
WARNING:
- For purpose educate only
- This script to change bars colors.
Klinger Volume Oscillator (KVO) Backtest The Klinger Oscillator (KO) was developed by Stephen J. Klinger. Learning
from prior research on volume by such well-known technicians as Joseph Granville,
Larry Williams, and Marc Chaikin, Mr. Klinger set out to develop a volume-based
indicator to help in both short- and long-term analysis.
The KO was developed with two seemingly opposite goals in mind: to be sensitive
enough to signal short-term tops and bottoms, yet accurate enough to reflect the
long-term flow of money into and out of a security.
The KO is based on the following tenets:
Price range (i.e. High - Low) is a measure of movement and volume is the force behind
the movement. The sum of High + Low + Close defines a trend. Accumulation occurs when
today's sum is greater than the previous day's. Conversely, distribution occurs when
today's sum is less than the previous day's. When the sums are equal, the existing trend
is maintained.
Volume produces continuous intra-day changes in price reflecting buying and selling pressure.
The KO quantifies the difference between the number of shares being accumulated and distributed
each day as "volume force". A strong, rising volume force should accompany an uptrend and then
gradually contract over time during the latter stages of the uptrend and the early stages of
the following downtrend. This should be followed by a rising volume force reflecting some
accumulation before a bottom develops.
You can change long to short in the Input Settings
Please, use it only for learning or paper trading.

Kaufman Moving Average Adaptive (KAMA) Backtest Everyone wants a short-term, fast trading trend that works without large
losses. That combination does not exist. But it is possible to have fast
trading trends in which one must get in or out of the market quickly, but
these have the distinct disadvantage of being whipsawed by market noise
when the market is volatile in a sideways trending market. During these
periods, the trader is jumping in and out of positions with no profit-making
trend in sight. In an attempt to overcome the problem of noise and still be
able to get closer to the actual change of the trend, Kaufman developed an
indicator that adapts to market movement. This indicator, an adaptive moving
average (AMA), moves very slowly when markets are moving sideways but moves
swiftly when the markets also move swiftly, change directions or break out of
a trading range.
You can change long to short in the Input Settings
Please, use it only for learning or paper trading. Do not for real trading.

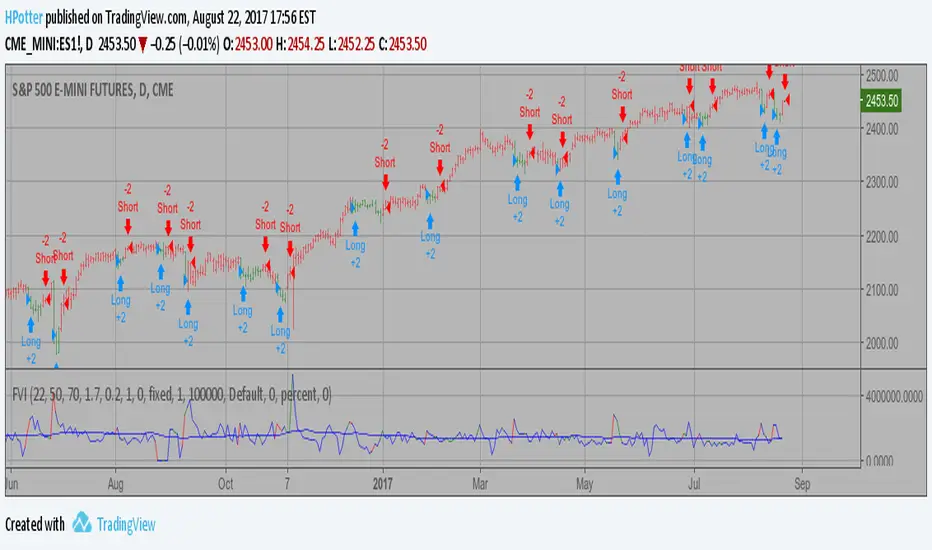
Volatility Finite Volume Elements Strategy The FVE is a pure volume indicator. Unlike most of the other indicators
(except OBV), price change doesn?t come into the equation for the FVE
(price is not multiplied by volume), but is only used to determine whether
money is flowing in or out of the stock. This is contrary to the current trend
in the design of modern money flow indicators. The author decided against a
price-volume indicator for the following reasons:
- A pure volume indicator has more power to contradict.
- The number of buyers or sellers (which is assessed by volume) will be the same,
regardless of the price fluctuation.
- Price-volume indicators tend to spike excessively at breakouts or breakdowns.
This study is an addition to FVE indicator. Indicator plots different-coloured volume
bars depending on volatility.
You can change long to short in the Input Settings
Please, use it only for learning or paper trading. Do not
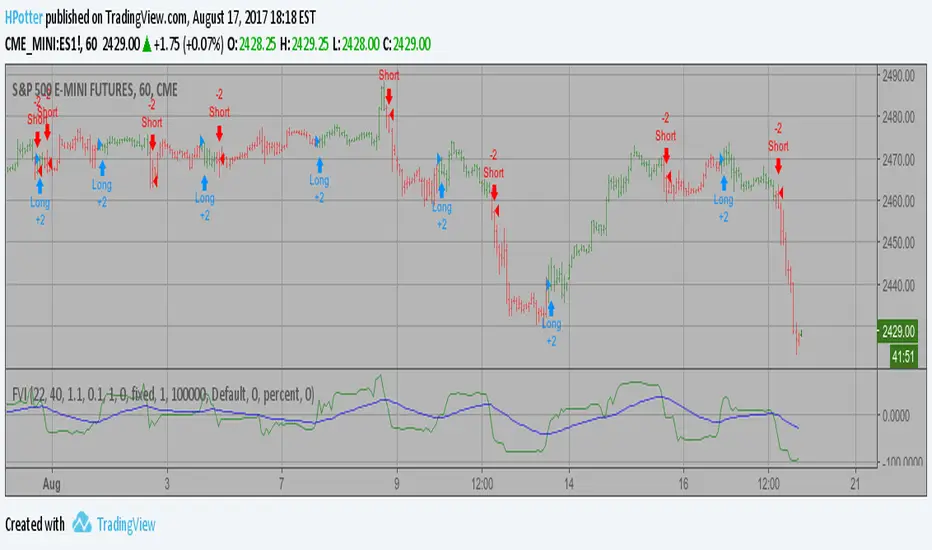
Volatility Finite Volume Elements Backtest This version has an important enhancement to the previous one that`s
especially useful with intraday minute charts.
Due to the volatility had not been taken into account to avoid the extra
complication in the formula, the previous formula has some drawbacks:
The main drawback is that the constant cutoff coefficient will overestimate
price changes in minute charts and underestimate corresponding changes in
weekly or monthly charts.
And now the indicator uses adaptive cutoff coefficient which will adjust to
all time frames automatically.
You can change long to short in the Input Settings
Please, use it only for learning or paper trading. Do not for real trading.
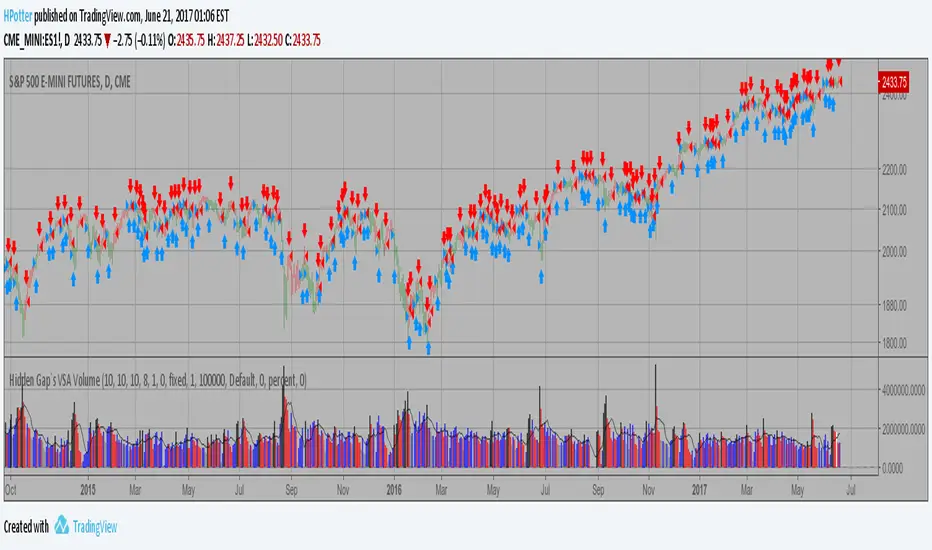
Hidden Gap`s VSA Volume If Volume is less then the previous 20 intervals, Volume is gray.
If Volume is greater then the previous 40 intervals, Volume is black.
If Volume is less then the previous 2 intervals, Volume is purple.
If Volume is less then the previous, Volume is red.
If Volume is greater then the previous, Volume is blue.
Other - white.
You can add on the indicator a 2.5 Standart Deviation of a 20 period
Bollinger Band Shifted 3 periods forward.
You can change long to short in the Input Settings
Please, use it only for learning or paper trading. Do not for real trading.
Gann Trend Oscillator Backtest The Gann Swing Oscillator has been adapted from Robert Krausz's book,
"A W.D. Gann Treasure Discovered". The Gann Swing Oscillator helps
define market swings.
You can change long to short in the Input Settings
Please, use it only for learning or paper trading. Do not for real trading.

Gann Swing Oscillator The Gann Swing Oscillator has been adapted from Robert Krausz's book,
"A W.D. Gann Treasure Discovered". The Gann Swing Oscillator helps
define market swings.
You can change long to short in the Input Settings
Please, use it only for learning or paper trading. Do not for real trading.

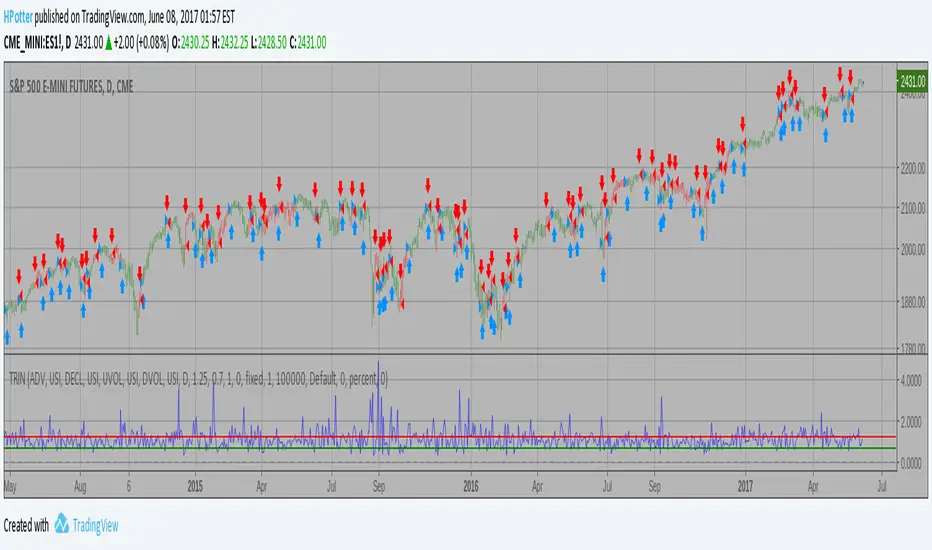
Arms Index (TRIN) Backtest The Arms index (TRIN) is a technical analysis indicator that compares advancing
and declining stock issues and trading volume as an indicator of overall market
sentiment. It measures the relationship between market supply and demand and is
used as a predictor of future price movements in the market, primarily on an
intraday basis. The Arms index seeks to provide a more dynamic explanation of
overall movements in the composite value of stock exchanges, such as the NYSE or
NASDAQ, by analyzing the strength and breadth of these movements.
You can change long to short in the Input Settings
Please, use it only for learning or paper trading. Do not for real trading.