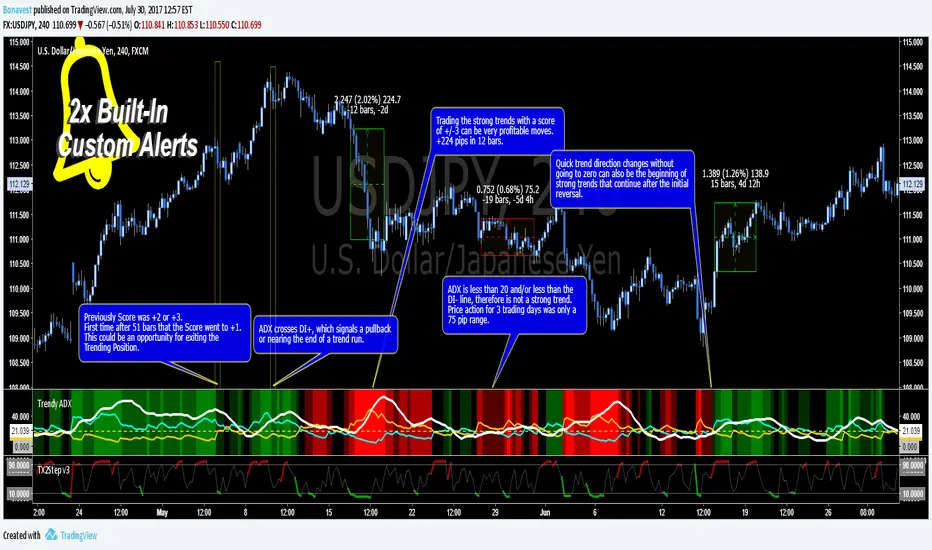
Trendy ADX DI+ DI- Trend Strength - BonavestTo add this indicator to your charts:
Click the 'Add to Favorite Scripts' button down below this description.
Trendy ADX is a lower indicator that is used to determine strength of trends. The DI+ and DI- lines cross one another depending on the trend direction based on the Length input with the current trend, DI line, being on top or higher.
The ADX line shows the strength of the current trend, with a value over 20 being a trend with growing strength. Trends with ADX less than 20 are said to not be strong enough to be traded as well as if the ADX is less than both the DI+ and DI- even though it is higher than 20.
An added number value that is not a part of the typical ADX/DI indicator is the 'Score'. This is a value that ranges from -3 to +3 including 0. This score allows you to set alerts based on Score and be alerted when a certain level is reached. The Score values are fully configureable in the Input Settings screen.
The Length setting is the only important adjustment for the indicator itself. The 3 suggested values to use are 7, 11 and 20 (default 11).
The Threshold setting is purely for visual adjustment of the yellow dashed line (default 20).
I use this indicator for:
Keeps me in a trade longer to capture long trends
Determining if the current trend has more room to continue
Filter out reversal buy/sell signals if trend is just beginning
My observations in using this indicator is to ignore reversal signals if the ADX line has not crossed above the DI+ or DI- line of the current trend (red/green background). I also expect a small pullback or sideways price action when the ADX line does cross the current trending DI line.
There are 2 Built-In Notifications already created for you and are available by simply right clicking in the indicator area and selecting:
Condition: Trendy ADX
Then 1 of the 2 Alerts:
Trend Direction Change - Score crosses 0 changing to 1 (green/UP) or -1 (red/DOWN)
Trend Strength Change - Score changes in any direction by a value of 1
How to Trade the Average Directinal Index Video: youtu.be
This adaptation was based off of the original code from @MasaNakamura.
In den Scripts nach "adx" suchen
DMI-ADX HistogramThe Average Direction Index (ADX) coupled with the Direction Movement Index (DMI), developed by J. Welles Wilder, is a popular indicator that measures trend direction and strength.
The AX line (blue) is used to show the strength of the current trend. It does not tell you the trend direction. The under laid histogram shows relative movements of the price with green showing positive momentum and red showing negative momentum. Use these ADX and DMI together to find trend strength and direction.
- ADX line below 20 indicates that the underlying is in accumulation/distribution.
- ADX line above 20 mean that the underlying is trending with over 60 being very strong.
*When the ADX line is below 20 it is likely to see many reversal signals on the DMI Histogram. It is best to use the DMI signals when the ADX line is above 20 or higher. This is also a good level to play around with.
Motivation
Normally the direction movements are plotted as lines with the DI+ being green and the DI- being red. When the DI+ (green) crosses over DI- (red) this may indicate a buy signal, and vice versa. I found this visual representation made it difficult to see signals as well as lacked the ability to easy see the relative strength of other moves.
I have also noticed that the histogram values will periodically cross the ADX line, but not for very long periods. This could be a useful signal to explore further in the future.
In this image the top indicator is using the normal DI+/- lines, where the bottom indicator is using an absolute histogram.

Ichimoku Cloud and ADX with Trailing Stop Loss (by Coinrule)The Ichimoku Cloud is a collection of technical indicators that show support and resistance levels, as well as momentum and trend direction. It does this by taking multiple averages and plotting them on a chart. It also uses these figures to compute a “cloud” that attempts to forecast where the price may find support or resistance in the future.
The Ichimoku Cloud was developed by Goichi Hosoda, a Japanese journalist, and published in the late 1960s. It provides more data points than the standard candlestick chart. While it seems complicated at first glance, those familiar with how to read the charts often find it easy to understand with well-defined trading signals.
The Ichimoku Cloud is composed of five lines or calculations, two of which comprise a cloud where the difference between the two lines is shaded in.
The lines include a nine-period average, a 26-period average, an average of those two averages, a 52-period average, and a lagging closing price line.
The cloud is a key part of the indicator. When the price is below the cloud, the trend is down. When the price is above the cloud, the trend is up.
The above trend signals are strengthened if the cloud is moving in the same direction as the price. For example, during an uptrend, the top of the cloud is moving up, or during a downtrend, the bottom of the cloud is moving down.
DMI is simple to interpret. When +DI > - DI, it means the price is trending up. On the other hand, when -DI > +DI, the trend is weak or moving on the downside. The ADX does not give an indication of the direction but about the strength of the trend.
Typically values of ADX above 25 mean that the trend is steeply moving up or down, based on the -DI and +DI positioning. This script aims to capture swings in the DMI, and thus, in the trend of the asset, using a contrarian approach.
Trading on high values of ADX, the strategy tries to spot extremely oversold and overbought conditions. Values of ADX above 45 may suggest that the trend has overextended and is maybe about to reverse.
This strategy combines the Ichimoku Cloud with the ADX indicator to better enter trades.
Long orders are placed when these basic signals are triggered.
Long Position:
Tenkan-Sen is above the Kijun-Sen
Chikou-Span is above the close of 26 bars ago
Close is above the Kumo Cloud
MACD line crosses over the signal line
-DI is greater than +DI
ADX is greater than 45
Close Position:
3% increase trailing
3% decrease trailing
The script is backtested from December 2022 and provides good returns.
A trading fee of 0.1% is also taken into account and is aligned to the base fee applied on Binance.

Ichimoku Cloud and ADX with Trailing Stop Loss (by Coinrule)The Ichimoku Cloud is a collection of technical indicators that show support and resistance levels, as well as momentum and trend direction. It does this by taking multiple averages and plotting them on a chart. It also uses these figures to compute a “cloud” that attempts to forecast where the price may find support or resistance in the future.
The Ichimoku Cloud was developed by Goichi Hosoda, a Japanese journalist, and published in the late 1960s. It provides more data points than the standard candlestick chart. While it seems complicated at first glance, those familiar with how to read the charts often find it easy to understand with well-defined trading signals.
The Ichimoku Cloud is composed of five lines or calculations, two of which comprise a cloud where the difference between the two lines is shaded in.
The lines include a nine-period average, a 26-period average, an average of those two averages, a 52-period average, and a lagging closing price line.
The cloud is a key part of the indicator. When the price is below the cloud, the trend is down. When the price is above the cloud, the trend is up.
The above trend signals are strengthened if the cloud is moving in the same direction as the price. For example, during an uptrend, the top of the cloud is moving up, or during a downtrend, the bottom of the cloud is moving down.
DMI is simple to interpret. When +DI > - DI, it means the price is trending up. On the other hand, when -DI > +DI , the trend is weak or moving on the downside. The ADX does not give an indication about the direction but about the strength of the trend.
Typically values of ADX above 25 mean that the trend is steeply moving up or down, based on the -DI and +D positioning. This script aims to capture swings in the DMI, and thus, in the trend of the asset, using a contrarian approach.
Trading on high values of ADX, the strategy tries to spot extremely oversold and overbought conditions. Values of ADX above 45 may suggest that the trend has overextended and is may be about to reverse.
This strategy combines the Ichimoku Cloud with the ADX indicator to better enter trades.
Long orders are placed when these basic signals are triggered.
Long Position:
Tenkan-Sen is above the Kijun-Sen
Chikou-Span is above the close of 26 bars ago
Close is above the Kumo Cloud
MACD line crosses over the signal line
-DI is greater than +DI
ADX is greater than 45
Close Position:
3% increase trailing
3% decrease trailing
The script is backtested from 1 January 2018 and provides good returns.
The strategy assumes each order is using 30% of the available coins to make the results more realistic and to simulate you only ran this strategy on 30% of your holdings. A trading fee of 0.1% is also taken into account and is aligned to the base fee applied on Binance.
This script also works well on MATIC (1d timeframe), ETH (1d timeframe), and SOL (1d timeframe).

DMA: ADX L30A modified version of the ADX indicator
Indicator average directional movement ( ADX ) helps traders determine the strength of the trend, not its actual direction. It can be used to determine whether changes in the market or starts a new trend. It refers to the average directional movement Index (DMI), and, in fact, included DMI ADX line . The oscillator ranges from 0 to 100, where high values noted a strong trend and low readings indicate a weak trend. It is often combined with directional indicators. The indicator was developed by Welles Wilder, who has created several leading trading indicators.
Disconnected the lines DI and set the horizontal level 30
-----
Модифицированная версия индикатора ADX .
Индикатор среднего направленного движения ( ADX ) помогает трейдерам определить силу тренда, а не его фактическое направление. Его можно использовать, чтобы выяснить, меняется ли рынок, или начинается новый тренд. Он относится к Индексу направленного движения (DMI) и, фактически, в DMI включена линия ADX . Осциллятор колеблется от 0 до 100, где высокие показания отмечают сильный тренд, а низкие показания указывают на слабый тренд. Он часто комбинируется с направленными индикаторами. Индикатор был разработан Уэллсом Уайлдером, который создал несколько ведущих торговых индикаторов.
Отключены линии DI и установлен горизонтальный уровень на значении 30

ADX Multi-TimeframeADX is a lagging trend indicator designed by J Welles Wilder and indicates the strength of a trend, or when a stock is in a strong uptrend or downtrend, or whether it's moving sideways.
However, the ADX does not indicate if the trend as bullish or bearish. It merely indicates the strength of the current trend.
Also, ADX does not give entry or exit signals. It does, however, give you some perspective on where the stock is in the trend.
HOW IS IT USED ?
When ADX is between 0 and 20 it indicates that the stock is in a trading range and you'd need an oscillator indicator to determine entry and exit points.
When ADX moves above 20 it indicates the beginning of a trend, though it could be an uptrend or a downtrend so remember to verify whether it is an uptrend or a downtrend before you commit to the trade.
When ADX moves above 30 it indicates the start of strong trend !
Once ADX moves above 50 it becomes more probable that the trend is coming to an end and trading ranges developing again.
I added the possibility to add on the chart a 2nd timeframe for trend confirmation.
Please comment in case you would have any recomandation.
If you found this script useful, a tip is always welcome... :)

SwingTrade ADX Strategy v6This is a swing trading strategy that combines VWAP (Volume Weighted Average Price), ADX (Average Directional Index) for trend strength, and volume ratios to generate long/short entry and exit signals. It's designed for daily charts but can be adapted.
#### Key Features:
- **Entries**: Based on VWAP crossovers, rising/falling delta (price deviation from VWAP), ADX trend confirmation, and volume ratios.
- **Exits**: Dynamic exits when VWAP delta reverses after a peak.
- **Filters**: Optional toggles for VWAP signals, ADX, and volume. Backtest date range for custom periods.
- **Visuals**: VWAP line, signal shapes/labels, and an info panel showing key metrics (VWAP Delta %, ADX, Volume Ratio).
- **Alerts**: Built-in alerts for buy/sell entries and exits.
#### How to Use:
1. Apply to your chart (e.g., stocks, forex, crypto).
2. Adjust parameters in the settings (e.g., ADX threshold, volume period).
3. Enable/disable indicators as needed.
4. Backtest using the date filters and review equity curve.
**Disclaimer**: This is for educational purposes only. Past performance is not indicative of future results. Not financial advice—trade at your own risk. Backtest thoroughly and use with proper risk management.
Feedback welcome! If you find it useful, give it a like.

Double Supertrend Entry with ADX Filter and ATR Exits/EntriesThe Double Supertrend Entry with ADX Filter and ATR Exits/Entries indicator is a custom trading strategy designed to help traders identify potential buy and sell signals in trending markets. This indicator combines the strengths of multiple technical analysis tools, enhancing the effectiveness of the overall strategy.
Key features:
Two Supertrend Indicators - The indicator includes two Supertrend indicators with customizable parameters. These trend-following indicators calculate upper and lower trendlines based on the ATR and price. Buy signals are generated when the price crosses above both trendlines, and sell signals are generated when the price crosses below both trendlines.
ADX Filter - The Average Directional Index (ADX) is used to filter out weak trends and only generate buy/sell signals when the market exhibits a strong trend. The ADX measures the strength of the trend, and a customizable threshold level ensures that trades are only entered during strong trends.
ATR-based Exits and Entries - The indicator uses the Average True Range (ATR) to set profit target and stop-loss levels. ATR is a measure of market volatility, and these levels help traders determine when to exit a trade to secure profit or minimize loss.
Performance Statistics Table - A table is displayed on the chart, recording and showing the total number of winning trades, losing trades, percentage of profitable trades, average profit, and average loss. This information helps traders evaluate the performance of the strategy over time.
The Double Supertrend Entry with ADX Filter and ATR Exits/Entries indicator is a powerful trend-following strategy that can assist traders in making more informed decisions in the financial markets. By combining multiple technical analysis tools and providing performance statistics, this indicator helps traders improve their trading strategy and evaluate its success.

RSI & ADX [APIDEVs]The RSI ( Relative Strength Index ) is an oscillator-type indicator used by traders who perform technical analysis to estimate the status of overbought or oversold of an asset on the stock market.
This tool gives the trader the advantage of comparing supply and demand (buying and selling), therefore, we must take into account the following interpretation for its use.
If the buy and sell index are equal, the indicator takes a percentage value of 50, which indicates that the relative forces are in equity.
As its value is over 50%, it indicates that the buyer interest is higher than the seller.
When it is less than 50%, then we must know that the selling force is greater.
It also indicates that when the RSI is above 70 on the oscillator, the price is oversold, therefore, it should exit the market.
Similarly, when the RSI is below 30, the asset is oversold, so it is considered convenient to buy.
NEW RSI & ADX
The main improvement lies in the incorporation of a script that allows to visually observe the force of the movement and that this reinforces the perception of the RSI trajectory. It is for this reason that we incorporate the Average Directional Index ( ADX ) in this indicator so that through its logic it can provide other visual elements to help traders.
In this merger we try to maintain the original design of the RSI in order to make a clean integration that does not confuse traders with another indicator.
Improvements made:
• The coloration resulting from the crossing of the DI + and DI- of the ADX was incorporated into the line that marks point 50 of this indicator.
o When the Di + is above the DI- the trend is bullish therefore the middle line of the RSI will be painted green.
o When the Di- is above the DI + the trend is bearish therefore the middle line of the RSI will be painted green.
• A green background was added for the uptrend and red for the downtrend, which is activated exclusively when the price acquires a strong trend. This highly important feature for the interpretation of this new version of the indicator was absorbed from the ADX.
• A function was added that allows showing the weakness of the RSI by changing its color from green to red as the case may be.
• Thinking of the more traditional users, a function was incorporated that allows painting the RSI in a single color.
• A color selector was incorporated that allows painting the candles based on ADX or RSI.
• Added a side panel that indicates the numerical value of the ADX and the RSI.
• As a visual improvement, an upper and lower band was created that more clearly shows the oversold and overbought state of the oscillator.

Alpha ADX DI+/DI- V5 by MUNIF SHAIKHMODIFIED ADX DI+/DI- V5
Usage: To use this indicator for entry: when DMI+ crosses over DMI-, there is a bullish sentiment, however ADX also needs to be above 25 to be significant, otherwise the move is not necessarily sustainable.
Inversely, when DMI+ crosses under DMI- and ADX is above 25, then the sentiment is significantly bearish , but if ADX is below 20, the signal should be disregarded.
The line control represents, if the ADX is greater than the line of 25, the price trend is considered strong

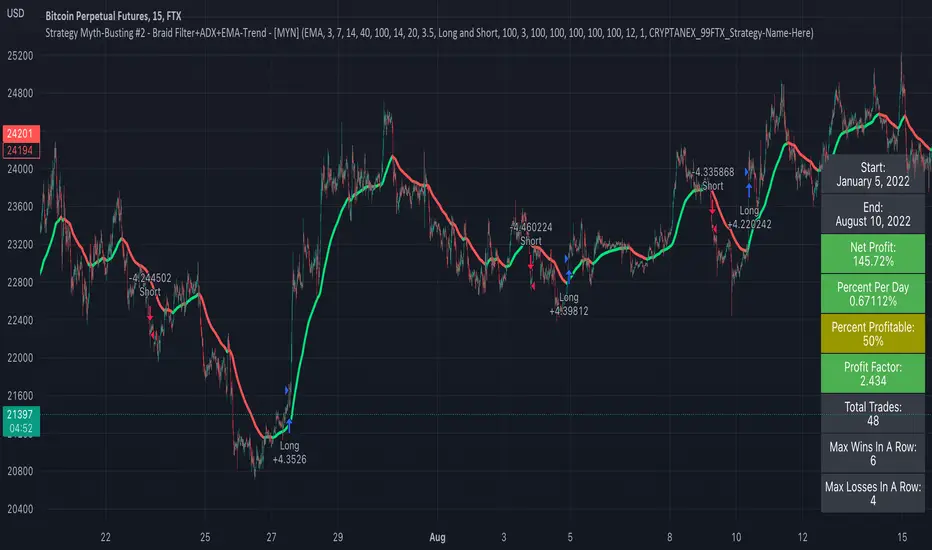
Strategy Myth-Busting #2 - Braid Filter+ADX+EMA-Trend - [MYN]This is part of a new series we are calling "Strategy Myth-Busting" where we take open public manual trading strategies and automate them. The goal is to not only validate the authenticity of the claims but to provide an automated version for traders who wish to trade autonomously.
Our second one we are automating is the " Braid Filter: The Indicator That Will Make You a Fortune ( Crazy Win Rate ! ) " strategy from " TradeIQ " who claims to have backtested this manually and achieved 453% profit with a 75% winrate over 100 trades in just a few months. I was unable to emulate these results accommodating for slippage and commission but this strategy does fair pretty well at least compared to the first one we automated.
If you know of or have a strategy you want to see myth-busted or just have an idea for one, please feel free to message me.
This strategy uses a combination of 3 open-source public indicators:
Braid Filter by Robert Hill
CM_EMA Trend Bars by Chris Moody
ADX and DI for V4 by Trend Bars by BeikabuOyaji
Trading Rules
15 min candles but other time-frames seem to work well too.
Long
1) Buy Price action above moving average. (bars are green)
2) Braid filter must issue a new green bar
3) ADX must be above the 20 level and be pointed up, If flat or downwards, don't enter trade (adjust ADX Slope to increase/decrease the incline of the slope)
4) Stop loss at the moving average or recent swing low.
Short
1) Buy Price action below moving average. (bars are red)
2) Braid filter must issue a new red bar
3) ADX must be above the 20 level and be pointed up, If flat or downwards, don't enter trade (adjust ADX Slope to increase/decrease the incline of the slope)
4) Stop loss at the moving average or recent swing high.
Target 1.5x the risk
Rising ADX strategyI have always been a huge fan of ADX. Its good for finding out good trending moves.
But it has been said that only ADX after 20 or 25 is good for trending market, but few trend gets completed at that level.
So I have come up with a logic to find out the rising ADX. This could be used to determine the trending moves from the start.
Buy signal:
When close is greater than moving average 1 and 2. This moving average can be SMA, EMA, WMA or HMA.
When ADX is greater than the threshold range. I have taken 10 as my minimum range.
Of course important of all ADX should be rising which implies trend is about to start.
Buy exit:
When close is less than moving average 1 and 2. This moving average can be SMA, EMA, WMA or HMA.
When ADX is lesser than the threshold range. I have taken 10 as my minimum range.
ADX falling which implies trend is about to end.
Sell signal:
I don't repeat the above logic again.
Everything similar to buy signal except above moving average. For selling it should be below moving average.
Strategy can be tested for long and short sides.
Note: No Repainting as the logic is very simple.
Using this script we can identify the best timeframe the script trend yields profit.
Test and provide your comments.

Full strategy Psar+ adx + cmf + rsi This ia full strategy made with a combination of a trender, volume, volatility and oscillator.
In this case we only go long.
Indicators used:
Default PSAR
Default CMF
Modified RSI logic, not using OB/OS
ADX with EMA applied
The rules are : we check if we are in a uptrend on psar, together with a positive value in volume, rsi is above the middle line(50), using a big length, and lastly the ADx is superior to the ema ADx
For exit, we check the opposite, like downtrend psar, negative value volume, rsi < 50, and adx < ema adx
If you have any questions let me know.

[PX] ADX BoxesHello guys,
today I would like to share an indicator that I had in my mind for quite some time. I call it ADX Boxes.
How does it work?
What the indicator does is very simple. Whenever the ADX falls below a certain threshold (which can be managed in the user input settings) a box will appear. The box will continue to grow as long as the ADX stays below the threshold. Once the ADX goes back above the threshold, the box will stop growing and will set its right border.
There are two modes, which can be used to determine the upper and lower border of the box. The first one is called "Extremes", which plots the borders the highest high and lowest low for the range below the threshold. The second one is called "Avg. High/Low", which plots the borders at the average high and average low within the range.
Furthermore, the indicator contains an option to show the average value of the detected range below the ADX threshold.
Just like all my other indicator scripts, this one comes with different styling options for boxes in progress, settled boxes and the average value.
Hopefully, some of you find it useful.
Make sure you leave a follow and a like :)
Happy trading!!

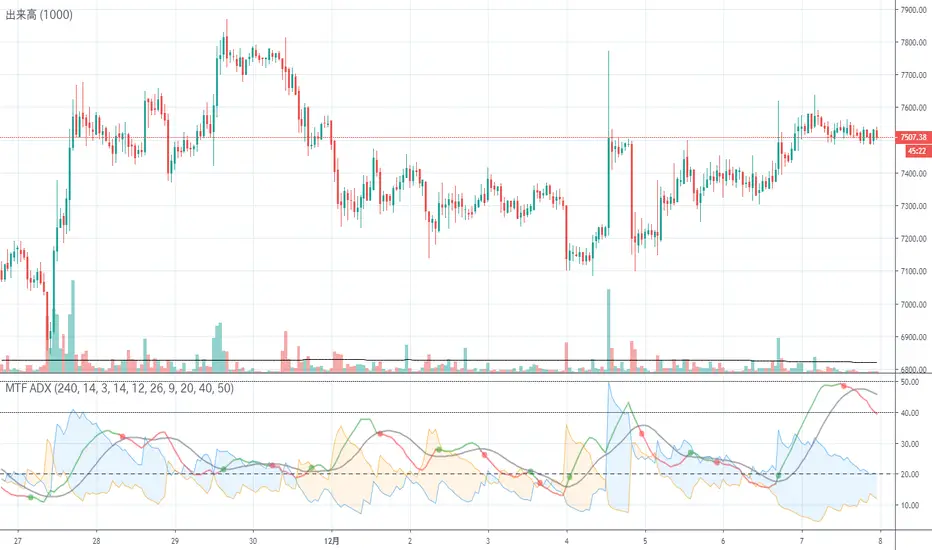
MTF ADXI tried to convert ADX to MTF. The trend strength can be judged with ADX.
It can be judged that a trend below 20 is a weak trend, a trend above 40 is a strong trend, and a trend above 50 is a very strong trend.
As for the color of ADX, the green part is rising and the red part is falling.
It is assumed that you will make a position at the moment when it turns green or when it exceeds 20.
Entry points correspond to alerts.
The direction of the trend is judged by DI +, DI-, the part painted in blue is the uptrend and the part painted in orange is the downtrend.
ADXをMTF化してみました。ADXでトレンドの強さが判定できます。
20以下は弱いトレンド、40以上は強いトレンド、50以上は非常に強いトレンドと判定できます。
ADXの色は緑の部分が上昇中、赤色の部分が下降中です。
緑に変わった瞬間、または20を超えた瞬間ポジションメイクするのを想定しています。
エントリーポイントはアラートに対応しています。
トレンドの向きはDI+,DI-で判定し、青色に塗っている部分は上昇トレンド、オレンジ色に塗っている部分は下落トレンドです。
Heracles Original Wilder's ADX and DI +/- by ZekisOriginal Wilder's ADX and DI +/- (calculated with the 1978's original formula from Wilder's MA and not with the simple moving average, like almost all ADXs)
I changed the aspect for a nice and easy view
Black/yellow dashed line - threshold
Light blue line = ADX
Blue background - ADX above threshold
Yellow background - ADX bellow threshold
Green line - DI +
Red line - DI -
Green DI+/- background and green triangles - uptrend
Red DI +/- background and red triangles - downtrend
Candlesticks are colored according to the pattern
Possibility to enable or disable trend filter (threshold)
Alerts are added for entries and exits or longs or shorts
Green triangle - long/enter
Red triangle - short/exit
Yellow contaminated area - no certain trend
Green candles - uptrend
Red candles - downtrend
Yellow candles - no certain trend
Enjoy!
@ Zekis

checkm8's ADX & DMI v2 with MTF Godmode CrossoversHello & welcome to my updated version of the ADX & DMI indicator.
The average directional index and directional moving indices are a godsend and I think you should incorporate it into your trading.
Here's a quick how-to:
A detailed guide is available in my first version:
Additional edits:
My indicator paints the background of the indicator green when +DMI is above -DMI and red when -DMI is above +DMI. In addition to this, the background will paint darker green when the RSI on the timeframe exceeds 70 and even darker when the RSI exceeds 80, in a +DMI dominance. The background will paint darker red when the RSI on the timeframe falls below 30 and even darker when the RSI falls below 20, in a -DMI dominance.
The indicator also displays multi-timeframe (MTF) crossovers on Godmode MACDs, plotted on the ADX line. If the dots are teal, it means that the shorter-term MA crossed above the longer-term MA (bullish), and if it is fuchsia, the shorter-term MA crossed below the longer-term MA (bearish).
Additional notes:
Additional edits:
1) Speculating on DMI crossovers is dangerous, especially on larger timeframes. Be careful when doing so if you are not familiar with the calculations behind the DMIs and if you are not familiar with how movements on lower timeframes translate to larger timeframes.
Additional resources to learn about ADX & DMI:
1) seekingalpha.com
2) stockcharts.com
Special thanks:
-xSilas, for the development of the Godmode calculations used in my indicator
-dent77x, for being a thinkpool and emotional support
-kristarling, for help with the coding

RSI + ADX + MACDINDICADOR COMBINADO DE RSI + ADX
Aprovecha las ventajas de cada indicador en uno solo.
Teniendo en un solo indicador el momentum de cada tendencia y la fuerza relativa con sus puntos de sobre compra y sobre venta.
También al poder analizar divergencias en el indicador oscilador RSI y poder crear estrategias de entrada con el ADX
-------------------------------------------------------------------------------------------------------------------------------------------------------------------------------
RSI + ADX COMBINED INDICATOR
Take advantage of each indicator in one.
Having in a single indicator the momentum of each trend and the relative strength with its points of overbought and oversold.
Also by being able to analyze divergences in the RSI oscillator indicator and being able to create entry strategies with the ADX
DERECHOS DEL CREADOR PARA: Dvd_trading
Trend Surfers - Momentum + ADX + EMAThis script mixes the Lazybear Momentum indicator, ADX indicator, and EMA.
Histogram meaning:
Green = The momentum is growing and the ADX is growing or above your set value
Red = The momentum is growing on the downside and the ADX is growing or above your set value
Orange = The market doesn't have enough momentum or the ADX is not growing or above your value (no trend)
Background meaning:
Blue = The price is above the EMA
Purple = The price is under the EMA
Cross color on 0 line:
Dark = The market might be sideway still
Light = The market is in a bigger move

Multi-timeframe Squeeze Mom + ADX and DIsMulti-timeframe Squeeze and ADX
This indicator is designed to be able to get used in combination with others that can lead to a potential help for trading.
The indicator uses colors such us light green, dark green, light red and dark red. Light green and light red to indicate the second half and strongest movement of an upwards and downwards movement, respectively. The same for the first half of an upwards or downwards movement, dark red for the possible start of the upwards movement and dark green ad possible start of the downwards movement.
The indicator is multi-timeframe because the trader can configure within the menu a background timeframe, which plots a squeeze momentum for a different timeframe than the one selected for the main graph. It plots the background timeframe with an area style, while the main squeeze is plotted with a column style. This helps the traders to analyze whether entering a position countering a higher timeframe upwards or downwards squeeze momentum.
It also shows the divergences that occur between the price and the squeeze momentum that can add strength to a potential movement upwards or downwards.
The ADX, DI+ and DI- lines are also added to determine the potential strength of the movement in the monitor (squeeze momentum). If the DI+ is over the DI-, then the strength is likely higher upwards and the opposite for the downwards strength.
Fundamentals
Squeeze momentum: It shows the periods when volatility increases or decreases, in other words, when the market goes from the trend into flat movement and vice versa.
ADX (Average Directional Index): The ADX helps the indicator to estimate the strength of the movement, always considering the DI+ and DI- to not go against the trend strength.
Positive (DI+) and Negative DI (DI-): Both DI+ and DI- measure up and down price movement, in some cases crossovers of these lines can be used as trade signals.
Divergences: Divergence occur when the price of an asset is moving in the opposite direction of a technical indicator, such as an oscillator (squeeze momentum). Divergence warns that the current price trend may be weakening, and in some cases may lead to the price changing direction.
Panel
This panel allows the trader to have a summary of the values of the direction and strength of the movement. It has the following characteristics:
It is placed on the right middle side of the chart indicator by the default.
Its colors changes according to the indicator’s values.
The summary box shows the projection for the main squeeze plot and also for the background squeeze plot. If only one is needed, it can be changed on the menu of the indicator.
Summary
From all previously mentioned, it can be stated that the indicator allows users to:
Detect the direction of trends
Detect price and squeeze divergences
Get a table summarizing important values of the indicator to determine the strength of a trend.

ADX and DI LevelsADX:
ADX is used to quantify trend strength. ADX calculations are based on a moving average of price range expansion over a given period of time. The default setting is 14 bars, although other time periods can be used.1
ADX can be used on any trading vehicle such as stocks, mutual funds, exchange-traded funds and futures.
DI (+/-):
The directional movement index (DMI) is an indicator developed by J. Welles Wilder in 1978 that identifies in which direction the price of an asset is moving. The indicator does this by comparing prior highs and lows and drawing two lines: a positive directional movement line (+DI) and a negative directional movement line (-DI). An optional third line, called the average directional index (ADX), can also be used to gauge the strength of the uptrend or downtrend.
This indicator has the length changed from 14 to 9 so you can have more updated price calculation
I also add the 4 levels I use for day trading; the 10, 20, 30, 40-50 are the levels I like to see the Di to break over.
A lot of traders use different levels, but these I have and found most useful. You can set alerts when any Di crosses over the 40 for true trend breakout!

ADX and DI EMA Trend LineADX: The average directional index (ADX) is a technical analysis indicator used by some traders to determine the strength of a trend.
DI: The directional movement index (DMI) is an indicator developed by J. Welles Wilder in 1978 that identifies in which direction the price of an asset is moving. ... Conversely, if -DI is above +DI, then there is more downward pressure on the price. This indicator may help traders assess the trend direction.
EMA: The exponential moving average (EMA) is a technical chart indicator that tracks the price of an investment (like a stock or commodity) over time. The EMA is a type of weighted moving average (WMA) that gives more weighting or importance to recent price data.
UPDATE: This current indicator has been changed from MA and EMA trend lines the 9 and the 50, and also added Inside & Outside bars...You can toggle anything Off or On
The code in this indicator calculates the value of each ADX and DI (+/-) value to give a green color for DI + trend and a red color for DI - trend, and lastly white for no direction...The nice part of this code is the 50 EMA will be your bull or bear transition level. The colors heading to the ema will tell you if we are still bull or bear heading to the EMA.
I also changed the ADX to become the 9 EMA with Yellow showing a ADX positive rate of change, Blue showing a negative rate of change, and white to show that the trend has no direction.
Open settings to adjust how big or small you want the ema lines to be and adjust colors for what works for you. Hopefully you enjoy this update
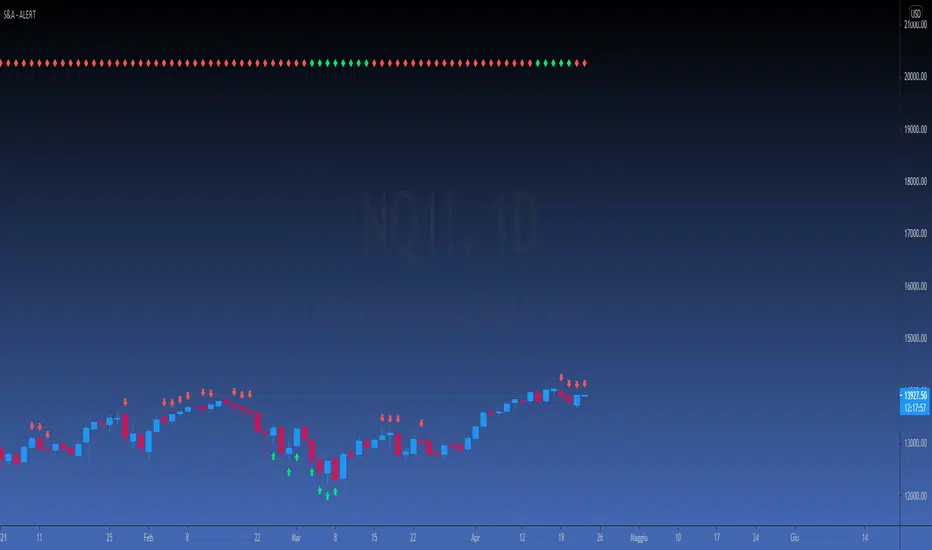
[FP] STOCH & ADX EASY ALERTENG DESCRIPTION
This script is a simple request from user, that want to have an allert when ADX and Stochastic has certain contidion.
Also this indicator show when ADX is > or < than 40 when with red and green diamonds on top.
It's used to validate a weakly setup to trade FUTURES.
DESCRIZIONE IN ITALIANO
Questo script è una semplice richiesta da parte di un utente, il quale richiedeva un alert quando lo Stocastico e l'ADX raggiungono determinate condizioni.
Inoltre l'indicatore mostra quando l'ADX è maggiore o minore di 40 plottando dei diamanti in alto sul grafico.