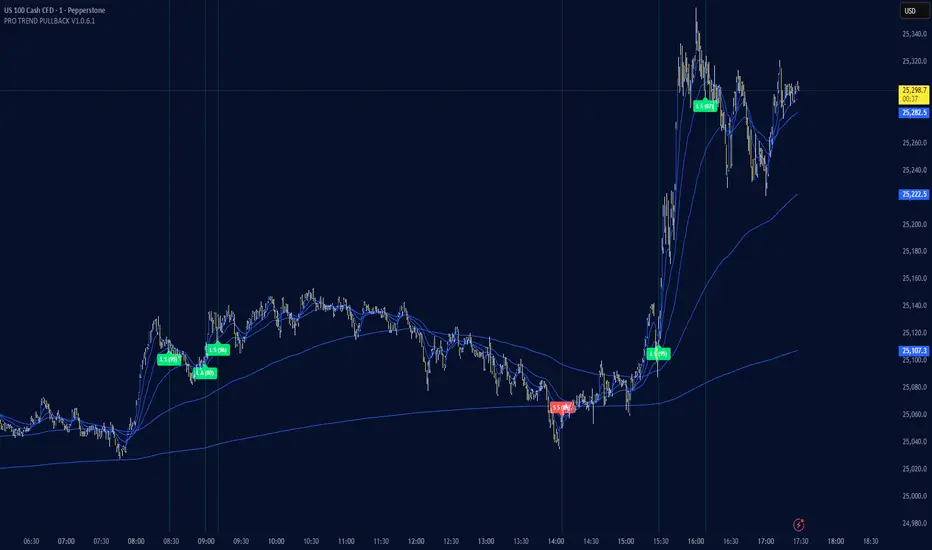
PRO TREND PULLBACK
PRO TREND PULLBACK – trend-following pullback strategy (NAS100 / US30 focus, 1m)
What is this?
- EMA-based trend + pullback entry logic, with optional VWAP and EMA-order filters.
- Built-in preset system for NAS100/US30 on the 1-minute timeframe (Safe / Balanced / Turbo), plus a fully manual “Custom” mode.
Core logic (quick overview)
1) Trend filter:
- Above EMA TREND: long bias, below: short bias
- Optional: VWAP filter, EMA order filter, HTF EMA TREND filter, Multi-EMA direction filter
2) Pullback trigger:
- Pullback level selectable: FAST / MID / SLOW EMA
- Long: touch + bullish confirmation, Short: touch + bearish confirmation (toggleable)
3) Quality filters:
- RSI zone filter (separate for long/short)
- Candle filters: doji / oversized candle / wick (pin-zone) / low-volatility block
- ADX trend-strength filter (via ta.dmi), entry cooldown (bar-based)
- Sideways/range handling: Filter / Penalty / Edge-only mode (ADX + slope + “chop” cross counter)
Risk management / trade management (backtest & automation)
- ATR-based SL/TP: SL, TP1, TP2 (TP1 partial close optional)
- Break-even trigger based on ATR (optional)
- “Max bars in trade” time-based exit (optional)
- Volatility-regime scaling: dynamic SL/TP scaling in high-volatility regimes (optional)
Signal grading (Grade / Score)
- Radar-style scoring + grade: S / A / B / C
- Structural penalties (e.g., lower low / higher high, EMA50 touch, proximity to swing high)
- Trend “fatigue” penalty (down-weights repeated same-direction signals)
- Optional “Lux SMC-lite” score layer (BOS/CHoCH + OB + EQH/EQL + Premium/Discount)
- Optional “ABC-lite (Elliott A-B-C)” score layer (pivot-based)
Alerts / Robot JSON (for webhook)
- Built-in JSON alerts via alert() with watchlist-friendly fields:
secret, strategy, signal, signal_type, symbol, timeframe, time (UTC), price, + optional grade/score
- TradingView alert setup: Condition = “Any alert() function call”
(Webhook URL + your own secret is recommended)
Important notes
- This is a STRATEGY (strategy) intended for backtesting and signal logic. Before live use, test thoroughly and account for slippage/spread differences.
- Pivot-based components (SMC-lite / ABC-lite) are naturally confirmation-based (delayed), so “structure/ABC” values do not print instantly.
- Not financial advice. Use at your own risk.
Suggested starting setup
- Presets: Auto + Balanced (NAS100/US30 1m), then fine-tune with Safe/Turbo.
- For robot mode: turn useRobotAlert=ON and change payloadSecret to a unique value.
In den Scripts nach "adx" suchen
Powell's Brain Mk.4.4 [Scalper Edition]Title: Powell's Brain Mk.4.4
Description
Powell's Brain is a mechanical scalping system designed for volatile assets (like SPY, QQQ, NVDA, and TSLA) on 1-minute and 5-minute timeframes.
Unlike standard indicators that spam signals at every crossover, this script uses a "Subtractive" Philosophy. It starts with a trend crossover signal and then runs it through a squad of 6 distinct filters. If any filter detects low probability (chop, low volume, weak momentum), the trade is blocked.
This is the Scalper Edition, tuned to catch V-Shape reversals while still protecting capital during sideways chop.
🧠 How It Works
The system relies on the confluence of four market forces: Momentum, Energy, Trend Strength, and AI Confirmation.
1. The Core Strategy (The Engine)
Dual EMA Crossover: Uses a Fast (9) and Slow (50) EMA to identify immediate trend changes.
Slope Detection: A trade is only considered if the EMAs are separating with sufficient velocity (0.04% slope threshold). This prevents trading when lines are flat/tangled.
2. The "No" Squad (Filters)
A signal is rejected unless it passes these checks:
Volume Gate: Volume must be at least 80% (0.8x) of the 20-period average. This filters out pre-market noise or lunch-hour apathy.
ADX Shield: The Average Directional Index must be > 20. If ADX is lower, the market is chopping, and the script forces you to sit on your hands.
Time-of-Day: By default, it targets "Prime Hours" (09:30–11:00 & 14:00–16:00 EST) to avoid the "lunchtime trap."
Cooldown: Enforces a 3-bar wait period between signals to prevent signal flickering in high-volatility zones.
3. The AI Engine (k-NN Machine Learning)
Included is a k-Nearest Neighbors (k-NN) implementation that analyzes historical RSI and Relative Volume patterns.
It compares the current market state to the last ~1,000 bars.
It calculates a "Confidence %" based on how often similar past setups resulted in a bullish or bearish move.
AI Gating: You can enable a "Strict Mode" in settings where the script will block any trade that the AI does not agree with (Confidence < 55%).
4. The Squeeze Filter (TTM Logic)
An optional filter allows you to trade only on volatility expansion (Bollinger Bands exiting Keltner Channels). This is disabled by default to allow for standard trend scalping but can be enabled for breakout hunting.
🚦 How to Use
The Signals:
Green "CALL" Label: Bullish Momentum + Volume + Trend Strength.
Red "PUT" Label: Bearish Momentum + Volume + Breakdown.
The HUD (Heads-Up Display):
Monitor the top-right panel for Market Flow, Squeeze Status, and AI Confidence.
If the AI text is Orange ("INITIALIZING"), wait for more data to load.
The Debugger:
If you see a crossover but NO signal, turn on "Show Debug Labels" in settings.
The chart will print exactly why the trade was skipped (e.g., Vol❌ means volume was too low, Slope❌ means the trend was too flat).
⚙️ Settings Guide
Strategy Core: Adjust Min EMA Separation to tune sensitivity. Higher = Fewer, safer trades. Lower = Faster entries.
Filters:
Trade with 200 EMA Trend: Keep OFF for scalping reversals. Turn ON for strict trend following.
Gate Entries with AI: Turn ON if you want the Machine Learning engine to veto low-confidence setups.
Visuals: Toggle Dark/Light themes to match your chart.
Disclaimer
This script is a tool for identifying high-probability setups based on historical data and technical analysis. It does not guarantee future performance. Always use proper risk management (Stop Losses are included in the logic visuals). In less words DON'T BE AN IDIOT.
By FallenAngel666

Crypto Intraday Scalper [Patterns + RSI + Volume + MTF + ADX]# Guide to Reading the Indicator (CIS Pro v2)
## 1. Operational Signals (The Labels)
- **GREEN Label "BUY"**:
**Meaning**: Entry for a Long position.
**Conditions**: Bullish candle pattern + Oversold RSI + High Volume + Bullish 1-hour trend + Sufficient Volatility.
- **RED Label "SELL"**:
**Meaning**: Entry for a Short position.
**Conditions**: Bearish candle pattern + Overbought RSI + High Volume + Bearish 1-hour trend + Sufficient Volatility.
- **No Label**: The market is in an uncertain phase, sideways movement, or filters (ADX/MTF) are blocking signals for protection.
## 2. Trend Lines (The Context)
- **Gray Line (EMA 200)**: This serves as the dividing line between bullish and bearish trends.
**Rule**: Seek Long positions only above the gray line; Short positions only below it.
- **Red/Green Step Line (Supertrend / Trailing Stop)**:
**Green (below the price)**: Strong bullish trend. Acts as dynamic support.
**Red (above the price)**: Strong bearish trend. Acts as dynamic resistance.
**Usage**: Use it for trade exits. If in a Long position and the line turns red, close the entire trade.
## 3. Price Levels (Targets and Supports)
- **Blue/Red/Green Dots (Pivot Points)**:
These are levels calculated from the previous day. The price tends to bounce at these points. Use them as final targets for taking profit.
- **Orange Line (VWAP)**:
This represents the "average price" for the day. If the price deviates too far, it often returns (elastic effect).
- **Dashed Lines (Appear after a signal)**:
**Red Dashed**: Suggested Stop Loss (based on ATR volatility).
**Green Dashed**: Suggested Take Profit (quick target).
## 4. The Table (Dashboard in the Top Right)
This provides reasons why you may not be receiving signals:
- **Trend (Current)**: The trend on your current chart.
- **Trend (MTF 60)**: The trend on the 1-hour chart. If these two conflict (e.g., Bullish vs. Bearish), no signals will appear.
- **ADX Volatility**: If RED (below 20), the market is flat—no trades. If GREEN, there is sufficient movement.
- **Volume Status**: Alerts if anomalous high volume is entering (High) or if conditions are calm.
## 🚀 Operational Summary
- Wait for the label.
- Quick Check: Is the price on the correct side of the gray line? Is the step line the right color?
- Enter the trade.
- Exit when the price hits the green dashed line (Quick Take Profit) **OR** when the price breaks the step line (Trailing Stop for longer trends).
What aspect of this indicator should we analyze next—perhaps integrating it with real-time ETH data or testing it via code execution for backtesting?

Triple Screen System [FlexibleMAs MACD-RSI-ADX]#### Triple Screen System (TSS-FMR)
The TSS-FMR script is a specialized, multi-timeframe confirmation tool built for Swing, Positional Traders, and Longer Term Investors. It is engineered to filter out low-conviction noise by implementing an advanced interpretation of the Elder's Triple Screen strategy, relying on proprietary momentum, volatility, and volume analysis to isolate high-probability setups.
---
#### 🧠 Core Methodology & Logic
The TSS-FMR synthesizes three distinct layers of confirmation to generate signals:
1. Macro Trend & Volatility: Determines the primary trend and overall market condition using configurable EMA+RSI metrics , the script uses Average Directional Index (ADX) as an internal component to filter out non-trending, consolidating market conditions.
2. Momentum Synchronization: A proprietary filter requiring MACD,MAs and RSI to be synchronized * within a specified bar window (`MACD/RSI Sync Window`) ensures that entries align with current short-term momentum shifts.
3. Volume & Price Action: Final entry is triggered only when the higher timeframes align and the entry timeframe (Daily or 4H) confirms the move, optionally requiring * Candle Confirmation * and filtering out low-quality trades using the * Volume Filter *
The key is the separation of input thresholds and lengths for Weekly and Daily lookbacks, allowing for precise tuning unavailable in standard public libraries.
---
#### 🎯 Understanding Signal Strength & Conviction
Signals are categorized using a proprietary Strength scale (from Overbought/Oversold to 6) to help traders gauge the potential size and probability of the momentum move, This scale is dynamically influenced by the ADX volatility readings.
#### 🔍 Integrating External Visual Tools (Addressing Rule: Vendor/Chart)
The TSS-FMR generates signals based solely on its internal logic and inputs .*
We recommend overlaying the TSS-FMR signals with external tools (such as the Lux Algo SmartMoneyConcepts indicator or similar public S/R tools) for visual confirmation only :
* Signals (2, 3, 4) + CHOCH/BOS: * A signal with lower internal strength (2-4) gains stronger conviction if it aligns precisely with a CHOCH or BOS event visually identified by the external tool. This confirms that the market structure is validating the script's momentum reading.
Zone Confirmation: When signals land precisely within visually defined Liquidity or Accumulation/Distribution Zones (provided by external visual tools), it adds significant conviction to the TSS-FMR's output.
The *Overbought/Oversold regions* are decided based on the script's internal strength calculation and prevailing price action.
#### Summary:
--- This script is for Swing, Positional Traders and Longer Term Investors
--- It will only work with Monthly,Weekly, Daily and 4H chart to help you make confirmation based positions.
--- Sell Signals are Overbought Exits and Short sell signals, Plan according to Weekly Signals and Daily signals
--- Use the Momentum Table/matrix at the right top of the chart when TSS indicator is active.
--- Use Volume Filter enable to remove chaos of signals
--- Keep *Lux Algo -SmartMoneyConcepts* indicator active for visual of zones
--- Adjust Volume Filter in Settings to avoid crowding of signals
--- Adjust Input signal length to select number of history bars
--- Watch-out for Weekly 100ema Line and
--- Watch-out for Sell Signals, in discount region they are marked as Buy oversold or moderate, vise versa Sell Overbought signals are added to the charts.
--- To earn money, we need to look out for early signals, fake breakouts, breakdowns and what we want the table/matrix turning all green or red in Momentum trades.
---
#### House Rule Compliance Statement
This script description is provided strictly for technical clarity. It is free from all promotional content, external links, contact information, social media references, and solicitations, as per TradingView's General House Rule #2. The justification for its closed-source nature is based on its proprietary signal synchronization logic and flexible, multi-timeframe implementation.

RSI + ADX + ATR Strength GaugeThis indicator combines Relative Strength Index (RSI), Average Directional Index (ADX), and Average True Range (ATR) into a unified strength gauge that identifies high-quality trending conditions while filtering out choppy, low-volatility markets.
RSI measures momentum and overbought/oversold conditions.
ADX confirms trend strength (not direction), highlighting when price movement has strong follow-through.
ATR captures volatility expansion, filtering out flat, low-range candles where fake signals occur.
When the components diverge or show contraction, the gauge warns of market chop, suggesting it’s better to avoid entries or reduce position size.
Purpose:
To keep you out of sideways markets and confirm entries only when momentum, trend strength, and volatility all agree — reducing whipsaws and improving trade quality.
Tweak to your liking.

3 Lines RCI + Psy + ADX Title: 3 Lines RCI + Psy + ADX (Integrated)
Description:
An all-in-one indicator combining RCI (short, mid, long), Psychological Line (Psy), and ADX.
RCI: Shows overbought/oversold zones and trend potential.
Psy: Measures market sentiment with adjustable thresholds.
ADX: Indicates trend strength with color-coded levels.
Use it to identify reversals, confirm trend strength, and improve entry/exit timing. Fully customizable for different trading styles.

Adaptive Weighted Oscillator (Manual ADX + Gradient)📘 Adaptive Weighted Oscillator (Manual ADX + Gradient)
This oscillator dynamically blends multiple market dimensions—trend, momentum, volume, and volatility—into a single composite curve. Each component is normalized and smoothed, then weighted adaptively based on current market conditions using a manually calculated ADX.
🔧 Key Features:
• Manual ADX Calculation: Uses raw price movement to compute directional strength, enabling precise trend detection.
• Adaptive Weighting Logic:
• Strong trend → higher weight to trend curve.
• Choppy market → momentum takes priority.
• High volume or volatility → respective curves gain influence.
• Composite Output: A unified oscillator line colored via gradient (green/red/gray) to reflect bullish/bearish/neutral zones.
• Zero Line Reference: Helps identify directional bias and potential reversals.
• Visual Fill: Area between composite and zero line is shaded for clarity.
🧠 Use Cases:
• Spotting early shifts in market regime (trend vs. chop).
• Confirming entries with multi-factor agreement.
• Filtering noise by relying on adaptive logic rather than static thresholds.

RK RSI Stochastic ADX Ver1.0Version 1.0
Instead of viewing RSI, Stochastic and ADX on different panel; I bought them together in one panel.
Included price divergence of RSI and Stochastic in the chart.
ADX can be viewed as line chart and/or as an option to color grade the background instead of too many line drawn on the chart.
Composite PR Signal (Trend↔Revert + ADX gate)Core Components
1. Dynamic Inputs
Max/PR windows (maxLen, prWin) – define historical lookbacks for oscillators and percentile ranks.
Smoothing (smooth) – applies an EMA filter to stabilize composite scores.
Threshold (th) – governs entry sensitivity.
Holding period (hBars) – maximum bars allowed in a trade.
Execution options – allow shorting, fast approximations for PR and CCI.
2. Custom Utility Functions
The script implements optimized versions of common TA operations:
Rolling sums, delays, and moving averages (EMA, RMA, SMA).
Lazy rolling extrema (efficient highest/lowest lookups).
Stateful arrays for tracking oscillator values across bars.
Fast approximations for percentile ranks and indicators.
3. Indicators Used
The system calculates a broad set of oscillators, including:
Trend/Momentum: ROC, TRIX, TSI, MACD histogram, OBV ROC, AO, CMF, BOP, UO, ADX.
Reversion/Oscillators: RSI, Stochastic K/D, MFI, Williams %R, CCI, CMO.
Each is converted into a percentile rank (PR) to normalize values between 0–100.
4. Composite Scoring
Two composite signals are built:
Trend Score – averages normalized outputs of momentum indicators.
Reversion Score – averages normalized outputs of oscillators prone to mean reversion.
ADX Gate – when ADX PR is high, the strategy favors trend score; when low, it favors reversion score.
Final score is smoothed and compared against entry thresholds.
5. Trade Logic
Entry:
Long: When composite score crosses above +th.
Short: When composite score crosses below -th (if enabled).
Exit:
Opposite crossover signal.
Or trade duration exceeds hBars.
6. Risk/Execution Parameters
Initial capital: 100,000
Commission: 0.01% per trade
Fixed order size: 100 units
No pyramiding
Intended Use
This script is designed for:
Swing trading across multiple assets (equities, forex, crypto).
Adapting to market regimes — capturing breakouts during strong trends, but fading moves when markets are choppy.
Info Panel (RSI, ADX, Volume,EMA, Delta)📊 Info Panel PRO — All-in-One Trader Dashboard
Simplify market analysis at a glance.
This powerful indicator displays key market metrics in a compact, customizable table directly overlaid on your chart — ideal for day trading, scalping, and swing trading strategies.
🔍 What’s Included:
✅ RSI (Relative Strength Index) — Measures overbought/oversold conditions.
✅ ADX (Average Directional Index) — Gauges trend strength (>25 = strong trend).
✅ Price vs 200 EMA on 4H timeframe — Strategic support/resistance level for multi-timeframe context.
✅ Current Bar Volume — Color-coded to reflect bullish/bearish sentiment.
✅ Volume Delta — Net buying/selling pressure on your chosen timeframe (default: 1 minute).
✅ CVD (Cumulative Volume Delta) — Daily running total of delta, resets each new trading day.
⚙️ Fully Customizable Settings:
Adjustable lengths for RSI, ADX, and EMA.
Select delta calculation timeframe — lower = more granular (e.g., “1” for 1-minute precision).
Table position: top/bottom left/right corners.
Color themes: Customize bullish, bearish, and neutral colors to match your style.
💡 Who Is This For?
Scalpers & Day Traders needing real-time market context without clutter.
Swing & Position Traders monitoring higher-timeframe structure and momentum.
Order Flow & Volume Analysts tracking buyer/seller imbalance via delta and CVD.
Beginners learning to read markets through consolidated, intuitive indicators.
🎯 Key Benefits:
✅ Clean, minimalist UI — stays out of your way while delivering critical data.
✅ Auto-formatting for large numbers (K, M, B) — easy readability.
✅ Visual cues (arrows, color coding) for instant decision-making.
✅ Works across all markets: Forex, Stocks, Crypto, Futures.
📌 How to Use:
Add the indicator to your chart.
Tweak settings to fit your trading style.
Monitor real-time updates — all essential metrics visible in one place.
Combine with other strategies (price action, S/R, VWAP) for signal confirmation.
📌 Pro Tip: For maximum edge, pair Info Panel PRO with liquidity zones, VWAP, or Market Profile tools.
📈 Trade smarter — let the market speak to you in clear, actionable terms.
Author:
Version: 1.0
Language: Pine Script v5
Overlay: Yes (draws directly on price chart)
😄
“If this indicator were a person, they’d be called ‘The One Who Knows Everything… But Never Gives Unsolicited Advice.’
…Unlike your ‘friend’ who yells ‘BUY!’ five minutes before the market crashes.”
“A good trader isn’t the one who predicts the market.
It’s the one who has everything on their chart — coffee optional.
…Want the next indicator? Comment ‘YES’ below — and I’ll build you ‘Smart Alert PRO’ or ‘Volume Sniper’ next.”
P.S. If this script saves even ONE trade — hit 👍.
If it saves TWO — comment “THANK YOU” 🙏
If it saves THREE — expect “Volume Heatmap PRO” next week 😉🔥

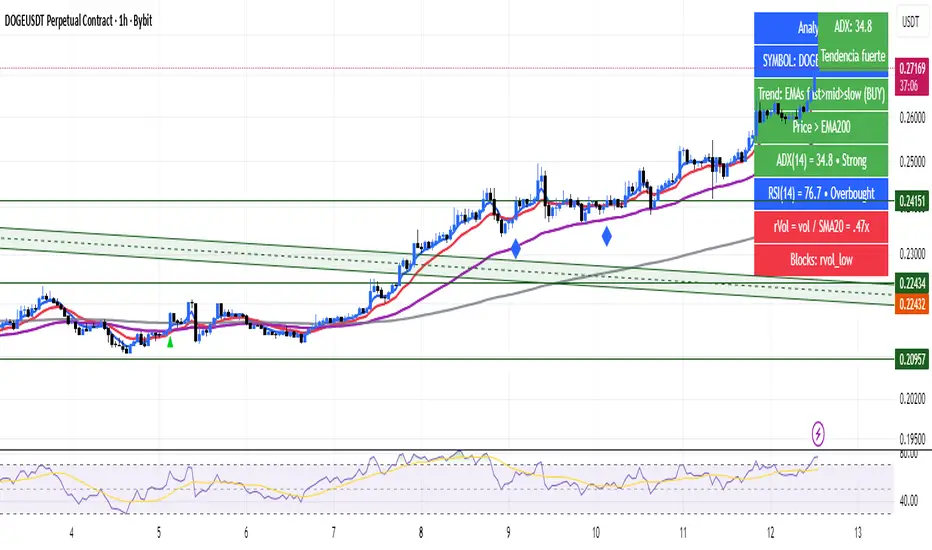
Analyst HUD — Side / ADX / RSI / rVol (bot thresholds)Analyst HUD — Side / ADX / RSI / rVol (bot thresholds)
A clean heads-up display that puts the essentials right on your chart:
✅ Side – quick trend bias (bullish/bearish)
✅ ADX – trend strength, color-coded
✅ RSI – momentum zones (overbought/oversold/neutral)
✅ rVol – relative volume vs average
Built with bot-style thresholds for instant clarity.
No signals, no clutter — just the key metrics you need to spot strong trends and momentum at a glance.
DNSE VN301!, ADX Momentum StrategyDiscover the tailored Pine Script for trading VN30F1M Futures Contracts intraday.
This strategy applies the Statistical Method (IQR) to break down the components of the ADX, calculating the threshold of "normal" momentum fluctuations in price to identify potential breakouts for entry and exit signals. The script automatically closes all positions by 14:30 to avoid overnight holdings.
www.tradingview.com
Settings & Backtest Results:
- Chart: 30-minute timeframe
- Initial capital: VND 100 million
- Position size: 4 contracts per trade (includes trading fees, excludes tax)
- Backtest period: Sep-2021 to Sep-2025
- Return: over 270% (with 5 ticks slippage)
- Trades executed: 1,000+
- Win rate: ~40%
- Profit factor: 1.2
Default Script Settings:
Calculates the acceleration of changes in the +DI and -DI components of the ADX, using IQR to define "normal" momentum fluctuations (adjustable via Lookback period).
Calculates the difference between each bar’s Open and Close prices, using IQR to define "normal" gaps (adjustable via Lookback period).
Entry & Exit Conditions:
Entry Long: Change in +DI or -DI > Avg IQR Value AND Close Price > Previous Close
Exit Long: (all 4 conditions must be met)
- Change in +DI or -DI > Avg IQR Value
- RSI < Previous RSI
- Close–Open Gap > Avg IQR Gap
- Close Price < Previous Close
Entry Short: Change in +DI or -DI > Avg IQR Value AND Close Price < Previous Close
Exit Short: (all 4 conditions must be met)
- Change in +DI or -DI > Avg IQR Value
- RSI > Previous RSI
- Close–Open Gap > Avg IQR Gap
- Close Price > Previous Close
Disclaimers:
Trading futures contracts carries a high degree of risk, and price movements can be highly volatile. This script is intended as a reference tool only. It should be used by individuals who fully understand futures trading, have assessed their own risk tolerance, and are knowledgeable about the strategy’s logic.
All investment decisions are the sole responsibility of the user. DNSE bears no liability for any potential losses incurred from applying this strategy in real trading. Past performance does not guarantee future results. Please contact us directly if you have specific questions about this script.

Fear & Greed Oscillator — LEAP Puts (v6, manual DMI/ADX)Fear & Greed Oscillator — LEAP Puts (v6, manual DMI/ADX) is a Puts-focused mirror of the Calls version, built to flag top risk and momentum rollovers for timing LEAP Put entries. It outputs a smoothed composite from −100 to +100 using slower MACD, manual DMI/ADX (Wilder), RSI and Stoch RSI extremes, OBV distribution vs. accumulation, and volume spike & direction, with optional Put/Call Ratio and IV Rank inputs. All thresholds, weights, and smoothing match the Calls script for 1:1 customization, and a component table shows what’s driving the score. Reading is simple: higher values = rising top-risk (red shading above “Top-Risk”); lower values = deep dip / bounce risk (green shading). Built-in alerts cover Top-Risk, Deep Dip, and zero-line crosses for clear, actionable cues.
Jitendra: MTF AIO Technical Indicators with Trend ▲▼Jitendra: MTF AIO Technical Indicators with Trend ▲▼
Why We Designed this Indicator
we build this indicator to Analysis Multi-timeframe Technical Data in dashboard to get Better and Quick Data in which Time Frame where it is in Momentum or in Swing,
By combining multiple technical indicators with trend direction arrows and displaying them in a customizable table.
It also optionally plots some indicators EMA, VWAP, Supertrend, Bollinger Bands on the chart.
Traders who want a compact technical summary across multiple timeframes without switching charts.
Quickly assess trend strength, momentum, divergence, volume pressure in one glance.
Combine with price action to make higher-confidence entries/exits.
How to Use This Indicator
In setting there are Two parts
First Part - for Plot Multi EMA, Bollinger Band, Supertrend 10,2 & 10, 3 factorial
Second Part- To get Data on Table for Quick Analysis
Chart Plots With Enable Disable Toggle in Setting
VWAP (optional)
4 EMAs (lengths configurable)
Bollinger Bands (optional)
Two separate Supertrend indicators with custom ATR period and multiplier
Indicators Data in Table
For each selected timeframe:
VWAP position (price above/below)
MACD value + trend arrow
MACD Histogram (optional)
RSI value + arrow (rising/falling)
ADX value + arrow (strength rising/falling)
+DI / -DI values + trend arrows
RSI Divergence detection (regular + hidden)
EMA levels (up/down relative to price)
EMA crossover (EMA1 vs EMA2 arrow)
Stochastic %K
Volume Matrix:
Raw volume
20 SMA volume
Volume % change from SMA
Multi-Timeframe Support
Current timeframe + up to 5 user-defined timeframes (e.g., 1H, 4H, Daily, Weekly, Monthly)
Customizable Toggles
Enable/disable any indicator
Choose which EMAs to show
Show/hide trend arrows
Choose which volume metrics to display
Choose table position (top_left, top_right, etc.)
Choose table text size
Trend Arrows & Colors
Green ▲ = bullish / rising trend
Red ▼ = bearish / falling trend
Gray – = neutral/no change
Background colors indicate overbought/oversold, trend strength, or volume surge.
Indicator Data Fetch PINE CODE Short Summary
request.security() → pulls data from the selected timeframe (tf).
Each indicator’s calculation can be wrapped inside request.security() so the values are computed on that timeframe.
//@version=5
// === 1. VWAP ===
vwap_htf = request.security(syminfo.tickerid, tf, ta.vwap)
// === 2. MACD ===
macd_src = request.security(syminfo.tickerid, tf, close)
macd_val = ta.ema(macd_src, 12) - ta.ema(macd_src, 26)
macd_sig = ta.ema(macd_val, 9)
macd_hist = macd_val - macd_sig
// === 3. RSI ===
rsi_htf = request.security(syminfo.tickerid, tf, ta.rsi(close, 14))
// === 4. ADX & DI ===
adx_htf = request.security(syminfo.tickerid, tf, ta.adx(14))
plusDI = request.security(syminfo.tickerid, tf, ta.plus_di(14))
minusDI = request.security(syminfo.tickerid, tf, ta.minus_di(14))
// === 5. Supertrend ===
= request.security(syminfo.tickerid, tf, ta.supertrend(3, 7))
// === 6. Bollinger Bands ===
basis = ta.sma(close, 20)
dev = ta.stdev(close, 20)
bb_up = request.security(syminfo.tickerid, tf, basis + dev * 2)
bb_low = request.security(syminfo.tickerid, tf, basis - dev * 2)
// === 7. Stochastic ===
k = ta.sma(ta.stoch(close, high, low, 14), 3)
d = ta.sma(k, 3)
stochK = request.security(syminfo.tickerid, tf, k)
stochD = request.security(syminfo.tickerid, tf, d)
// === 8. EMA ===
ema20 = request.security(syminfo.tickerid, tf, ta.ema(close, 20))
ema50 = request.security(syminfo.tickerid, tf, ta.ema(close, 50))
// === 9. Historical Volatility (HV) ===
logReturns = math.log(close / close )
hv = request.security(syminfo.tickerid, tf, ta.stdev(logReturns, 20) * math.sqrt(252))
plot(vwap_htf, "VWAP")
plot(macd_val, "MACD", color=color.blue)
plot(rsi_htf, "RSI", color=color.purple)

Advanced Trend Panel v3.1This is a comprehensive dashboard indicator designed to give traders a multi-faceted view of the market at a single glance. It combines key indicators across multiple timeframes, calculates trend duration, and presents all information in a clean, color-coded table. This tool is perfect for confirming trade ideas, identifying trend alignment, and understanding the underlying market dynamics.
#### Key Features:
* **All-in-One Dashboard:** A convenient on-chart table summarizes the state of multiple key indicators, saving you screen space and time.
* **Multi-Timeframe (MTF) Forecast:** Analyzes the long-term trend on a higher timeframe (e.g., Daily) to provide context for the current chart's trend.
* **Trend Analysis:** Uses dual sets of EMAs (long-term and short-term) to define the primary and immediate trend directions.
* **Trend Duration:** A unique feature that calculates how long the current short-term and long-term trends have been active, helping you gauge trend maturity.
* **Core Indicators Included:**
* **ADX:** Measures trend strength to differentiate between strong trends and weak or sideways markets.
* **RSI:** Identifies overbought and oversold conditions.
* **Point of Control (POC):** Shows the price level with the highest traded volume over a lookback period, acting as a key level of support/resistance.
* **Volume:** Compares current volume to its moving average to spot unusual activity.
* **Customizable Alerts:** Set up alerts for trend changes (long-term or short-term), RSI crossing into overbought/oversold zones, or shifts in ADX trend strength.
#### How to Use:
1. Apply the indicator to your chart.
2. In the settings, configure the timeframes, indicator lengths, and display options to match your trading style.
3. Use the table to quickly assess if the long-term trend, short-term trend, and momentum are aligned.
4. Enable alerts to be notified of key changes in market conditions without having to watch the chart constantly.
**Disclaimer:** This script is for educational purposes only and should not be considered financial advice. All trading involves risk. Past performance is not indicative of future results. Please backtest and use this tool as part of a comprehensive trading plan with proper risk management.
Feedback is always welcome! If you find this indicator useful, please leave a like.

Momentum Long + Short Strategy (BTC 3H)Momentum Long + Short Strategy (BTC 3H)
🔍 How It Works, Step by Step
Detect the Trend (📈/📉)
Calculate two moving averages (100-period and 500-period), either EMA or SMA.
For longs, we require MA100 > MA500 (uptrend).
For shorts, we block entries if MA100 exceeds MA500 by more than a set percentage (to avoid fading a powerful uptrend).
Apply Momentum Filters (⚡️)
RSI Filter: Measures recent strength—only allow longs when RSI crosses above its smoothed average, and shorts when RSI dips below the oversold threshold.
ADX Filter: Gauges trend strength—ensures we only enter when a meaningful trend exists (optional).
ATR Filter: Confirms volatility—avoids choppy, low-volatility conditions by requiring ATR to exceed its smoothed value (optional).
Confirm Entry Conditions (✅)
Long Entry:
Price is above both MAs
Trend alignment & optional filters pass ✅
Short Entry:
Price is below both MAs and below the lower Bollinger Band
RSI is sufficiently oversold
Trend-blocker & ATR filter pass ✅
Position Sizing & Risk (💰)
Each trade uses 100 % of account equity by default.
One pyramid addition allowed, so you can scale in if the move continues.
Commission and slippage assumptions built in for realistic backtests.
Stops & Exits (🛑)
Long Stop-Loss: e.g. 3 % below entry.
Long Auto-Exit: If price falls back under the 500-period MA.
Short Stop-Loss: e.g. 3 % above entry.
Short Take-Profit: e.g. 4 % below entry.
🎨 Why It’s Powerful & Customizable
Modular Filters: Turn on/off RSI, ADX, ATR filters to suit different market regimes.
Adjustable Thresholds: Fine-tune stop-loss %, take-profit %, RSI lengths, MA gaps and more.
Multi-Timeframe Potential: Although coded for 3 h BTC, you can adapt it to stocks, forex or other cryptos—just recalibrate!
Backtest Fine-Tuned: Default settings were optimized via backtesting on historical BTC data—but they’re not guarantees of future performance.
⚠️ Warning & Disclaimer
This strategy is for educational purposes only and designed for a toy fund. Crypto markets are highly volatile—you can lose 100 % of your capital. It is not a predictive “holy grail” but a rules-based framework using past data. The parameters have been fine-tuned on historical data and are not valid for future trades without fresh calibration. Always practice with paper-trading first, use proper risk management, and do your own research before risking real money. 🚨🔒
Good luck exploring and experimenting! 🚀📊

Smart Market Matrix Smart Market Matrix
This indicator is designed for intraday, scalping, providing automated detection of price pivots, liquidity traps, and breakout confirmations, along with a context dashboard featuring volatility, trend, and volume.
## Summary Description
### Menu Settings & Their Roles
- **Swing Pivot Strength**: Controls the sensitivity for detecting High/Low pivots.
- **Show Pivot Points**: Toggles the display of HH/LL markers on the chart.
- **VWMA Length for Trap Volume** & **Volume Spike Multiplier**: Identify concentrated volume spikes for liquidity traps.
- **Wick Ratio Threshold** & **Max Body Size Ratio**: Detect candles with disproportionate wicks and small bodies (doji-ish) for traps.
- **ATR Length for Trap**: Measures volatility specific to trap detection.
- **VWMA Length for Breakout Volume**, **ATR Multiplier for Breakout**, **ATR Length for Breakout**, **Min Body/Range Ratio**: Set adaptive breakout thresholds based on volatility and volume.
- **OBV Smooth Length**: Smooths OBV momentum for breakout confirmation.
- **Enable VWAP Filter for Confirmations**: Optionally validate breakouts against the VWAP.
- **Enable Higher-TF Trend Filter** & **Trend Filter Timeframe**: Align breakout signals with the 1h/4h/Daily trend.
- **ADX Length**, **EMA Fast/Slow Length for Context**: Parameters for the context dashboard (Volatility, Trend, Volume).
- **Show Intraday VWAP Line**, **VWAP Line Color/Width**: Display the intraday VWAP line with custom style.
### Signal Interpretation Map
| Signal | Description | Recommended Action |
|--------------------------------|-----------------------------------------------------------|-------------------------------------------|
| 📌 **HH / LL (pivot)** | Market structure (support/resistance) | Note key levels |
| **Bull Trap(green diamond)** | Sweep down + volume spike + wick + rejection | Go long with trend filter
| **Bear Trap(red diamond)** | Sweep up + volume spike + wick + rejection | Go short with trend filter
| 🔵⬆️ **Breakout Confirmed Up** | Close > ATR‑scaled high + volume + OBV↑ | Go long with trend filter |
| 🔵⬇️ **Breakout Confirmed Down** | Close < ATR‑scaled low + volume + OBV↓ | Go short with trend filter |
| 📊 **VWAP Line** | Intraday reference to guide price | Use as dynamic support/resistance |
| ⚡ **Volatility** | ATR ratio High/Med/Low | Adjust position size |
| 📈 **Trend Context** | ADX+EMA Strong/Moderate/Weak | Confirm trend direction |
| 🔍 **Volume Context** | Breakout / Rising / Falling / Calm | Check volume momentum |
*This summary gives you a quick overview of the key settings and how to interpret signals for efficient intraday scalping.*
### Suggested Settings
- **Intraday Scalping (5m–15m)**
- `Swing Pivot Strength = 5`
- `VWMA Length for Trap Volume = 10`, `Volume Spike Multiplier = 1.6`
- `ATR Length for Trap = 7`
- `VWMA Length for Breakout Volume = 12`, `ATR Length for Breakout = 9`, `ATR Multiplier for Breakout = 0.5`
- `Min Body/Range Ratio for Breakout = 0.5`, `OBV Smooth Length = 7`
- `Enable Higher-TF Trend Filter = true` (TF = 60)
- `Show Intraday VWAP Line = true` (Color = orange, Width = 2)
- **Swing Trading (4h–Daily)**
- `Swing Pivot Strength = 10`
- `VWMA Length for Trap Volume = 20`, `Volume Spike Multiplier = 2.0`
- `ATR Length for Trap = 14`
- `VWMA Length for Breakout Volume = 30`, `ATR Length for Breakout = 14`, `ATR Multiplier for Breakout = 0.8`
- `Min Body/Range Ratio for Breakout = 0.7`, `OBV Smooth Length = 14`
- `Enable Higher-TF Trend Filter = true` (TF = D)
- `Show Intraday VWAP Line = false`
*Adjust these values based on the symbol and market volatility for optimal performance.*

MomentumSignal Kit RSI-MACD-ADX-CCI-CMF-TSI-EStoch// ----------------------------------------
// Description:
// ----------------------------------------
// MomentumKit RSI/MACD-ADX-CCI-CMF-TSI-EStoch Suite is a comprehensive momentum indicator suite designed to provide robust buy and sell signals through the consensus of multiple normalized momentum indicators. This suite integrates the following indicators:
// - **Relative Strength Index (RSI)**
// - **Stochastic RSI**
// - **Moving Average Convergence Divergence (MACD)** with enhanced logic
// - **True Strength Index (TSI)**
// - **Commodity Channel Index (CCI)**
// - **Chaikin Money Flow (CMF)**
// - **Average Directional Index (ADX)**
// - **Ehlers' Stochastic**
//
// **Key Features:**
// 1. **Normalization:** Each indicator is normalized to a consistent scale, facilitating easier comparison and interpretation across different momentum metrics. This uniform scaling allows traders to seamlessly analyze multiple indicators simultaneously without the confusion of differing value ranges.
//
// 2. **Consensus-Based Signals:** By combining multiple indicators, MomentumKit generates buy and sell signals based on the agreement among various momentum measurements. This multi-indicator consensus approach enhances signal reliability and reduces the likelihood of false positives.
//
// 3. **Overlap Analysis:** The normalization process aids in identifying overlapping signals, where multiple indicators point towards a potential change in price or momentum. Such overlaps are strong indicators of significant market movements, providing traders with timely and actionable insights.
//
// 4. **Enhanced Logic for MACD:** The MACD component within MomentumKit utilizes enhanced logic to improve its responsiveness and accuracy in detecting trend changes.
//
// 5. **Debugging Features:** MomentumKit includes advanced debugging tools that display individual buy and sell signals generated by each indicator. These features are intended for users with technical and programming skills, allowing them to:
// - **Visualize Signal Generation:** See real-time buy and sell signals for each integrated indicator directly on the chart.
// - **Adjust Signal Thresholds:** Modify the criteria for what constitutes a buy or sell signal for each indicator, enabling tailored analysis based on specific trading strategies.
// - **Filter and Manipulate Signals:** Enable or disable specific indicators' contributions to the overall buy and sell signals, providing flexibility in signal generation.
// - **Monitor Indicator Behavior:** Utilize debug plots and labels to understand how each indicator reacts to market movements, aiding in strategy optimization.
//
// **Work in Progress:**
// MomentumKit is continuously evolving, with ongoing enhancements to its algorithms and user interface. Current debugging features are designed to offer deep insights for technically adept users, allowing for extensive customization and fine-tuning. Future updates aim to introduce more user-friendly interfaces and automated optimization tools to cater to a broader audience.
//
// **Usage Instructions:**
// - **Visibility Controls:** Users can toggle the visibility of individual indicators to focus on specific momentum metrics as needed.
// - **Parameter Adjustments:** Each indicator comes with customizable parameters, allowing traders to fine-tune the suite according to their trading strategies and market conditions.
// - **Debugging Features:** Enable the debugging mode to visualize individual indicator signals and adjust their contribution to the overall buy/sell signals. This requires a basic understanding of the underlying indicators and their operational thresholds.
//
// **Benefits:**
// - **Simplified Analysis:** Normalization simplifies the process of analyzing multiple indicators, making it easier to identify consistent signals across different momentum measurements.
// - **Improved Decision-Making:** Consensus-based signals backed by multiple normalized indicators provide a higher level of confidence in trading decisions.
// - **Versatility:** Suitable for various trading styles and market conditions, MomentumKit offers a versatile toolset for both novice and experienced traders.
//
// **Technical Requirements:**
// - **Programming Knowledge:** To fully leverage the debugging and signal manipulation features, users should possess a foundational understanding of Pine Script and the mechanics of momentum indicators.
// - **Customization Skills:** Ability to adjust indicator parameters and debug filters to align with specific trading strategies.
//
// **Disclaimer:**
// This indicator suite is intended for educational and analytical purposes only and does not constitute financial advice. Trading involves significant risk, and past performance is not indicative of future results. Always conduct your own analysis or consult a qualified financial advisor before making trading decisions.

Support Resistance BreakthroughThe Support Resistance Breakthrough (SRB) is a comprehensive technical indicator that aims to evaluate market strength and detect potential breakout opportunities. It integrates the following elements:
ADX (Average Directional Index): Helps measure the overall trend strength. You can adjust both the ADX length and smoothing length.
ATR (Average True Range): Provides a measure of market volatility.
RSI (Relative Strength Index): Measures the momentum and helps identify overbought or oversold conditions.
Weighting Scheme: The weighting scheme adds or subtracts a fraction of the ROC of RSI, modulated by ATR and ADX. The weighting percentage can be customized.
Normalization Option: Allows the user to plot normalized values, scaling them between 0 and 100.
Horizontal Lines: Useful reference lines at 0, 50, and 100, displayed when normalization is used.
Interpretation: When the indicator is above the 0 line (or 50 when normalized), there's a high chance of breaking through resistance. Conversely, when it's below the 0 line, there's a high chance of breaking through support. Together with a momentum indicator, such as RSI and/or Stochastic RSI, this indicator functions excellently.
The combination of these elements makes the SRB an adaptable tool for various trading strategies. It can help identify potential breakout or breakdown areas and gauge the underlying strength of the market.
Compatibility with Adjustable Fibonacci Retracement Indicator: Together with the SRB indicator, the AFIBR can make it easier to determine the likelihood of breaking through support or resistance.

Ta StrategyHello guys
This script follows traditional technical indicators
MACD, ADX, RSI and pivot points
If the price is above the resistance and the MACD has crossover ,and the RSI 14 is above 50
ADX is higher than 20, and DI+ is higher than DI-. This is a buy signal and vice versa for a sell signal
The script moves the stop loss to the entry price after the first target is reached
You can specify the quantity you want to sell when the price reaches the first target
There are also options like if you want the script to entry long or short, or both
you can reverse the strategy if it does not work well
If you want to inquire about any details, please let me know in the comments

Momentum PlayTraders always need a confirmation of momentum in price action to ride the swings.
Momentum Play Indicator consists of the below:
Bullish Conditions :
1)EMA 8 above EMA 34 and rising
2)Candle close above 5 candle high
3) RSI above 60
4) Volume above 5 candles avg. volume
5) ADX above 20
Bearish Conditions :
1)EMA 8 below EMA 34 and falling
2)Candle close below 5 candle low
3) RSI below 40
4) Volume above 5 candles avg. volume
5) ADX above 20
Traders can change the inputs as per their liking to adjust as per their comfortable timeframe.
Credits: Special Thanks to Mr. DTBHAT for sharing the above conditions.

TL_Strategy [APIDEVs]TL_STRATEGY:
The TL_STRATEGY , is a whole ecosystem of indicators that make up a quite powerful and famous strategy in cryptocurrency trading, it is composed of the following indicators:
• Exponential moving media bands (10 and 55).
• Squeeze Momentum indicator (SQZMON PRO +).
• Volume profile (VP Developed by APIDEVs).
• Average directional index ( ADX PRO +).
In ApiDev , we decided to visually optimize this strategy, that is why we created an information panel that shows the joint projection of all the indicators that we already mentioned.
IMPROVEMENTS MADE IN THE STRATEGY:
Simpler: We simplified the interface of all indicators [so that the trader can follow the ABCs of his strategy without much complication.
Buy and sell signals: Based on a strategy that incorporates two moving averages of 10 and 55 periods, the observation of the strength of the ADX and the directionality of the oscillators of the SQZMON, signals of buying and selling to be valued by the trader.
Side panel: We integrate a side panel that allows observing the assessment and direction of all the indicators that make up the strategy.
It has an alert system that will send notifications about the changes that occur in the indicator.

Oscillator ExtremesThe Oscillator Extremes indicator plots the normalized positioning of the selected oscillator versus the Bollinger Bands' upper and lower boundaries. Currently, this indicator has four different oscillators to choose from; RSI, CMO, CCI, and ROC.
When the oscillator pushes towards one extreme, it will bring the value of the prevailing line closer to zero. If the bullish or bearish line crosses the zero line, the oscillator is past the extreme of the Bollinger Band.
Example: If the RSI crosses over the upper boundary of the Bollinger, the bullish(green) line will cross under the zero line.
Crossovers of the bullish and bearish lines can indicate a shift in momentum and are a signal. Where the line crossing under, towards zero, is the prevailing trend. The plotted lines will highlight green(bullish) or red(bearish) to show the prevailing trend. This is similar to a DI+- crossover that is commonly associated with the ADX.
We have included an optional normalized ADX to help validate signals. The ADX will change color based on the slope of the ADX. Purple indicates a positive slope and white for a negative slope.
