MMM MARKET CHAOS TO CLARITY INTELLIGENCE @MaxMaserati# MMM MARKET CHAOS TO CLARITY INTELLIGENCE
## Overview
The MMM MARKET CHAOS TO CLARITY INTELLIGENCE (MMM AI Pro) by MaxMaserati is a sophisticated multi-factor analysis tool that provides comprehensive market insights through a unified dashboard. This system integrates several proprietary components to detect market conditions, trends, and potential reversals.
At its core, this indicator is designed to bring clarity to market complexity by identifying meaningful patterns and establishing order within what often appears as random market chaos
The MMM Intelligence Matrix accomplishes this through its multi-layered approach:
- The MMPD system quantifies market conditions on a clear 0-100 scale, transforming complex price movements into actionable premium/discount levels
- The proprietary candle analysis (MMMC Bias) identifies specific patterns with predictive value
- The integration of volume, momentum, and multi-timeframe analysis creates a comprehensive market context
- The Hot/Cold classification system helps traders distinguish between sustainable moves and overextended conditions
What makes this indicator particularly valuable is how it synthesizes multiple technical factors into clear visual signals and classifications. Instead of leaving traders to interpret numerous conflicting indicators, it presents an organized dashboard of market conditions with straightforward action zones.
## Core Components
### MMPD (Max Maserati Premium and Discount)
- Normalizes price movement on a 0-100 scale:
- **Premium (>50)**: Bullish conditions
- **Discount (<50)**: Bearish conditions
- **Extreme values (>90 or <10)**: Potential reversal zones
### MMMC (Max Maserati Model Candle) Bias
- Analyzes candle patterns to predict behavior:
- **Bullish/Bearish Body Close**: Price closes beyond previous candle's high/low
- **Bullish/Bearish Affinity**: Shows tendency toward continuation
- **Seek & Destroy**: Tests previous levels then breaks in new direction
- **Close Inside**: Closes within previous candle's range with directional bias
- **Plus/Minus**: Indicates slight tendency toward bulls/bears
### PC Strength (Previous Candle Strength)
- Measures percentage power of recent candlesticks
- Analyzes strength across multiple previous candles (PC1, PC2, PC3)
### MVM (Market Volatility Momentum)
- Adaptive moving averages system analyzing multiple timeframes:
- **Short context (8 bars)**: Immediate direction
- **Medium context (21 bars)**: Intermediate validation
- **Long context (55 bars)**: Primary trend confirmation
- **Higher timeframe**: Additional confirmation
### Volume Intelligence System
- Adaptive algorithm comparing current volume to 20-period average
- Identifies significant volume events and thresholds
### Hot/Cold Momentum Classification
- **Strong Bullish/Bearish (Hot)**: Potentially overextended
- **Strong Bullish/Bearish (Cold)**: Strong with room to continue
- **Bullish/Bearish Momentum**: Clear directional bias
- **Mild Bullish/Bearish**: Weak directional bias
### HVC (Highest Volume Candles) Detection
- Triangle markers and sequential stars indicate significant volume-confirmed movements
- Signals potential trend changes and continuation setups
## Dashboard Interface
The customizable dashboard displays:
1. **MMMC Bias**: Candle pattern analysis and direction
2. **Delta MA**: Buy/sell pressure with directional arrows
3. **PC Strength**: Percentage strength of previous candles
4. **Current Trend**: Overall market bias state
5. **MMPD Bias**: Premium/discount context
6. **Short/Medium/Long Term**: Price change percentages
7. **Trend Quality**: Reliability rating
8. **Volume Strength**: Classification (High/Medium/Low)
9. **MMPD Values**: Current level with direction indicator
10. **HTF Trend**: Higher timeframe confirmation
11. **Trend Strength**: Overall momentum measurement
12. **Action Zone**: Trading zone classification
13. **Momentum Strength**: Hot/Cold status
## MMPD Value Classifications
- **EXTREME PREMIUM (>90) ⚠️**: Extremely overbought
- **HIGH PREMIUM (80-90) ↗**: Strong bullish (caution)
- **PREMIUM (65-80) ↗**: Healthy bullish zone
- **LIGHT PREMIUM (50-65) →**: Mild bullish territory
- **LIGHT DISCOUNT (35-50) →**: Mild bearish territory
- **DISCOUNT (20-35) ↘**: Healthy bearish zone
- **HIGH DISCOUNT (10-20) ↘**: Strong bearish (caution)
- **EXTREME DISCOUNT (<10) ⚠️**: Extremely oversold
## Action Zone Classifications
- **MASSIVE BUY/SELL ZONE ★★★**: Very strong bias (Strength >5.0)
- **STRONG BUY/SELL ZONE ★★**: Strong bias (Strength >3.0)
- **MEDIUM BUY/SELL ZONE ★**: Moderate bias (Strength >2.0)
- **LIGHT BUY/SELL ZONE ⋆**: Mild bias (Strength >1.0)
- **SUPER LIGHT BUY/SELL ZONE ·**: Weak bias (Strength <1.0)
- **NEUTRAL ZONE**: No clear directional bias
## Visual Signals
1. **Triangle Markers**: HVC system directional signals (up/down)
2. **Sequential Stars (★)**: Advanced confirmation signals following trend changes
3. **High Volume Highlighting**: Optional candle emphasis for volume events
## Entry Conditions
### Strong Buy Setup
- MMPD Values: PREMIUM or LIGHT PREMIUM
- Hot/Cold Status: "⚠️ Strong Bullish (Cold)" or "↗️ Bullish Momentum"
- Action Zone: MASSIVE or STRONG BUY ZONE
- Volume Strength: High or Medium
- Current Trend: Strong Bullish or Bullish
### Strong Sell Setup
- MMPD Values: DISCOUNT or LIGHT DISCOUNT
- Hot/Cold Status: "⚠️ Strong Bearish (Cold)" or "↘️ Bearish Momentum"
- Action Zone: MASSIVE or STRONG SELL ZONE
- Volume Strength: High or Medium
- Current Trend: Strong Bearish or Bearish
## Exit Conditions
### Exit Long Positions When
- Hot/Cold Status changes to "⚠️ Strong Bullish (Hot)" or "↘️ Bearish Momentum"
- MMPD Values shows EXTREME PREMIUM or HIGH PREMIUM
- Action Zone changes to NEUTRAL ZONE or any SELL ZONE
- Current Trend shows "Bearish Reversal" or "Exiting Overbought"
### Exit Short Positions When
- Hot/Cold Status changes to "⚠️ Strong Bearish (Hot)" or "↗️ Bullish Momentum"
- MMPD Values shows EXTREME DISCOUNT or HIGH DISCOUNT
- Action Zone changes to NEUTRAL ZONE or any BUY ZONE
- Current Trend shows "Bullish Reversal" or "Exiting Oversold"
## Position Sizing Guidelines
- **Full Position (100%)**: Action Zone ★★★/★★, normal momentum, High volume
- **Reduced Position (50-75%)**: "Cold" signal, Action Zone ★, Medium volume
- **Small Position (25-50%)**: Action Zone ⋆, Medium/Low volume, mixed signals
- **No Position**: "Hot" signal, NEUTRAL zone, Low volume
## Special Trade Setups
### Reversal Setups
- **Bullish Reversal**: Transition from EXTREME DISCOUNT, Hot→Cold change, emerging buy signal, high volume
- **Bearish Reversal**: Transition from EXTREME PREMIUM, Hot→Cold change, emerging sell signal, high volume
### Continuation Setups
- **Bullish Continuation**: PREMIUM range, "Cold" signal, strong volume, timeframe alignment, clear Action Zone
- **Bearish Continuation**: DISCOUNT range, "Cold" signal, strong volume, timeframe alignment, clear Action Zone
## Sequential Stars System
- **Sequential Buy Signal**: Bullish star after bearish trend, volume confirmation
- **Sequential Sell Signal**: Bearish star after bullish trend, volume confirmation
## Best Practices
- Check multiple timeframes (prioritize when all align)
- Validate with volume (High >2.5x, Medium >1.2x)
- Assess trend quality (Strong ★★★, Confirmed ★★, Warning ⚠, Transition ↕)
- Handle inside bars/consolidation with additional confirmation
## Technical Considerations
- Based on closed candles for calculations
- Requires reliable volume data
- Higher sensitivity settings may produce more frequent signals
- Extreme readings indicate potential turning points
- Sequential stars require proper trend changes for activation
## Indicator Applicability
- **Markets**: Forex, Crypto, Stocks, Futures, Commodities
- **Timeframes**: 1H+ recommended, 4H/Daily for primary analysis
*Intended for use with the full MMM system. Trading decisions require proper knowledge and risk management.*
In den Scripts nach "Candlestick" suchen

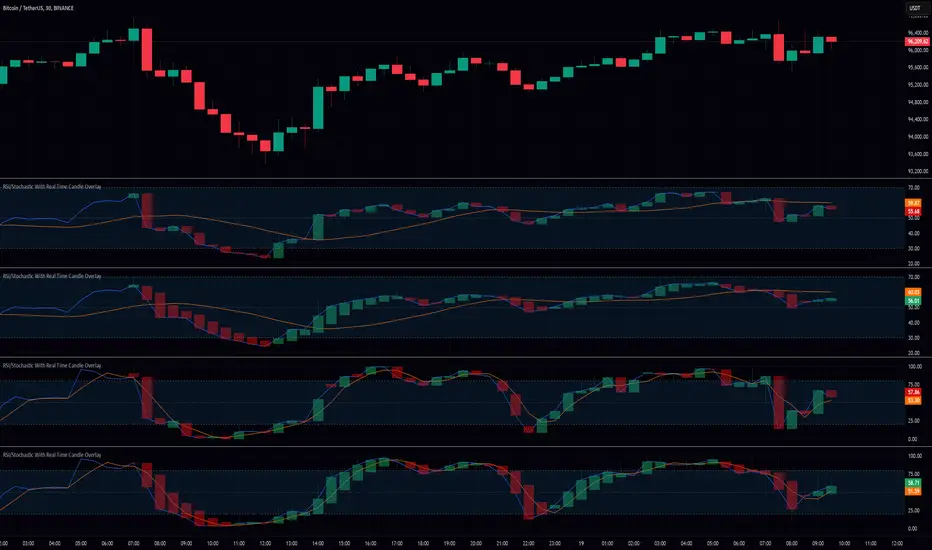
RSI/Stochastic With Real Time Candle OverlayThis indicator provides an alternative way to visualize either RSI or Stochastic values by representing them as candle bars in real time, allowing a more detailed view of momentum shifts within each bar. By default, it displays the standard historical plot of the chosen oscillator in the background, but once you are receiving real-time data (or if you keep your chart open through the close), it begins overlaying candles that track the oscillator’s intrabar movements. These candles only exist for as long as the chart remains open; if you refresh or load the chart anew, there is no stored candle history, although the standard RSI or Stochastic line is still fully retained. These candles offer insight into short-term fluctuations that are otherwise hidden when viewing a single line for RSI or Stochastic.
In the settings, there is an option to switch between standard candlesticks and Heiken Ashi. When Heiken Ashi is selected, the indicator uses the Heiken Ashi close once it updates in real time, producing a smoothed view of intrabar price movement for the oscillator. This can help identify trends in RSI or Stochastic by making it easier to spot subtle changes in direction, though some may prefer the unmodified values that come from using regular candles. The combination of these candle styles with an oscillator’s output offers flexibility for different analytical preferences.
Traders who use RSI or Stochastic often focus on entry and exit signals derived from crossing certain thresholds, but they are usually limited to a single reading per bar. With this tool, it becomes possible to watch how the oscillator’s value evolves within the bar itself, which can be especially useful for shorter timeframes or for those who prefer a more granular look at momentum shifts. The visual separation between bullish and bearish candle bodies within the indicator can highlight sudden reversals or confirm ongoing trends in the oscillator, aiding in more precise decision-making. Because the candle overlay is cleared as soon as the bar closes, the chart remains uncluttered when scrolling through historical data, ensuring that only the necessary real-time candle information is displayed.
Overall, this indicator is intended for users who wish to track intrabar changes in RSI or Stochastic, with the added choice of standard or Heiken Ashi candle representation. The real-time candle overlay clarifies short-lived fluctuations, while the standard line plots maintain the usual clarity of past data. This approach can be beneficial for those who want deeper insights into how oscillator values develop in real time, without permanently altering the simplicity of the chart’s historical view.
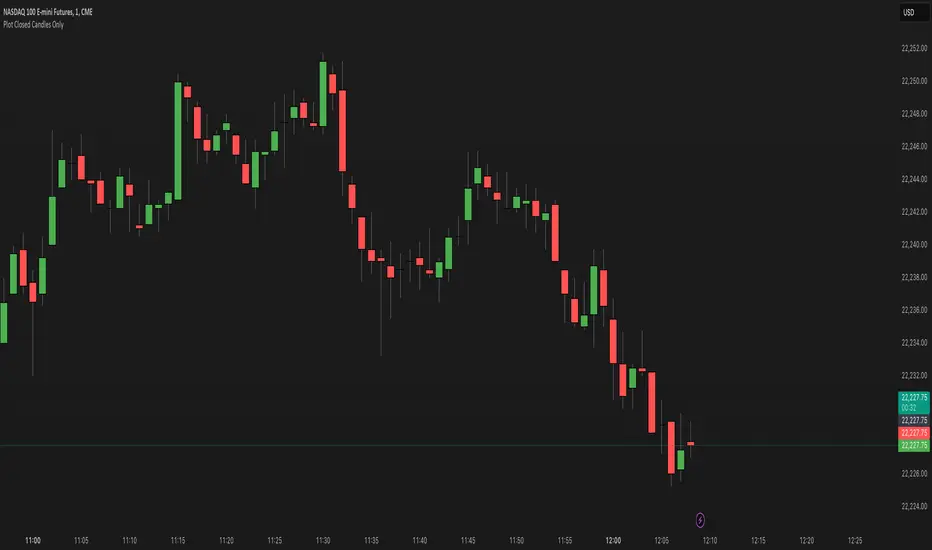
Plot Closed Candles OnlyWhat It Does:
This indicator helps you see candlesticks on your chart only after they are fully closed. It colors the candles based on whether they are bullish (green), bearish (red), or neutral (black/Doji). This way, you can focus on confirmed price movements without the distraction of candles that are still forming.
Key Features:
Plots Confirmed Candles: Only shows candles after they are fully formed.
Custom Colors:
Green: Bullish candles (close > open).
Red: Bearish candles (close < open).
Black: Doji candles (close = open).
Easy to Use: Simply add the indicator to your chart.
How to Use:
Add the indicator to your chart.
Turn off the default candles by:
Right-clicking on the chart.
Going to Style > Candles.
Disabling borders, bodies, and wicks for the default candles.
Enjoy a cleaner view of confirmed candles with clear color coding!
Why Use It?:
Helps you focus on confirmed price action.
Makes it easier to spot bullish, bearish, and neutral candles.
Great for traders who want to avoid the noise of incomplete candles.
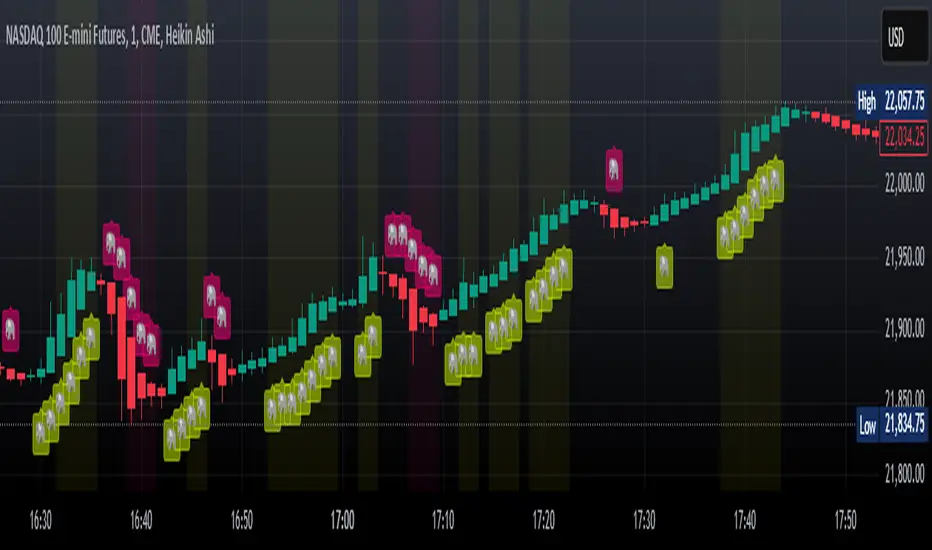
Elephant Bar Detector by McAiElephant Bar Detector 🐘
Overview:
The Elephant Bar Detector identifies significant bullish and bearish bars (candlesticks) based on size and volume criteria. It also detects follow-through patterns, helping traders confirm strong price movements.
Features:
✅ Elephant Bar Detection:
Bullish Elephant Bar 🐘: A large bullish candle with high volume.
Bearish Elephant Bar 🐘: A large bearish candle with high volume.
✅ Follow-Through Confirmation:
Checks if price continues in the same direction after the Elephant Bar.
Requires at least 80% follow-through over the next few bars.
✅ Visual Markers & Alerts:
Yellow Elephant 🐘 (Bottom) → Bullish signal
Pink Elephant 🐘 (Top) → Bearish signal
Background Highlight: Indicates confirmed follow-through
Alerts: Get notified when an Elephant Bar or follow-through occurs.
How It Works:
Calculates the average candle size over a user-defined period.
Sets a volume threshold (average volume × multiplier).
Identifies Elephant Bars when price movement & volume exceed thresholds.
Confirms follow-through by checking if 80% of the next few bars continue in the same direction.
Customizable Settings:
Length for Average Candle Size (Default: 200)
Volume Multiplier (Default: 1.5)
Number of Follow-Through Bars (Default: 3)
This indicator helps traders spot strong price moves early and confirm trends before entering trades. 🚀🔥
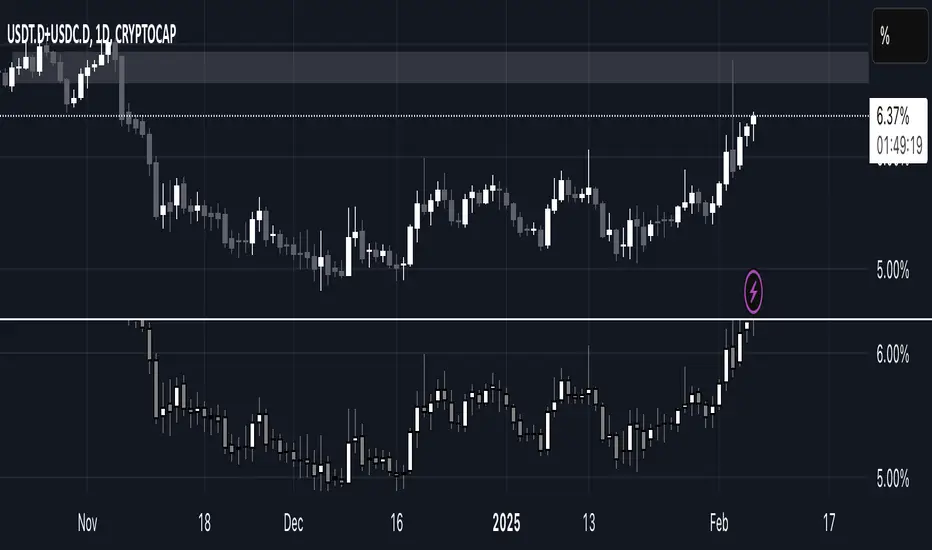
USDT.D + USDT.C ALL TIMEFRAMESThis indicator combines the dominance of USDT (USDT.D) and USDC (USDC.D) to track total stablecoin market share across all timeframes. It displays the combined dominance as candlesticks, providing a clearer view of market liquidity shifts and investor sentiment.
📌 How to Use:
Green candles indicate rising stablecoin dominance (potential risk-off sentiment).
Red candles indicate declining stablecoin dominance (potential risk-on sentiment).
Works on all timeframes, from intraday scalping to macro trend analysis.
This tool is essential for traders looking to analyze stablecoin liquidity flow, identify market turning points, and refine trading strategies based on stablecoin dominance behavior. 🚀
Enigma Unlocked 2.0Description for "Enigma Unlocked 2.0" Pine Script Indicator
Overview
Enigma Unlocked 2.0 is an advanced and highly customizable indicator designed to deliver actionable buy and sell signals by leveraging precise candlestick logic during specific market transitions. This indicator is built for flexibility, helping traders identify high-probability trade setups during key trading periods, specifically the transitions between the Asian Kill Zone and London Kill Zone as well as the London Kill Zone and New York Kill Zone on the 30-minute timeframe.
By combining Enigma Unlocked 2.0 with the ICT Killzones & Pivots indicator, traders can gain a deeper understanding of the timing and location of these transitions. Waiting for signals during these defined kill zones increases the likelihood of finding high-probability trade setups.
How to Use
Follow the Kill Zone Transitions:
Use the ICT Killzones & Pivots indicator to clearly visualize the boundaries of the Asian, London, and New York kill zones.
Focus on the signals generated by Enigma Unlocked 2.0 that align with these kill zone transitions.
Plotting Entries and Targets with Gann Box:
For Buy Signals:
Use the Gann Box tool to mark the high and low of the signal candle.
Ensure your Gann Box settings include only the 50%, 0%, and 100% levels.
Your entry zone lies between the 50% and 100% levels (discount zone). This is where buy trades are expected to offer an optimal risk-reward ratio.
For Sell Signals:
Similarly, plot the Gann Box on the high and low of the signal candle.
The 50% to 100% zone acts as the premium area for sell trades.
Setting Stop Loss and Targets:
To identify a safe stop loss, split the 50% zone of the Gann Box using another Gann Box.
Draw the secondary Gann Box from 50% to 100% of the initial box, then extend it to double the height.
For sell trades, place the stop loss above the extended 100% level.
For buy trades, place the stop loss below the extended 100% level.
Aim for a minimum of 1:1 risk-to-reward to ensure optimal trade management.
How It Works
Buy Logic:
Buy Logic 1: Detects a bullish candle (close > open) that:
Closes above its midpoint (50% of the candle body).
Has a low lower than the previous candle's low.
Buy Logic 2: Identifies a bearish candle (close < open) that:
Closes above its midpoint (50% of the candle body).
Has a low lower than the previous candle's low.
Sell Logic:
Sell Logic 1: Detects a bearish candle (close < open) that:
Closes below its midpoint (50% of the candle body).
Has a high higher than the previous candle's high.
Sell Logic 2: Identifies a bullish candle (close > open) that:
Closes below its midpoint (50% of the candle body).
Has a high higher than the previous candle's high.
Real-Time Alerts and Visual Cues:
Green triangles below candles indicate buy opportunities.
Red triangles above candles indicate sell opportunities.
Built-in alert conditions notify you of signals in real-time, so you never miss a trading opportunity.
Why Use Enigma Unlocked 2.0?
Precision: Advanced candlestick logic ensures that signals are generated only under optimal conditions.
Session-Based Filtering: Signals occur exclusively during the most active market sessions (kill zones), improving trade quality.
Visualization: Simple yet effective tools like Gann Box integration and clear visual signals make this indicator easy to use and highly effective.
Real-Time Alerts: Stay informed of potential trades even when you're away from your screen.
Enigma Unlocked 2.0 empowers traders to harness the power of candlestick analysis and session-based strategies for disciplined and effective trading. Pair this with a solid understanding of risk management and kill zones to achieve consistent results in your trading journey.

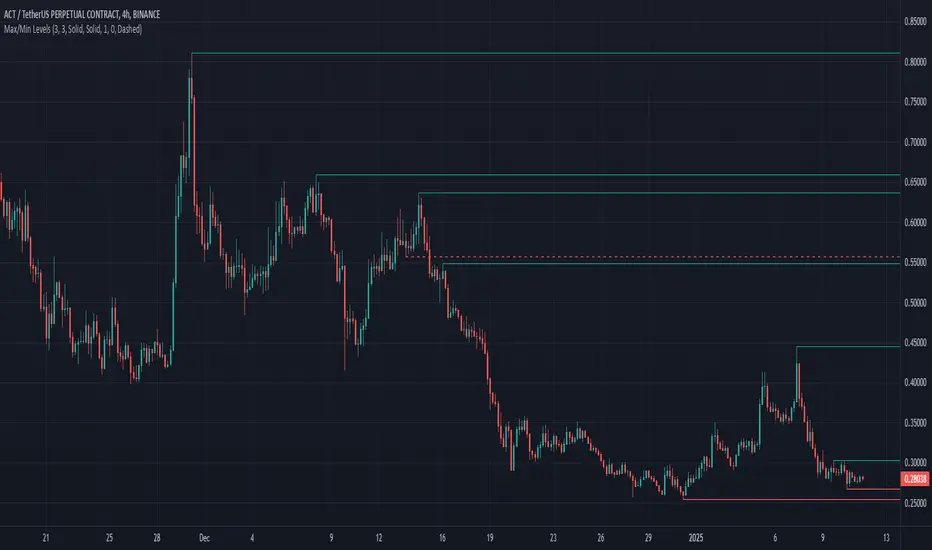
Max/Min LevelsHighlights highs and lows that match the search criteria. A high is considered to be broken if the candlestick breaks through its shadow
A three-candlestick pattern will match the parameters:
Candle before - 1
Candle after - 1
A five-candlestick pattern will match the parameters:
Candle before - 2
Candle after - 2
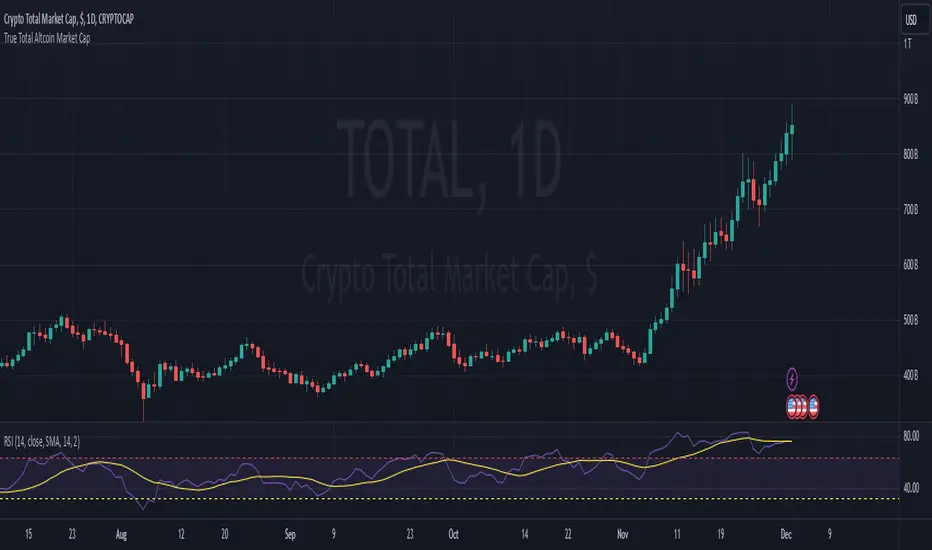
True Total Altcoin Market CapThis indicator calculates the real total altcoin market capitalization by removing Bitcoin, Ethereum, and major stablecoins (USDT, USDC, BUSD, DAI) from the total cryptocurrency market cap. It replaces the standard price bars with custom-colored candlesticks showing the true altcoin market movements.
Features:
Excludes BTC, ETH, and major stablecoins for accurate altcoin market analysis
Custom color scheme: Green (#26a79b) for bullish and Red (#ef5351) for bearish candles
Based on CRYPTOCAP:TOTAL data
Helps traders focus on pure altcoin market trends
Non-repainting, using standard OHLC data
This tool provides a clearer view of altcoin market strength by filtering out the influence of major cryptocurrencies and stablecoins.
TechniTrend: Advance Custom Candle Finder (CCF)🟦 Description:
The TechniTrend: Advanced Custom Candle Finder (CCF) is a versatile tool designed to help traders identify custom candlestick patterns using various configurable criteria. This indicator provides a flexible framework to filter and highlight specific candles based on volume, volatility, candle characteristics, and other important metrics. Below is a detailed explanation of each filter and its customization options:
🟦 Volume-Based Filters
🔸Volume Spike Filter:
Enable filtering based on volume spikes. Use the Volume Spike Multiplier to define what constitutes a significant increase in volume compared to the average. A spike indicates unusually high trading interest.
🔸Volume Range Filter:
Filter candles based on specific volume ranges. Set Minimum Volume and Maximum Volume thresholds to isolate candles with trading volumes within your desired boundaries.
🟦 Candle Body & Wick Filters
🔸Body Size Filter:
Filter candles based on the size of their body. A Body Size Multiplier determines what is considered a large body relative to historical averages.
🔸Body Percentage Filter:
Filter based on the proportion of the body to the entire candle size. Use the Body Percentage Threshold to highlight candles where the body makes up a certain percentage of the total candle range.
🔸Wick-to-Body Ratio Filter:
Identify candles with specific wick-to-body ratios. A higher Wick-to-Body Ratio can indicate indecision or reversals.
🟦 Volatility & Range Filters
🔸Volatility Filter:
Highlight candles based on price changes relative to volume. The Volatility Multiplier sets the threshold for what is considered a volatile candle.
🔸Candle Range Filter:
Filter based on the range (High - Low) of each candle. Use Minimum Candle Range and Maximum Candle Range to specify your desired candle size in points or pips.
🔸Short-Term and Long-Term Volatility Filters:
Analyze volatility over different periods. Enable Short-Term Volatility or Long-Term Volatility filters to compare recent volatility against historical averages, helping you detect sudden market shifts.
🟦 Candle Color & Open/Close Filters
🔸Candle Color Filter:
Filter based on the candle's color. Choose between Bullish (close > open) or Bearish (close < open) to focus on specific market sentiments.
🔸Open/Close Price Range Filter:
Filter based on the difference between the open and close prices. Use Minimum Open/Close Range and Maximum Open/Close Range to specify your acceptable range in price movements.
🟦 Core Functionality
The CCF indicator combines these filters to provide a final signal whenever a candle meets all the enabled criteria. By default, it highlights any qualifying candle directly on the chart and changes the background color for added visibility.
🟦 Key Features:
🔸Highly Customizable Filters: Adjust the parameters for each filter to tailor the indicator to your specific needs.
🔸Multiple Conditions: Combine several conditions to identify complex candlestick patterns.
🔸Real-Time Alerts: Receive instant notifications when a matching candle pattern is found based on your custom criteria.
🟦 How to Use:
🔸Enable the filters you wish to apply (e.g., Volume Spike, Candle Body Size, Volatility).
🔸Adjust the thresholds for each filter to fine-tune the pattern recognition criteria.
🔸Observe the chart to see visual cues for candles that match your specified conditions.
🟦 Notes:
🔸Ensure that you clearly understand each filter’s role. Over-filtering with very strict criteria may reduce the number of signals.
🔸This indicator is designed to be a customizable tool, not providing buy or sell recommendations.
🔸Use in combination with other analysis tools and indicators for the best results.

The Pattern-Synced Moving Average System (PSMA)Description:
The Pattern-Synced Moving Average System (PSMA) is a comprehensive trading indicator that combines the reliability of moving averages with automated candlestick pattern detection, real-time alerts, and dynamic risk management to enhance both trend-following and reversal strategies. The PSMA system integrates key elements of trend analysis and pattern recognition to provide users with configurable entry, stop-loss, and take-profit levels. It is designed for all levels of traders who seek to trade in alignment with market context, using signals from trend direction and established candlestick patterns.
Key Functional Components:
Multi-Type Moving Average:
Provides flexibility with multiple moving average options: SMA, EMA, WMA, and SMMA.
The selected moving average helps users determine market trend direction, with price positions relative to the MA acting as a trend confirmation.
Automatic Candlestick Pattern Detection:
Identifies pivotal patterns, including bullish/bearish engulfing and reversal signals.
Helps traders spot potential market turning points and adjust their strategies accordingly.
Configurable Entry, Stop-Loss, and Take-Profit:
Risk management is customizable through risk/reward ratios and risk tolerance settings.
Entry, stop-loss, and take-profit levels are automatically plotted when patterns appear, facilitating rapid trade decision-making with predefined exit points.
Higher Timeframe Trend Confirmation:
Optional feature to verify trend alignment on a higher timeframe (e.g., checking a daily trend on an intraday chart).
This added filter improves signal reliability by focusing on patterns aligned with the broader market trend.
Real-Time Alerts:
Alerts can be set for key pattern detections, allowing traders to respond promptly without constant chart monitoring.
How to Use PSMA:
Set Moving Average Preferences:
Choose the preferred moving average type and length based on your trading strategy. The MA acts as a foundational trend indicator, with price positions indicating potential uptrends (price above MA) or downtrends (price below MA).
Adjust Risk Management Settings:
Set a Risk/Reward Ratio for defining take-profit levels relative to the entry and stop-loss levels.
Modify the Risk Tolerance Percentage to adjust stop-loss placement, adding flexibility in managing trades based on market volatility.
Activate Higher Timeframe Confirmation (Optional):
Enable higher timeframe trend confirmation to filter out counter-trend trades, ensuring that detected patterns are in sync with the larger market trend.
Review Alerts and Trade Levels:
With PSMA’s real-time alerts, traders receive notifications for detected patterns without having to continuously monitor charts.
Visualized entry, stop-loss, and take-profit lines simplify trade execution by highlighting levels directly on the chart.
Execute Based on Entry and Exit Levels:
The entry line suggests the potential entry price once a bullish or bearish pattern is detected.
The stop-loss line is based on your set risk tolerance, establishing a predefined risk level.
The take-profit line is calculated according to your preferred risk/reward ratio, providing a clear profit target.
Example Strategy:
Ensure price is above or below the selected moving average to confirm trend direction.
Await a PSMA signal for a bullish or bearish pattern.
Review the plotted entry, stop-loss, and take-profit lines, and enter the trade if the setup aligns with your risk/reward criteria.
Activate alerts for continuous monitoring, allowing PSMA to notify you of emerging trade opportunities.
Release Notes:
Line Color and Style Customization: Customizable colors and line styles for entry, stop-loss, and take-profit levels.
Dynamic Trade Tracking: Tracks trade statistics, including total trades, win rate, and average P/L, displayed in the data window for comprehensive trade performance analysis.
Summary: The PSMA indicator is a powerful, user-friendly tool that combines trend detection, pattern recognition, and risk management into a cohesive system for improved trade decision-making. Suitable for stocks, forex, and futures, PSMA offers a unique blend of adaptability and precision, making it valuable for day traders and long-term investors alike. Enjoy this tool as it enhances your ability to execute timely, well-informed trades on TradingView.
Premium Signals [BRTLab]Overview
BRTLab Premium Signals is a versatile and comprehensive tool designed for trading across various assets and timeframes, including cryptocurrencies, stocks, and forex. One of its standout features is a dynamic dashboard that provides real-time signal updates from the selected timeframes in the settings. The dashboard displays only relevant signals from the chosen timeframes, ensuring that traders have the most accurate and timely information without clutter. If a lower timeframe is selected in the settings but is smaller than the current chart timeframe, signals from those lower timeframes will be ignored, maintaining focus on higher-priority data.
The indicator is especially useful for traders who work with moving averages (MA), pivot points (PP), and other strategies, offering high-precision signals that simplify decision-making. Based on practical experience, stop-losses are often placed near structural highs/lows, while take-profits can be set for short-term gains (1-1.3%). However, additional tools within the indicator allow traders to capture larger moves when possible. MA signals help traders ride long-term trends, while ADX and candlestick signals are ideal for shorter, faster trades. Notably, ADX signals from the daily timeframe often point to significant market moves.
💡Features
Comprehensive Dashboard with Signal Integration:
The dashboard is the central feature of this indicator, displaying key signals from various timeframes that the user selects. All signals are integrated into the dashboard, enabling traders to perform a comprehensive analysis based on multiple technical analysis aspects. This consolidated view of market conditions helps traders quickly assess trading opportunities across various indicators. By filtering and displaying only the most relevant signals based on timeframe settings, the dashboard acts as a strategic decision-making tool that simplifies trade monitoring and execution.
Customizable Signal Selection:
Traders can select specific signals to display on the dashboard, allowing for complete customization based on individual trading strategies. This flexibility helps filter out unnecessary market noise, keeping the focus on the signals most aligned with the trader's goals and market conditions.
Signal Logic Overview:
ADX
The ADX-based signals reflect the strength of market trends. Bullish or bearish signals are generated when directional indicators (+DI or -DI) show increasing strength relative to one another, indicating the start or continuation of a strong trend.
RSX
These signals focus on divergences within RSI, identifying potential reversals by detecting either classic or hidden divergences when the market is overbought or oversold.
V9
Signals are generated when the price interacts with a dynamic threshold, indicating trend continuation or reversal. Additional filters can be applied to refine these signals further, enhancing the dashboard's overall effectiveness.
CAND
Candlestick-based signals are triggered by key patterns such as bullish or bearish engulfing formations. These signals are cross-checked with other conditions, such as RSI levels and candle stability, making them especially useful for short-term trading.
PP (Pivot Points)
Pivot Point signals reinforce candlestick patterns by aligning with key support or resistance levels, suggesting potential reversals or continuation opportunities at significant price points.
MA (Moving Average)
MA signals help identify trends by analyzing price action relative to a moving average. Optional filters like ADX add an additional layer of validation, ensuring only high-confidence signals are displayed on the dashboard.
LVL (Levels)
These signals are based on shifts in RSI and help traders spot potential breakouts or reversals. The dashboard integrates these signals alongside MA and ADX filters to enhance their accuracy.
⚠️ RISK DISCLAIMER
Trading involves significant risk, and most day traders experience losses. All content, tools, scripts, articles, and educational materials provided by BRTLab are solely for informational and educational purposes. Past performance does not guarantee future results.
⚡Conclusion
This indicator, with its highly customizable dashboard and advanced signal logic, offers a powerful all-in-one solution for traders across different markets and timeframes. The integration of multiple signal types into the dashboard allows traders to make well-informed decisions with minimal effort, enhancing both precision and confidence in trade execution. Its flexibility and ease of use make it an essential tool for traders looking to streamline their analysis and improve their trading outcomes.

Trend_Prime_MasterTrend_Prime_Master is a trend-following indicator designed to help traders identify potential buy and sell signals with enhanced clarity and reliability. This indicator integrates multiple technical analysis tools into a cohesive system, maximizing their individual strengths to offer traders a comprehensive view of market trends. With its advanced blend of market structure analysis, multiple EMAs, custom volume and momentum indicators, and multi-timeframe trend confirmation, Trend_Prime_Master is tailored to navigate the complexities of financial markets.
Core Features
Trend_Prime_Master offers a suite of features that provide in-depth analysis and actionable insights into market trends:
Multi-Timeframe Trend Analysis: This feature ensures that the signals you act on are aligned with broader market trends by filtering and confirming them across various timeframes. By aligning your trades with the larger market direction, you improve the overall consistency of your trading decisions.
Sophisticated Signal Generation: Signals are generated based on a confluence of technical conditions, including Exponential Moving Average (EMA) crossovers and custom momentum indicators. This multi-layered approach helps focus on signals that have strong backing from market conditions, thereby increasing the reliability of trading decisions.
Color-Changing Trend Line: The trend line changes color based on the market's current direction, providing a quick visual cue for traders. Green indicates a bullish trend, while red signals a bearish trend. This feature simplifies the process of identifying trends, allowing traders to make informed decisions at a glance.
Adaptive Lines: The adaptive lines in Trend_Prime_Master adjust dynamically based on market conditions. These lines provide a more responsive view of the trend compared to static moving averages, particularly useful in volatile markets.
Short Trend Lines: In addition to the main trend line, Trend_Prime_Master includes short trend lines that focus on immediate market movements. These lines are based on shorter EMAs and offer additional layers of trend confirmation, particularly in fast-moving markets.
Custom Volume and Momentum Indicators: These advanced tools validate the strength of trends by assessing the underlying market pressure and the speed of price movements, ensuring that signals are supported by substantial market activity.
Heikin Ashi Integration: Heikin Ashi candles are used to smooth out price data, reducing noise and providing a clearer view of the underlying trend. This integration enhances the clarity and reliability of the signals, making it easier to follow the trend and make informed decisions.
CHoCH (Change of Character): CHoCH is a critical component in understanding market structure changes. It occurs when the market shows a significant shift in behavior, such as moving from a trending phase to a consolidation phase, or vice versa. Trend_Prime_Master automatically detects and labels CHoCH on the chart, helping traders anticipate potential reversals or shifts in market momentum.
Detailed Component Explanations
Every component in Trend_Prime_Master has been carefully selected and integrated to enhance the overall performance of the indicator. Here’s a detailed explanation of how these components work together:
EMA Combinations for Trend Identification: Trend_Prime_Master utilizes multiple EMAs with different periods to capture both short-term and long-term trends. By analyzing the relationship between faster and slower EMAs, the indicator identifies potential trend reversals and continuations. The combination of multiple EMAs helps in smoothing out price data, reducing noise, and providing a more accurate depiction of the trend.
Adaptive Lines: The adaptive lines in Trend_Prime_Master adjust dynamically based on changing market conditions. Unlike static moving averages, which use a fixed calculation period, adaptive lines recalibrate themselves to respond more effectively to shifts in market momentum. This allows traders to capture emerging trends more quickly and avoid the lag associated with traditional moving averages.
Short Trend Lines: Short trend lines are calculated using faster EMAs and are designed to highlight immediate market trends. These lines are particularly useful for traders who focus on short-term market movements, providing early indications of potential trend reversals or continuations. By combining short trend lines with longer EMAs, Trend_Prime_Master offers a multi-layered approach to trend analysis, ensuring that both short-term and long-term perspectives are considered.
Point of Control (POC):
The Point of Control (POC) is a key concept in volume profile analysis that represents the price level with the highest traded volume over a specific period. In Trend_Prime_Master, the POC line is automatically calculated and plotted on the chart. This level is crucial because it often acts as a significant support or resistance level, where price tends to gravitate towards or bounce off. By incorporating the POC, Trend_Prime_Master enhances your ability to identify critical price levels that are likely to influence future price movements.
The POC works synergistically with other components like EMAs and custom momentum indicators by confirming whether these technical signals align with high-volume price levels. For instance, a buy signal near the POC might suggest a strong support level, making the trade more likely to succeed, while a sell signal below the POC could indicate a potential breakout or continuation of a downtrend.
Break of Structure (BOS): BOS is a crucial concept in market structure analysis that indicates a significant change in market behavior. It occurs when the market breaks a previous high or low, suggesting a potential reversal or continuation of the trend. In Trend_Prime_Master, BOS is used to identify these critical moments, helping traders anticipate major market moves. BOS works in conjunction with other signals, such as EMA crossovers and trend line changes, to provide a comprehensive picture of the market's direction.
CHoCH (Change of Character): CHoCH refers to a sudden and significant shift in market behavior, often signaling a change from a trending market to a ranging one, or vice versa. This concept is crucial for traders who need to adjust their strategies based on the market’s current phase. Trend_Prime_Master automatically detects CHoCH moments and marks them on the chart, allowing traders to adapt their strategies promptly and effectively.
Custom Volume and Momentum Indicators: These custom indicators in Trend_Prime_Master go beyond standard tools by incorporating advanced calculations that consider both the direction and intensity of market moves. These indicators help validate the strength of a trend, ensuring that traders act on signals backed by strong market activity. This allows for a more nuanced view of trend strength, supporting better trading decisions.
Color-Changing Trend Line: This visual tool is not just a simple trend line; it dynamically adjusts its color based on the current trend direction, providing an immediate visual representation of the market’s state. When combined with other components like BOS and custom volume indicators, the color-changing trend line helps traders quickly assess whether the current market conditions favor a particular trade, reducing the cognitive load on traders and enabling faster decision-making.
Multi-Timeframe Filters: These filters ensure that the signals generated on a lower timeframe are consistent with the trends observed on higher timeframes. A signal is only considered valid if it aligns across these multiple timeframes, ensuring that your trades are supported by the broader market context.
Heikin Ashi Smoothing: Heikin Ashi candles are incorporated into Trend_Prime_Master to smooth out noise in price data. These candles average out price movements, making it easier to identify the underlying trend without being distracted by minor fluctuations. This smoothing effect is particularly useful in volatile markets, where traditional candlesticks might present a confusing picture of market behavior.
How It Works
Trend_Prime_Master integrates these tools into a cohesive system designed to provide clear and actionable insights into market trends:
EMA-Based Trend Identification: By analyzing multiple EMAs, Trend_Prime_Master identifies the prevailing market trend and potential reversals. This process involves comparing the positions of faster and slower EMAs to detect crossovers, which are key signals for trend changes.
Adaptive Lines: These lines adjust in real-time to reflect the current market conditions. They offer a more responsive trend-following approach compared to traditional moving averages, making them particularly useful in volatile or rapidly changing markets.
Short Trend Lines: These lines focus on short-term market trends, providing early signals of potential reversals or continuations. By tracking immediate price movements, short trend lines help traders respond quickly to market changes, offering a valuable perspective in fast-moving markets.
Point of Control (POC):The POC represents the price level with the highest traded volume over a specific period. In Trend_Prime_Master, the POC is plotted to help traders identify key levels where the market has shown significant interest. These levels often act as strong support or resistance and can be crucial in determining the validity of a trend. For instance, a signal near the POC might indicate a more reliable setup, as it shows that the price is aligning with a major volume level.
Break of Structure (BOS): BOS plays a pivotal role in confirming trend reversals. When the price breaks a significant structure, such as a previous high or low, it suggests that the market may be shifting direction. This is particularly important for traders looking to enter the market at the beginning of a new trend.
CHoCH (Change of Character): CHoCH is critical for recognizing shifts in market phases. For example, a CHoCH might indicate that a market is moving from a trend into a consolidation phase, or vice versa. By identifying these changes early, Trend_Prime_Master allows traders to adjust their strategies accordingly, whether that means tightening stop-losses in a trending market or preparing for breakout trades in a consolidating one.
Custom Volume and Momentum Confirmation: These custom indicators add an extra layer of validation to the signals generated by Trend_Prime_Master. By confirming that there is strong market participation and momentum behind a move, these indicators help ensure that traders are acting on signals supported by robust market activity.
Color-Changing Trend Line: This feature provides an easy-to-understand visual representation of the market's direction, changing color based on whether the market is in a bullish or bearish phase. It works in tandem with other components like EMAs and custom volume indicators to give traders a quick, comprehensive view of market conditions.
Settings
• Trading Style: Select the trading style that best suits your strategy (Short, Medium, Long, HTSpecial, Standard). This setting adjusts the parameters of the EMAs and other components to align with different timeframes, ensuring that the indicator is tuned to the specific market conditions you're trading in.
• Show Possible Signals: Toggle this setting to enable or disable the display of possible buy and sell signals. This allows traders to focus on confirmed signals or to see potential opportunities as they develop.
• Possible Signals Filter: If you wish to filter possible signals based on a higher timeframe trend, enable this option and select the appropriate higher timeframe. This helps ensure that the signals you act upon are in sync with broader market trends, reducing the risk of counter-trend trades.
Colors for Signals and Moving Averages:
• Customize the colors for bullish, bearish, and neutral signals, as well as for the various moving averages. This allows traders to personalize the visual aspects of the indicator, making it easier to interpret signals at a glance.
Trend Line Settings:
• Adaptive Line: Toggle to enable or disable the adaptive trend line, which adjusts dynamically based on market conditions. The line changes color to reflect the current trend direction, providing a quick visual cue.
• Short Trend Lines: Enable this option to display shorter-term trend lines. These lines help in identifying immediate market movements and can be particularly useful for short-term traders.
• Length and Smoothing: Adjust the length and smoothing parameters for the trend lines to fine-tune how responsive they are to price changes.
Point of Control (POC) Settings:
• Show POC Line: Toggle this setting to display the POC on your chart. The POC is a critical level where the most volume has been traded, and it often acts as a significant support or resistance level.
• POC Color and Width: Customize the color and width of the POC line to make it stand out or blend in with your other chart elements, depending on your preference.
Why It's Worth Paying For
Trend_Prime_Master provides several unique advantages that make it a valuable tool for traders:
Comprehensive Market Analysis: By integrating multiple technical analysis tools, Trend_Prime_Master provides a holistic view of market trends, helping you make more informed decisions.
Customization and Flexibility: The indicator’s settings can be easily adjusted to suit your trading style, whether you’re focusing on short-term trades or long-term investments.
Reliable Signal Generation: The multi-layered approach—combining EMAs, custom volume indicators, and trend lines—minimizes the likelihood of weak signals, enhancing your trading process.
Advanced Features: Features like multi-timeframe analysis, Heikin Ashi smoothing, and the color-changing trend line provide insights that are not typically found in other indicators, giving you a trading edge.
Enhanced Market Understanding: The ability to detect and act on changes in trend strength and momentum helps you develop a deeper understanding of market dynamics.
Consistency Across Markets: Trend_Prime_Master is designed to perform reliably across various market conditions, making it a versatile tool in any trading environment.
User-Friendly Interface: Despite its advanced capabilities, the indicator is easy to use, making it accessible to traders of all experience levels.
Ongoing Support and Updates: As a user of Trend_Prime_Master, you receive ongoing support and regular updates to keep the indicator effective and up-to-date with the latest market trends and techniques.
Risk Disclaimer
While Trend_Prime_Master is designed to deliver robust trading signals, it’s important to maintain realistic expectations:
Performance: The indicator is based on solid technical analysis principles, but it cannot predict the future or guarantee success. It should be used as part of a comprehensive trading strategy that includes effective risk management.
Signal Reliability: The signals generated are based on historical data and trends. While they are designed to be consistent with market conditions, they cannot guarantee future outcomes. Always be prepared for unexpected market changes.
Market Conditions: Trend_Prime_Master excels in trending markets but, like any tool, its effectiveness may vary in choppy or highly volatile conditions. Adjusting the settings and strategy according to the market environment is recommended.
How to Get Access
To gain access to Trend_Prime_Master, please send me a direct message on TradingView or use the provided link to request access. Ensure that access requests are made privately so the comments section can remain focused on discussions related to the script’s performance and use.

[FXAN] 71 Cygni Algorithm (Scalping)⚜️ FXAN CYGNI INDICATORS ORIGINALITY
Originality comes from proprietary formula we use to measure the relationship between Volume and Price Volatility in relation to overall current market positioning in developing Volume Profile and multiple custom period Volume Profiles. We combine that with our own approach to measure price velocity in correlation to average daily/weekly/monthly ranges of the given market.
The relationship between current volume and price volatility gives us information about how much the volume that is currently coming into the market affects the price movement (volatility) and which side is more dominant/involved in the market (Buyers/Sellers). We call this the "Volume Impact" factor.
This information is then compared in relation to the overall current market positioning in developing Volume Profile and Multiple custom period Volume Profiles. We have created a rating system based on current price positioning in relation to the Volume Profile. Volume profile consists of different volume nodes, high volume nodes where we consider market interest to be high (a lot of transactions - High Volume) and low volume nodes where we consider market interest to be low (not a lot of transactions - Low Volume). We call this the current "Market Interest" factor.
We combine this information with our own approach to measure price velocity in correlation to the higher-timeframe price ranges. Calculation is done by measuring current ranges of market movement in correlation to average daily/weekly/monthly ranges. We call this "Price Velocity" factor.
This approach was applied to develop key components of our Tradingview Indicators, we've simplified some of the calculations and made them easy to use by programming them to display buying/selling volume pressure with colors.
In addition to our own proprietary formulas and criterias to measure volume impact on price, we've also used an array of indicators that measure the percentage change in volume over custom specified periods of time, including custom period ranged Volume Profile, Developing VA, Accumulation/Distribution (A/D Line), Volume Rate of Change (VROC), Volume Price Trend (VPT) - all of them with of course fine-tuned settings to fit the purpose in the overall calculation.
Reasons for multiple indicator use:
Custom period ranged Volume Profiles: To determine current interest of market participants. Used for "Market Interest"
Developing VA: To determine current fair price of the market (value area). Used for "Market Interest".
Accumulation/Distribution (A/D Line): Helping to gauge the strength of buying and selling pressure. Used for "Volume Impact"
Volume Rate of Change (VROC): To give us information about percentage change in volume. Used for "Volume Impact"
Volume Price Trend (VPT): To help identify potential trends. Used for "Volume Impact".
Average True Range (ATR): Used for measuring volatility. Used for "Volume Impact" and "Price Velocity".
Average Daily Range (ADR): Used for measuring average market price movement. Used for "Price Velocity".
How it all works together:
"Volume Impact" factor tells us the influence of incoming market volume on price movement. This information alongside the overall market positioning information derived from "Market Interest" factor combined with information about speed and direction relative to higher-timeframe price ranges frin "Price Velocity.
This is the basis of our proprietary developed Volume Dynamics analysis approach
"Volume Impact" x "Market Interest" x "Price Velocity"
Combining this factors together gives a good overall understanding of which side is currently more involved in the market to gauge the direction ("Volume Impact"), where the market is currently positioned to gauge the context ("Market Interest") and what the current market's momentum to improve the timing of our trades ("Price Velocity"). This increases our probabilities for successful trades, executed with good timing.
To simplify - our indicators will always analyze the volume behind every price movement and rate those movements based on the relationship between movement distance and volume behind it through an array of criterias and rate them.
Colors displayed by the indicators will be a result of that, suggesting which side of the market (Buyers or sellers) is currently more involved in the market, aiming to increase the probabilities for profitable trades. With the help of our indicators you have deep volume analysis behind price movements done without looking at anything else then indicator components.
🔷 OVERVIEW
Cygni 71 Algorithm is a TradingView indicator designed for short-term trading (scalping) and enhancing the precision of your entries/exits based on a higher timeframe market context. It analyzes the underlying volume behind market movements and colors the candles with the help of the Heiken-Ashi methodology to provide a clearer perspective on the market's potential direction and intentions.
🔷 KEY FEATURES
▊ Candle Coloring
▊ Upper Colored Bar
▊ Lower Colored Bar
🔷 HOW DOES IT WORK?
□ Candles will color in reference to the Heiken ashi "average bar" methodology, which uses a modified formula based on two-period averages. This way, you can observe the normal candlesticks with less noise as colors will suggest the most likely direction where the market might be heading.
□ Upper Colored Bar analyzes daily volume dynamics in the market's price action by referencing the daily average price weighted by volume. If the market is bullish, you’ll see the green bars, and if the market is bearish, the bars will color red.
□ Lower Colored Bar analyzes volume dynamics and the market's price action every few second and minute intervals by referencing average price weighted by volume. This makes it much more sensitive than the Upper Colored Bar. If the market is bullish, you’ll see the green bars, and if the market is bearish, the bars will color red.
🔷 HOW TO USE IT?
□ In general, we look for areas where all components are in sync. These are valid trading signals (refer to the usage example below).
□ If all components are not in sync, we should look for at least two of them to be in sync while one of them must be Upper Colored Bar.
□ Candle Colors: Looking for longs when the candles are green and looking for shorts when the colors are red
□ Upper Colored Bar: The most important component of this indicator is that we favor trading in the direction suggested by this component. Additional confirmation of other components is a bonus. The green color suggests a bullish market, trading long. Red color suggests bearish market, trading short.
□ Lower Colored Bar: This should not be used on its own but always combined with at least one of the other components due to its sensitivity. Colors are indicating longs when green and shorts when red.
🔷 COMBINING THE COMPONENTS
Each component of the indicator serves it's own purpose and analyzes the market from it's own perspective and with its own custom settings and formulas. The calculation of the individual component is done independently from other components. Once all of them align, we're able to execute trades with an edge as it signals that different aspects of volume and price analysis line up for the trading opportunity.
- Candle Colors are used for improving the timing of your entries/exits based on market structure
- Upper Colored Bar is used for determining the favorable direction of the market based on Daily Volume Dynamics.
- Lower Colored Bar used for determining the favorable direction of the market based on Second/Minute/3-minute Volume Dynamics.
It's important to combine the components to increase the probability of success - here's how you should look for a trade:
1. Assess the current most favorable market direction by referencing the Upper Colored bar, look for longs if it’s green and for shorts if it’s red
2. Look for the Candle Colors to align with the Upper Colored bar, look for longs if it’s green and for shorts if it’s red
3. Look for short-time frame volume dynamics to align with your entries, by referencing the Lower Colored Bar - look for longs if it’s green and for shorts if it’s red.
A valid example of the trade would be:
- Upper Colored Bar is green, indicating the favorable trading directions is long
- Lower Colored Bar is green, indicating the favorable trading directions is long
- Candle Colors are green, indicating the market structure is favorable to enter your positions
📊 USAGE EXAMPLE

OHLC Statistical Mapping [Pro+] (Joshuuu)Description:
Dive into the intricate world of candlestick analysis with the OHLC Statistical Mapping Pro+! This collaboration with Joshuuu offers a closer look into the historical data of specific candles within an analyst’s chosen timeframe, providing insights for future time and price delivery. Incorporate this interactive tool into your Tradingview templates and revolutionize your strategies with data. This advanced indicator goes beyond conventional OHLC representation, incorporating the principles of Inner Circle Trader (ICT) to explore accumulation, manipulation, and distribution candle-by-candle.
ICT traders identify manipulation as the wick opposing to the candle’s close. Analysts can observe manipulation legs seen as a movement to trap market participants in the "wrong" direction, to anticipate a candle's distribution.
When price distributes, it expands for higher or lower prices. Analysts can therefore note distribution levels for a draw on liquidity, retracement, or reversal.
These levels will provide important information about orderflow when price trades through them and the sequence in which the delivery occurs.
Additionally, to amplify the price mapping, this tool plots the average Time at which its manipulation and distribution phases should complete. This feature allows traders to utilize historical Timings in conjunction with the price levels of manipulation and distribution.
As with any historical data driven tool, analysts should not expect past behaviour to match future performance. This tool was created with a data driven edge to bring attention to when candles are likely to turn after their manipulations, or retrace after completing set distributions.
Key Features:
Average Range Precision: Visualize candlestick data through a sophisticated line and label-based format, facilitating the identification of your manipulation, distribution, and time pivots. Enhance your comprehension of market volatility by graphing the average range of your selected candle timeframe. This metric acts as a compass, steering you towards potential support and resistance areas.
Tailored Timeframe Selection: Tailor your analysis by choosing a specific time frame that aligns with your trading strategy, enabling a focused exploration of the candle’s manipulation, distribution, and time in which both levels are hit.
Real-time Information Flow: Monitor market developments with instantaneous updates on candlestick statistics. Each candle updates the script with latest OHLC information providing continuous historical data computations, even on timeframes sub 1 minute.
Historical Mapping:
Easily backtest previous mappings by enabling the historical mapping feature. This feature allows traders to revisit and analyze past market scenarios, offering a valuable tool for refining and validating trading strategies. Choose to show historical labels or remove them, giving ultimate flexibility for journaling.
User-Intuitive Interface: Navigate effortlessly through the tool's interface, designed to accommodate advanced traders with keen passion for data driven precision. Effortlessly customize the display settings to match your preferences, ensuring a seamless and personalized experience.
Usage Guidance:
Add OHLC Statistical Mapping Pro to your Tradingview chart.
Choose up to 5 timeframes for the mapping to plot on your chart, be sure to adjust your style and visual preferences to differentiate the timeframes’ levels.
Observe how calculated manipulation, distributions, and delivery times align together with predetermined analysis.
Leverage this information with other models and insights to create a stronger narrative for your analysis
These tools are available ONLY on the TradingView platform.
Terms and Conditions
Our charting tools are products provided for informational and educational purposes only and do not constitute financial, investment, or trading advice. Our charting tools are not designed to predict market movements or provide specific recommendations. Users should be aware that past performance is not indicative of future results and should not be relied upon for making financial decisions. By using our charting tools, the purchaser agrees that the seller and the creator are not responsible for any decisions made based on the information provided by these charting tools. The purchaser assumes full responsibility and liability for any actions taken and the consequences thereof, including any loss of money or investments that may occur as a result of using these products. Hence, by purchasing these charting tools, the customer accepts and acknowledges that the seller and the creator are not liable nor responsible for any unwanted outcome that arises from the development, the sale, or the use of these products. Finally, the purchaser indemnifies the seller from any and all liability. If the purchaser was invited through the Friends and Family Program, they acknowledge that the provided discount code only applies to the first initial purchase of the Toodegrees Premium Suite subscription. The purchaser is therefore responsible for cancelling – or requesting to cancel – their subscription in the event that they do not wish to continue using the product at full retail price. If the purchaser no longer wishes to use the products, they must unsubscribe from the membership service, if applicable. We hold no reimbursement, refund, or chargeback policy. Once these Terms and Conditions are accepted by the Customer, before purchase, no reimbursements, refunds or chargebacks will be provided under any circumstances.
By continuing to use these charting tools, the user acknowledges and agrees to the Terms and Conditions outlined in this legal disclaimer.
Bezahltes Script

Alert on Candle CloseAlert on Candle Close is a simple indicator allowing you to set alerts when a candlestick closes.
Instructions for use
From the chart window, click on "Indicators" and search for "Alert on Candle Close".
Click on "Alert on Candle Close" to add the indicator to your chart. Click on the star icon to add it to your favourites to easily access later.
Set your chart timeframe to the timeframe you wish to alert on. For example, to create an alert when a 4h candlestick closes, set your chart to the "4h" timeframe.
Hover over the "Alert on Candle Close" indicator which has been added to your chart and click the ellipsis "..." icon, then click "Add alert on Alert on Candle Close" or use the keyboard shortcut "Alt+A" from the chart.
In the alert pop-up window, make sure "Condition" is set to "Alert on Candle Close" and "Trigger" is set to "Once Per Bar".
Optionally, you can set a custom expiry for the alert, give the alert a name and customise the alert message. You can configure notification settings from the "Notifications" tab.
Click "Create" and your alert is set up!
Each alert is tied to the timeframe and chart it was created on, so you can change the timeframe or asset and create more alerts by repeating the above process.
Note : this indicator is only designed to work with time-based chart types, such as Bars, Candles or Heikin Ashi. It will not work for non-time charts such as Renko.
FAQs
Why do my alerts sometimes not fire as soon as the candle closes?
This is a limitation with Pine Script's execution model. Indicators are calculated whenever a price or volume change occurs i.e. when a new trade happens. For illiquid or slow moving markets, there may be some time between when a candle closes and the next trade, leading to a delay in the alert triggering. The alert will trigger on the next tick of data on the chart.
Why can't I create more alerts?
TradingView has a limit on the number of active technical alerts you can have based on your membership tier. To configure more alerts, consider upgrading your TradingView plan to a higher tier. See a comparison of TradingView plans at www.tradingview.com
My alert only fired once, how can I get it to keep working?
When configuring the alert in the alert pop-up window, make sure you set "Trigger" to "Once Per Bar" and "Expiration" to "Open-ended alert".

Trend Pinbar PT49 by CuancuanIdea Behind:
Buying the short-term trend that shows a pin-bar candlestick pattern. Meant to be traded on a daily chart / higher timeframe.
To determine the short-term trend we use short EMA such as 8-16-30 and check the slope of each one, and definitely, the shorter one must be above the longer one for an uptrend. Vice versa for a downtrend.
To determine a pin-bar candlestick, I calculate that the body size (open to close) is at maximum a-third of the candle size (high to low). Besides that, I ensure that the close of the candle is above the shortest MA for bullish and below it for bearish.
As extra filters to reduce trade numbers:
1. Longer MA Filter = You can turn it off if you think the higher timeframe filter is unnecessary.
2. Slope Filter = To ensure the slope of the shorter MA is steeper rather than the mid-MA.
3. Size Filter = To check whether the overall candle size (high to low) is bigger than the ATR number. When the size filter is turned on, it removes small insignificant candles.
PS: Don't trade anything live unless you find it comfortable after backtesting it by yourself .

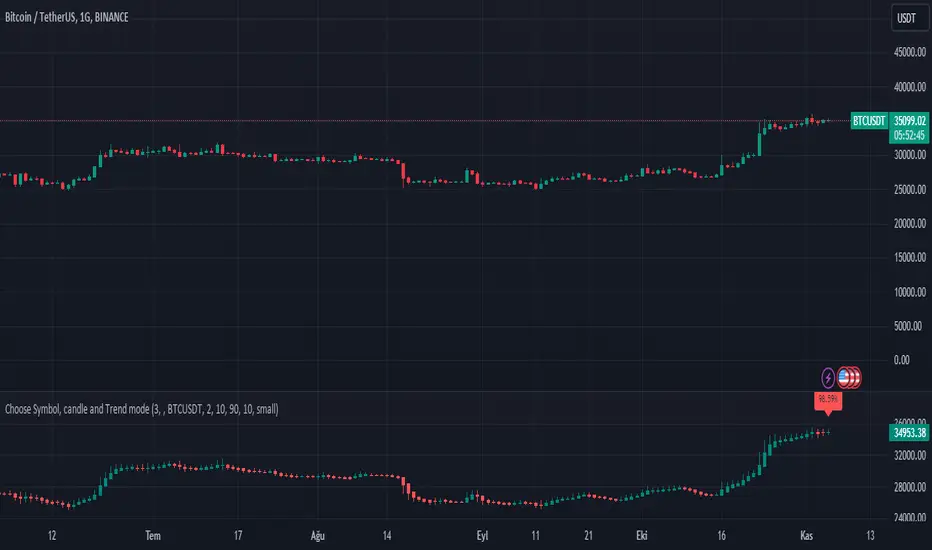
Choose Symbol, candle and Trend modeThis Pine Script code is designed for technical analysis and visualization of price movements on the TradingView platform. It serves as a tool for traders and investors to:
Price Chart Analysis: The code plots the price chart of a selected symbol and utilizes Heikin-Ashi candlesticks to visualize price movements. This aids in better understanding price trends, support and resistance levels, retracements, and other price actions.
Trend Identification: The code also employs the Exponential Moving Average (EMA) to identify the price trend. EMA is commonly used to determine the strength and direction of a trend. Traders and investors can use this information to track trends and develop trading strategies.
Buy and Sell Signals: The code generates buy and sell signals based on EMA. These signals provide information on when to consider buying or selling a specific symbol. This is particularly useful for traders when making trading decisions.
Timeframe Customization: Users can adapt the code to different timeframes. This flexibility is valuable for those looking to develop strategies for both short-term and long-term trading.
Customization: The code allows users to customize various parameters, including the symbol, timeframe, Heikin-Ashi mode, and others. This enables it to be tailored to different assets and trading styles.
Please note that this code is provided for educational and informational purposes only. It does not constitute financial advice or recommendations for specific trading actions. Any trading decisions made using this code should be based on individual research, analysis, and a clear understanding of the associated risks.
Market Manipulation DetectorThe Market Manipulation Detector (MMD) is a technical tool designed to identify potential market manipulation attempts. The detector is based on a combination of heuristic techniques that may indicate intentional, non-fundamental movements in a market, potentially led by large entities or "whales".
Key Components:
Pump and Dump Detection: Identifies abnormal price and volume spikes that are indicative of a classic pump and dump.
Price Gap & Volume Correlation: Pinpoints gaps in price that aren't backed by a significant change in volume, indicating potential manipulative intent.
RSI Divergence with Volume: Captures instances where price action diverges from RSI, but volume does not support the divergence, indicating it might be artificially driven.
Whale Watcher: Watches for volume levels that significantly exceed the average, suggesting potential whale activity.
Heuristics:
Volume Spike: When the current volume exceeds the average volume by a multiplier, it may indicate unusual activity.
Price Spike: Unusually large candlesticks, in terms of price movement, can be indicative of potential manipulation.
Gap Without Volume: If the price jumps significantly without a corresponding rise in volume, it could be a sign of artificial movement.
RSI Bullish/Bearish Divergence: This is when the price moves in one direction (e.g., down) but the RSI moves in the opposite direction (e.g., up), and the volume does not support this divergence.
Whale Volume: When the current volume is exceedingly higher than the average, indicating possible large entity trades.
Visualization:
Dots on the chart: These represent potential manipulation events. Green dots signify bullish manipulation attempts, while red dots signify bearish ones.
Histogram: Offers a quick view of the manipulation score. It plots either 0 (no manipulation detected) or 100 (manipulation detected).
Important Note:
While MMD is a powerful tool, it's essential to remember that no indicator is infallible. The detector identifies patterns that could be indicative of market manipulation, but false positives can occur. Therefore, it's crucial to use this tool in conjunction with other technical indicators, fundamental analysis, and sound risk management strategies.

KeitoFX Dynamic Indicator Free vers.This script represents a versatile dynamic indicator called "KeitoFX Dynamic Indicator Free version." It is developed by the author "KeitoFX" and operates as a custom indicator overlaying on financial charts. The indicator utilizes a unique algorithm to dynamically identify bullish and bearish candlestick patterns with specific criteria.
Key Features:
- The indicator visually marks bullish and bearish candlestick patterns using triangle shapes, providing quick visual cues to traders.
- Bullish patterns are detected when the closing price is higher than the opening price and the high and low prices of the candlestick form a narrow range.
- Bearish patterns are identified when the closing price is lower than the opening price, and the high and low prices also form a narrow range.
The indicator incorporates flexible settings that users can customize to fit their trading preferences:
- Users can choose the table's placement, either at the "Top Right," "Middle Right," or "Bottom Right" of the chart.
- Customizable dimensions for the width and height of the table are available.
- Adjustable text size settings ranging from "Auto" to "Huge" are provided for the displayed text.
- A descriptive table containing trading rules and conditions is optionally displayed below the price chart.
Additional Information:
- The indicator's color scheme is harmonious, with shades of purple and neutral tones.
- The "Require FVG" setting influences the pattern detection's sensitivity.
- A dynamic standard deviation is calculated based on the selected displacement settings and historical candle ranges.
- A "FVG" condition enhances pattern accuracy.
- Bullish and bearish pattern detection includes overlapping with other predefined arrays to increase pattern significance.
Note:
This indicator is provided under the Mozilla Public License 2.0, as indicated by the source code comment at the beginning of the script. Users are encouraged to review and comply with the license terms when using this indicator in their trading activities.

Boring Candles by BitcoinBailyBoring candlestick is a candlestick whose body is less than 50% of its total candlestick range, this candle is usually small in size.
This indicates that the price range between the open and close of this candle was relatively small, and that there was not a lot of volatility during that time period.

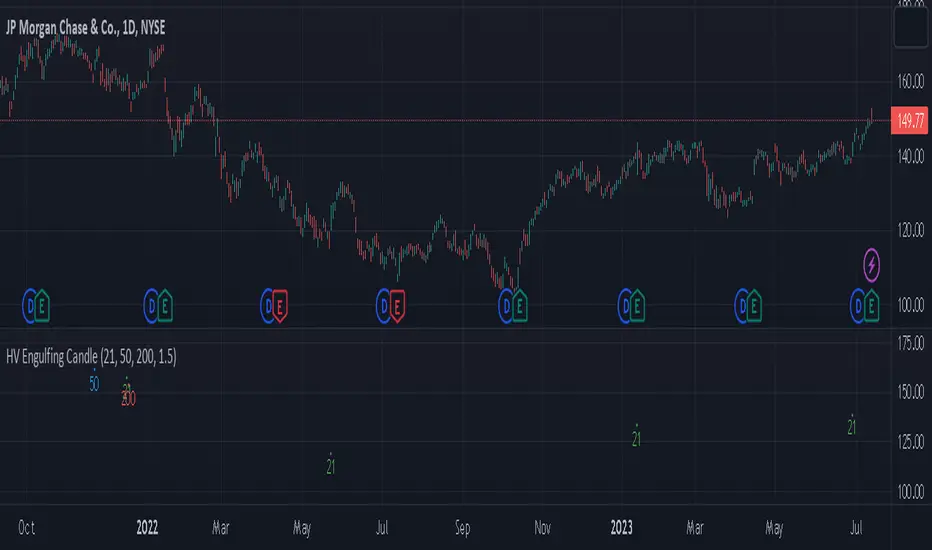
High Volume Engulfing Candle near EMAsThe indicator is designed to identify and signal instances of high volume and engulfing candles near three Exponential Moving Averages (EMAs): the 21EMA, 50EMA, and 200EMA. It can be used in various financial markets such as stocks, forex, commodities, or cryptocurrencies, as long as the market data is available on the TradingView platform.
Here's a breakdown of how the indicator works and its features:
High Volume Detection: The indicator considers a candle to have high volume if its volume is greater than or equal to a specified threshold. The default threshold is set to 1.5 times the 20-period Simple Moving Average (SMA) of the volume. You can adjust the volume_threshold parameter to customize the threshold according to your preferences.
Engulfing Candle Detection: An engulfing candle is identified when the current candle's range engulfs the range of the previous candle. The indicator checks if the current candle is either bullish engulfing (open > close and close > open ) or bearish engulfing (open < close and close < open ). This helps identify significant shifts in market sentiment.
Proximity to EMAs: The indicator checks if the low of the candle is below and the high is above each of the three EMAs (21EMA, 50EMA, and 200EMA). This indicates that the price action is near or interacting with these key moving averages.
When all the following conditions are met, the indicator plots shapes below the candlesticks on the chart to generate signals:
The candle has high volume (volume_threshold).
The candle is an engulfing candle.
The candle's range engulfs the 21EMA, 50EMA, or 200EMA.
The shapes are plotted with different colors and labels to indicate which EMA condition is met. Green shapes represent the 21EMA condition, blue shapes represent the 50EMA condition, and red shapes represent the 200EMA condition.
By using this indicator, traders can potentially identify significant market movements, areas of price interaction with key EMAs, and instances of high volume that may signify strong buying or selling pressure.
ATR VisualizerAdvance Your Market Analysis with the True Range Indicator
The True Range Indicator is a sophisticated screener meticulously developed to bolster your trading execution by presenting an exceptional understanding of the market direction. The centerpiece of this instrument is a distinctive candle configuration depicting the Average True Range (ATR) and the Bear/Bull range. However, it traverses beyond the conventional channels to offer specific market settings to boost your trading decisions.
User-Defined Settings
Broadly, the indicator offers five dynamic settings:
Bear/Bull Range
The Bear/Bull Range outlines the ATR for each candle type - bearish and bullish - and then smartly opts for the pertinent one based on the prevalent market circumstances. This feature aids in comparing the range of bullish and bearish candlesticks, which deepens your understanding of the price action and volatility.
Bearish Range
The Bearish Range isolates and computes the ATR for bearish candles solely. Utilizing this option spots the bear-dominated periods and provides insights about potential market reversals or downward continuations.
Bullish Range
Opposite to the Bearish Range, the Bullish Range setting tabulates the ATR exclusively for bullish candles. It assists in tracking the periods when bulls control, enlightening traders about the possibility of upward continuations or trend reversals.
Average Range
The Average Range provides an unbiased measure of range without prioritizing either bull or bear trends. This model is ideal for traders looking for a holistic interpretation of market behavior, regardless of direction.
Cumulative Average Range
Equally significant is the Cumulative Average Range which calculates the aggregate moving average of the true ranges for an expressed period. This setting is extremely valuable when evaluating the long-term volatility and spotting potential breakouts.
Dual Candle Configuration
Going a step ahead, the True Range Indicator uniquely offers the possibility to incorporate more than one candle estimate on your screen. This ensures simultaneous analysis of multiple market dynamics, thereby enhancing your trading precision multifold.
Concluding Thoughts
In essence, the True Range Indicator is an indispensable companion for traders looking to not only leverage market volatility but also make educated predictions. Equipped with an array of insightful market settings and the ability to display dual candle estimates on-screen, you can customize the functionality to suit your unique trading style and magnify your market performance dramatically.

LNL Scalper ArrowsLNL Scalper Arrows
The indicator consist of various different types of candlestick patterns that are truly time tested by multiple veteran traders. These arrows are a combination of short-term scalping strategies taught by Linda Raschke & a trader that goes by name Quant Trade Edge. These strategies/patterns occur regularly within the markets. They offer high probability quick moves during the trending days. These four patterns are based on pure price action, no oscillators, no trend, no momentum indicators involved. Trend (ema) is there just as a simple trend gauge.
LNL Scalper Arrows were designed specifically for intra-day trading. Mostly useful for the futures but also stocks as well. These arrows can work anywhere between the fast-moving 512 or 1600 tick charts to a 1min, 2min and up to 5min or 10min charts.
Trend Gauge (Exponential Moving Average)
Nothing fancy just a classic EMA that can guide the direction of the short-term trend. I have added a custom coloring of the EMA that is based on a simple RSI filter. That should help to visualize the non-directional moments within the trend. Although the length is adjustable, for scalping it is better to focus on smaller periods such as 9, 13 or 20 or 34 but anything above 50 loses its purpose as a short-term trend gauge. Again, this is a scalping tool not a trend tool, you are not going to get rid of the fakeouts by increasing the period of the trend.
Tail Arrows (Eat the Tail Pattern)
Tail is a candlestick that is either a price rejection spike, or a flag continuation pattern on a lower time frame. A failed action. It is basically a candle with much bigger wick (shadow) of the candle than the actual body. Such candles are usually telling us about strong participation from the other side of the market. Eat the tail pattern occurs whenever the low of the Tail candle is immediately broken on a following candle "the tail is eaten alive". Such a breaks occurs in a most aggressive types of markets with a strong momentum. DO NOT try to trade this in a low volume or a ranging market. Tail Arrows are the most aggressive arrows & should be only used on the highest volume or a parabolic momentum markets.
Scalp Arrows (Scallop Pattern)
Known as Scallops or minor lows or highs, these patterns are the most common within the all scalper arrows. They occur regularly on 1min & 5min charts - basically everyday. Scallops provide the best possible risk to reward entry within the trend without the need of any indicators or oscillators. The Scallop Up 3 bar pattern consist of a high that is lower that the previous high but also low that is lower than the previous low. Scallop Up or a minor low triggers when the last high is broken, creating a three bar mountain or a peak within the 5 bar span.
Hoagie Arrows (Hoagie Pattern)
Hoagies occur way less often than any other scalping patterns. Hoagies represent two (or more) inside candles within the shadow of a first candle. Such a formation is creating a small compression or a range that sooner or later breaks out. The hoagie is triggered whenever the high or low of the shadow (first) candle is broken. The great thing about the hoagies is that they can work either way despite the trend direction. Although this indicator is coded for the 2 bar hoagies, there are no limitations on how much inside bars can hoagie include.
Umbrella Arrows (Umbrella Pattern)
Another really awesome 3 bar pattern that is really fun to trade. Umbrella occurs when the candle before the previous candle is a pin bar or a tail bar and the body of the previous candle is within the shadow or a wick of the candle before. The umbrella is triggered once the high or low of the previous bar is broken. Umbrellas are more frequent than Hoagies but occur much less than the Scallops.
Outside Bar Wedges (Outside Bar Pattern)
Pretty much self-explanatory candlestick pattern. Outside Bar is basically any bar that peaks outside of the both ends of the previous candle. So the range of the candle is higher & it looked beyond the high and beyond the low of the previous candle. These candles are signalizing the potenial momentum change. Ouside Bars usually occur at the tops or bottoms of the moves. I decided to add them because they can serve as a great addition to these scalping patterns.
Signal vs. SignalBreak Mode
The trigger can be viewed in two different ways:
1. Signal: Plots the trigger before the trigger bar, basically right when the pattern is formed but NOT YET triggered. The signal is triggered once the next candle break the high or low of the current candle.
2. SignalBrake: Plots the trigger after the break of the high or low of the actual pattern. It is basically a candle after the signal candle. (Signal is better for trading because it gives you time to prepare for the actual break of the high or low = the actual signal. SignalBrake is great for looking back in history only for the patterns that actually traded).
Pin Bar BTW Ratio
Pin Bar (Body-To-Wick) Ratio represents the size of the body of a pin bar candle for Eat the Tail and Umbrella patterns. Pin Bar BTW Ratio measures the ratio between the wick & the body of the candle. Ref. interval is 2.0 - 5.0 (ideal pin bar is 2.0 - 3.0 = the wick or a shadow is 2x - 3x bigger than the body of the candle)
ATR Stop & Target Labels
I also created three simple labels (tables) that can show you the ideal target & stop as well as the current ATR. Since LNL Scalper Arrows consist of high probability scalping patterns, a good rule of thumb to follow is to use a half of the current ATR as a target and a current ATR as a stop (or two times the target). So if the current 7 period ATR is 30 the target would be 15 pts. and a stop around 30 pts. With such a risk management you should aim for a win rate 70% or higher. Obviously you can adjust the risk management in the settings to your personal preference.
Low Range vs. High Range Markets
There are two major downsides with the Scalper Arrows:
1. You need volume and a volatility. These patterns really do struggle in ranging "boring" sideways action. It is absolutely crucial to recognize the current market environment and really stay cautions and (or completely out) in case the chop continues. Adding something like DMI can help you recognize the potential flat markets.
2. Not only do you need volume & momentum, you also need a decent range. This indicator works better on a rangy market such as NQ futures or YM. But are much tougher to trade on lower range markets such as some stocks or ZB futures or basically any other lower range market.
Hope it helps.
