Piercing Line automatic finding scriptHi
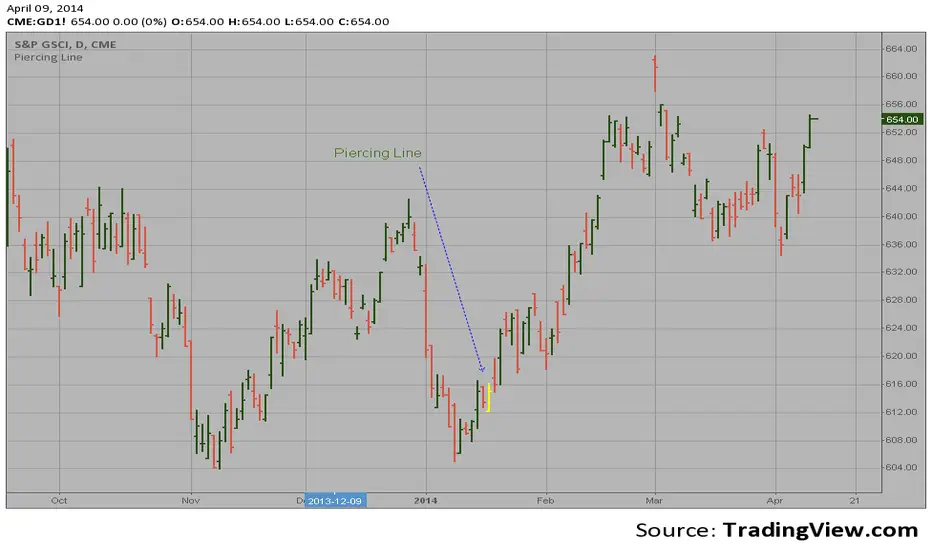
Let me introduce my Piercing Line automatic finding script.
This is a bullish reversal pattern formed by two candlesticks. Following a downtrend,
an up candlestick with a long real body is followed by a lower open on the next
candlestick. This session finishes as an up candlestick and closes above the midpoint
of the prior candlestick's real body. It is the reverse of the Dark Cloud.
In den Scripts nach "Candlestick" suchen
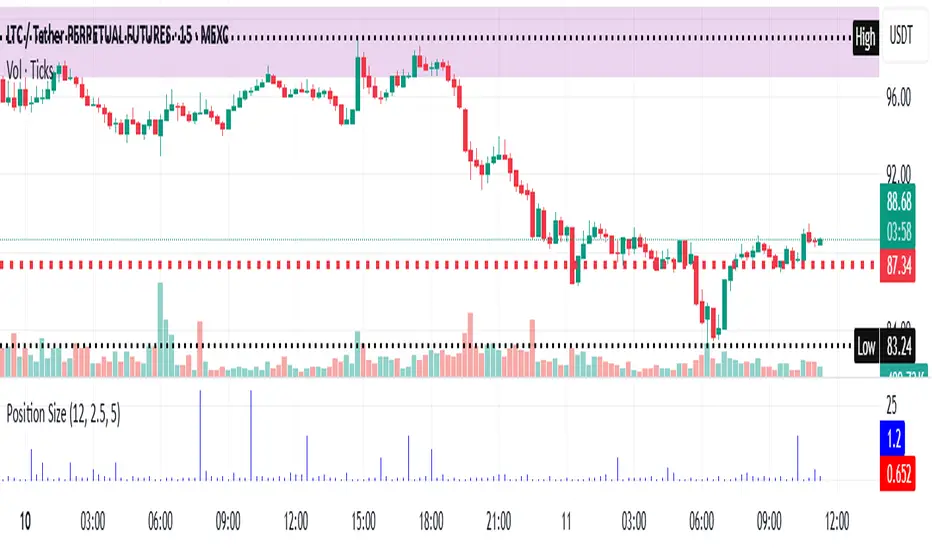
Risk-Based Position Size ProRisk-Based Position Size Indicator
Overview:
The Risk-Based Position Size Indicator helps traders determine the appropriate position size for each trade based on their total capital and risk percentage. This indicator dynamically calculates position size using two different methods:
Wick Range (High - Low): Calculates position size based on the total range of the candlestick.
Candle Body (Close - Open): Calculates position size using only the body of the candlestick, ignoring wicks.
It provides a visual representation of position sizing as a histogram and adjusts dynamically based on price movement.
Key Features:
✅ Two Calculation Modes:
Wick Range (Red Bars) – Uses the entire candlestick range (High - Low).
Candle Body (Blue Bars) – Uses only the difference between Close and Open.
✅ Customizable Risk Settings:
Define Total Capital (default: $100,000).
Set Risk Percentage per trade (default: 1%).
✅ Automatic Position Sizing:
Adjusts position size dynamically for each candlestick.
Prevents division errors when the range is zero.
✅ Rounding Option:
Toggle rounding of position size for better readability.
✅ Clear Visual Representation:
Displayed as a histogram for easy interpretation.
Red bars for Wick Range, Blue bars for Candle Body calculations.
How to Use:
Add the indicator to your TradingView chart.
Set your Total Capital and Risk Percentage in the settings.
Choose a Calculation Method:
Wick Range: Uses High - Low for sizing.
Candle Body: Uses absolute difference of Close - Open.
If desired, enable Round Position Size for easier interpretation.
Observe the histogram bars to see the calculated position size for each candle.
This indicator is useful for risk management, ensuring that position sizes are aligned with account size and market volatility. 🚀
New Features & Fixes:
✅ User can select decimal precision (0 to 5 places) from the settings.
✅ If rounding is enabled, values are rounded based on the chosen precision.
✅ If rounding is disabled, original values are shown without forced rounding.
✅ Wick Range (Red) & Candle Body (Blue) are still plotted together.
Now, you have full control over how many decimal places to display! 🎯
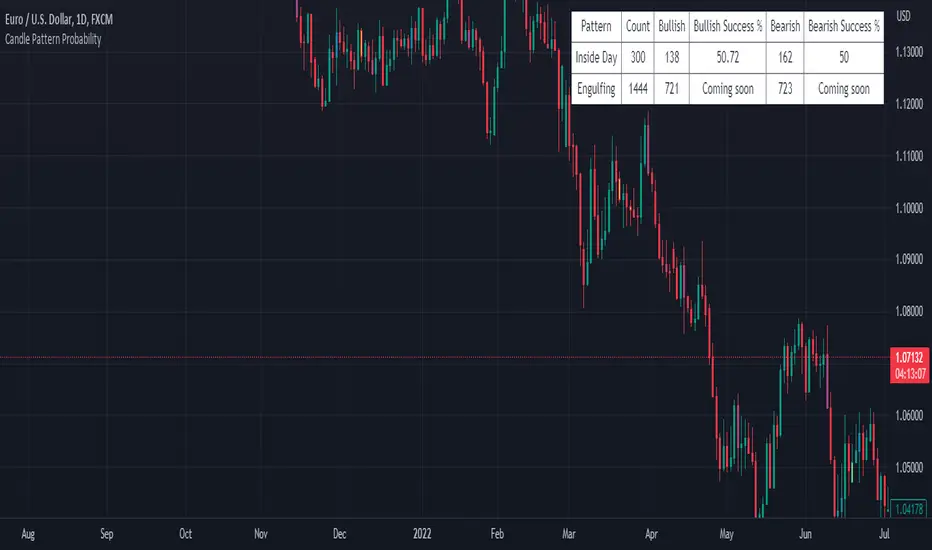
Candle Pattern ProbabilityThe "Candle Pattern Probability" indicator is a technical analysis tool designed specifically for traders who want to assess the probability of success for different candlestick patterns in the financial markets.
Japanese candlesticks, also known as candlesticks, provide valuable information about price action within a specific time period. These candlestick patterns can help identify potential trend reversals as well as signal entry and exit points in the market.
The "Candle Pattern Probability" indicator uses a data-driven approach to calculate the likelihood of a specific candlestick pattern resulting in a successful price movement. It operates on the premise that certain candlestick patterns tend to repeat and have a higher probability of leading to predictable market movements.
The indicator analyzes a wide variety of candlestick patterns such as the hammer, shooting star, bullish/bearish engulfing, doji, hanging man, among others. It employs specific statistics and algorithms to evaluate the frequency and effectiveness of these patterns in the past, thereby estimating the probability of their repetition in the future.
The indicator's output is visually presented as a percentage value or a color scale, facilitating interpretation by traders. The higher the percentage value or the more intensified the color, the greater the estimated probability of success for the analyzed candlestick pattern.
It is important to note that the "Candle Pattern Probability" indicator is a supplementary tool and should not be considered as a definitive signal for trading decisions. It is recommended to use it in conjunction with other technical indicators, fundamental analysis, and a sound understanding of the market before making trades.
Please remember that the analysis of candlestick patterns and the use of this indicator require practice, experience, and trading knowledge. It is always advisable to conduct additional testing and validation before basing decisions solely on the results provided by this indicator.
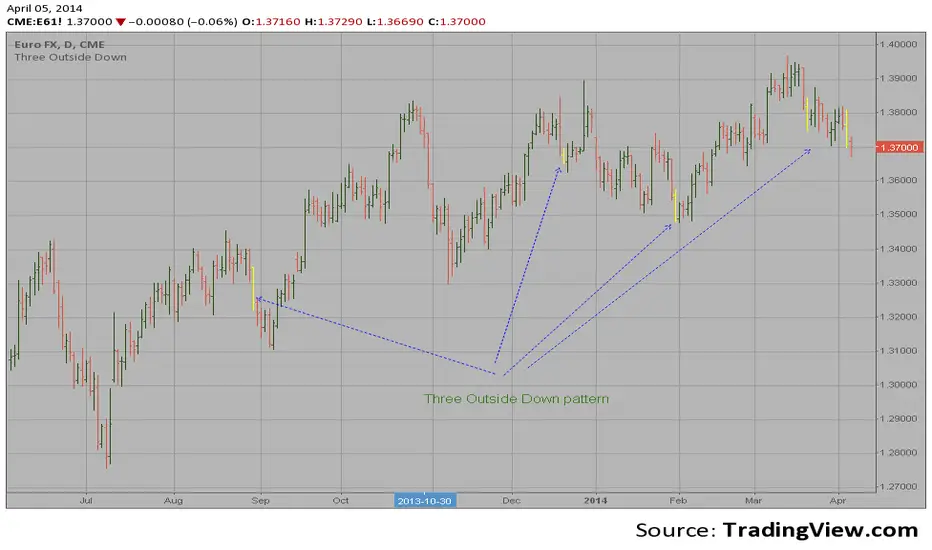
Three Outside Down automatic finding scriptHi
Let me introduce my Three Outside Down automatic finding script.
This is a three candlestick bearish reversal pattern consisting of a bearish
engulfing pattern formed by the first two candlesticks then followed by a down
candlestick with a lower close than the prior candlestick.
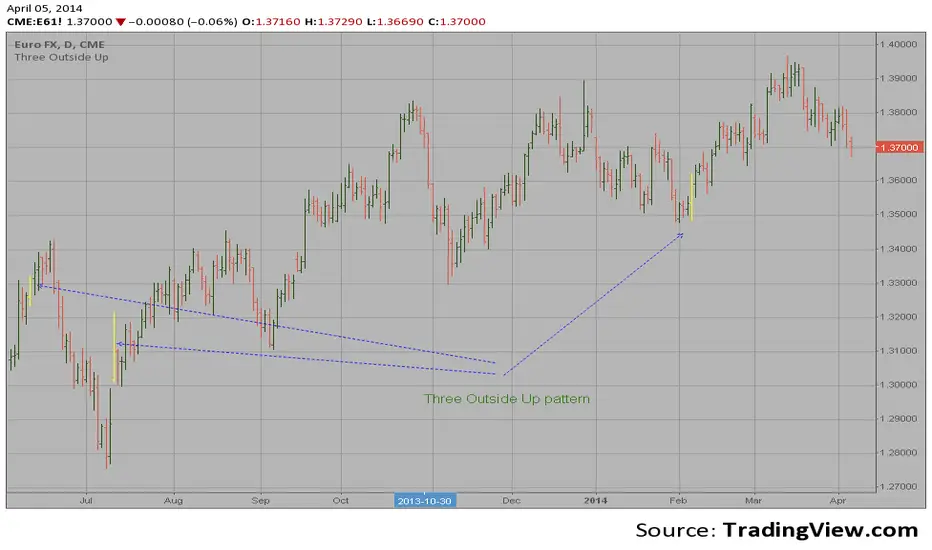
Three Outside Up automatic finding scriptHi
Let me introduce my Three Outside Up automatic finding script.
This is a three candlestick bullish reversal pattern consisting of a bullish
engulfing pattern formed by the first two candlesticks then followed by an up
candlestick with a higher close than the prior candlestick.
Three Inside Down automatic finding scriptHi
Let me introduce my Three Inside Down automatic finding script.
This is a three candlestick bearish reversal pattern consisting of a bearish
harami pattern formed by the first 2 candlesticks then followed by down
candlestick with a lower close than the prior candlestick.
This pattern marked as yellow.

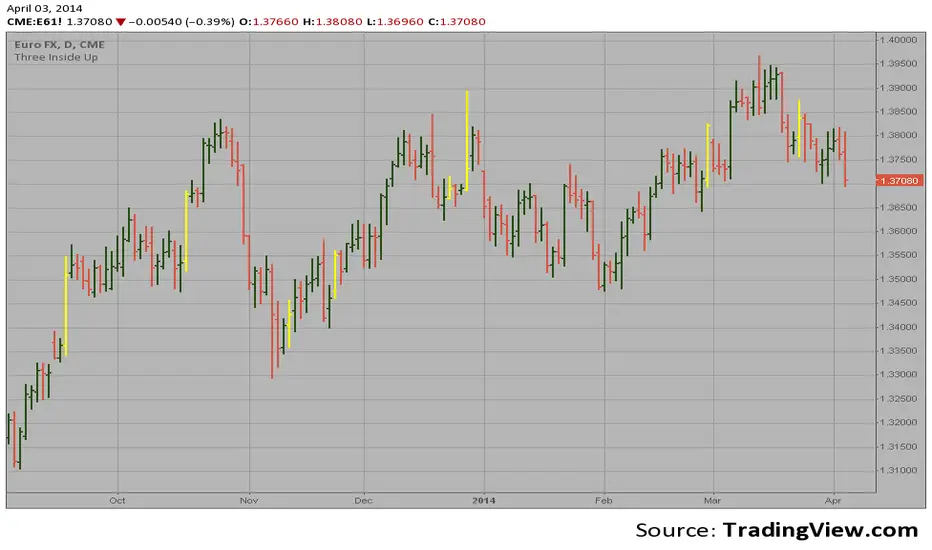
Three Inside Up automatic finding scriptHi
Let me introduce my Three Inside Up automatic finding script.
This is a three candlestick bullish reversal pattern consisting of a
bullish harami pattern formed by the first 2 candlesticks then followed
by up candlestick with a higher close than the prior candlestick.
This pattern marked as yellow.
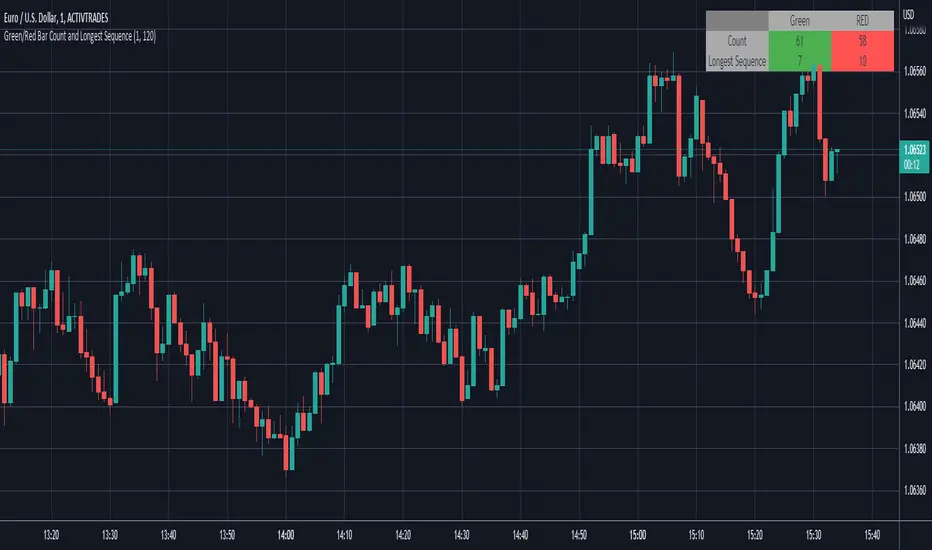
Green/Red Bar Count and Longest SequenceThis script counts the number of green and red candlesticks of a range you determine.
Default is from 1 to 120, which means the latest 120 candlesticks.
It also counts the most extended sequence of greens and reds.
IBS markerIndicator Description
This indicator provides a detailed analysis of the structure and volatility of each candlestick. It is designed to help traders better understand the balance between buying and selling pressure within individual bars, as well as the short-term volatility environment.
📌 Features
Candlestick Structure Analysis
Calculates the relative percentage of the upper wick, lower wick, and real body of each candle.
Helps traders visually and numerically evaluate whether a candle is dominated by bullish, bearish, or indecisive pressure.
IBS (Intraday Bar Strength)
Computes the Intraday Bar Strength value, showing where the close is located relative to the high-low range.
A high IBS indicates strong closing near the high, while a low IBS indicates weakness near the low.
Range Measurements
Displays the candlestick range in both price units and ticks.
Useful for traders who need precise range data for scalping or range-based strategies.
ATR (Average True Range) Volatility Filter
ATR is included with a configurable period setting.
Provides a contextual measure of volatility, helping traders compare current bar size against recent market behavior.
Dynamic Chart Labels
Key values (such as wick percentages, IBS, and range) are displayed directly on the chart through dynamic labels.
This allows for quick interpretation without opening extra panels or indicators.
📈 How to Use
Add the indicator to any chart and configure the settings (ATR period, label visibility, etc.) according to your trading style.
Use wick/body ratios to spot candles with unusual buying/selling pressure.
Combine IBS with ATR to identify potential exhaustion or continuation setups.
The dynamic labels are best used on lower timeframes for scalpers, but they can also provide insights on higher timeframes for swing traders.
🔍 Practical Applications
Identify reversal candles where one wick dominates.
Measure strength of breakouts by comparing candle body % and IBS values.
Detect volatility shifts by monitoring when bar ranges deviate from the ATR baseline.
Support scalping strategies that rely on tick-based range detection.
✅ Notes
This is a standalone indicator and does not require any other script to function.
Works on all markets (stocks, futures, forex, crypto).
For best results, use in conjunction with price action analysis or your preferred trading strategy.

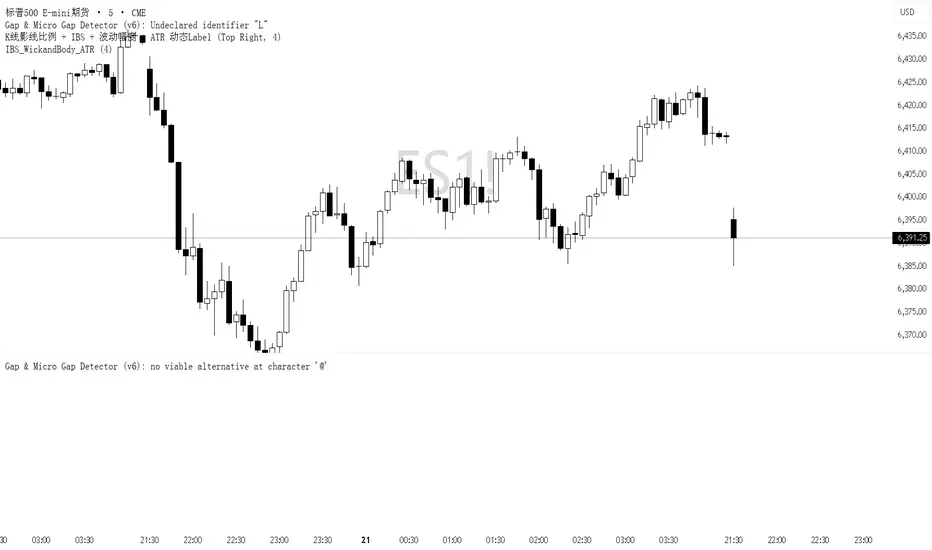
IBS_WickandBody_ATRIndicator Description
This indicator provides a detailed analysis of the structure and volatility of each candlestick. It is designed to help traders better understand the balance between buying and selling pressure within individual bars, as well as the short-term volatility environment.
📌 Features
Candlestick Structure Analysis
Calculates the relative percentage of the upper wick, lower wick, and real body of each candle.
Helps traders visually and numerically evaluate whether a candle is dominated by bullish, bearish, or indecisive pressure.
IBS (Intraday Bar Strength)
Computes the Intraday Bar Strength value, showing where the close is located relative to the high-low range.
A high IBS indicates strong closing near the high, while a low IBS indicates weakness near the low.
Range Measurements
Displays the candlestick range in both price units and ticks.
Useful for traders who need precise range data for scalping or range-based strategies.
ATR (Average True Range) Volatility Filter
ATR is included with a configurable period setting.
Provides a contextual measure of volatility, helping traders compare current bar size against recent market behavior.
Dynamic Chart Labels
Key values (such as wick percentages, IBS, and range) are displayed directly on the chart through dynamic labels.
This allows for quick interpretation without opening extra panels or indicators.
📈 How to Use
Add the indicator to any chart and configure the settings (ATR period, label visibility, etc.) according to your trading style.
Use wick/body ratios to spot candles with unusual buying/selling pressure.
Combine IBS with ATR to identify potential exhaustion or continuation setups.
The dynamic labels are best used on lower timeframes for scalpers, but they can also provide insights on higher timeframes for swing traders.
🔍 Practical Applications
Identify reversal candles where one wick dominates.
Measure strength of breakouts by comparing candle body % and IBS values.
Detect volatility shifts by monitoring when bar ranges deviate from the ATR baseline.
Support scalping strategies that rely on tick-based range detection.
✅ Notes
This is a standalone indicator and does not require any other script to function.
Works on all markets (stocks, futures, forex, crypto).
For best results, use in conjunction with price action analysis or your preferred trading strategy.
Wick to Candle Ratio with Multiple ColorsThe display in question likely provides visual representations or data related to the concept of the dot-based wick-to-body ratio. This ratio is a term often used in financial markets, particularly in the context of candlestick charts.
In candlestick charts, each candlestick represents a specific time period (such as a minute, hour, day, etc.) and provides four pieces of price data: the opening price, closing price, highest price, and lowest price of an asset within that timeframe. The "body" of the candlestick is the area between the opening and closing prices, while the "wicks" (or shadows) are the lines extending from the body, representing the highest and lowest prices during the period.
The dot-based wick-to-body ratio refers to a method of quantifying the relative lengths of the wicks compared to the body using dots or points. In this context, a display illustrating this ratio might show different candlesticks with highlighted dots representing the ratio between the length of the wick and the body. A higher ratio could indicate more volatility in price movements during that timeframe, while a lower ratio might suggest comparatively stable price action.

CRT TBSThe CRT Candle Marker is a custom indicator designed to identify and highlight specific candlestick patterns on a chart. This indicator focuses on detecting candles where the body of the candlestick is larger than the combined size of its wicks (upper and lower). Such candles often indicate strong momentum in the market, making them valuable for traders who rely on price action analysis.
Features
Automatic Detection: The indicator automatically scans all candlesticks on the chart to identify CRT candles.
Visual Marking: Once a CRT candle is detected, it places a label with the text "CRT" above the candlestick for easy identification.
Customizable Design: The label is styled with a blue background and white text, ensuring it stands out clearly on the chart.
Use Case
The CRT Candle Marker is particularly useful for traders who:
Want to identify strong momentum candles that could signal potential trend continuation or reversal points.
Rely on price action strategies and need visual cues to spot significant patterns quickly.
Analyze candlestick behavior to confirm entry or exit points in their trading strategies.
How to Use
Copy the Pine Script code and paste it into the Pine Editor in TradingView.
Click Add to Chart to apply the indicator.
Look for candles marked with the "CRT" label to identify strong momentum candles.
Example Scenario
Imagine you're analyzing a chart and looking for strong bullish momentum. With the CRT Candle Marker, you can easily spot candles where the buyers dominated the session, as indicated by a large body relative to the wicks. Similarly, bearish CRT candles could indicate strong selling pressure.
Conclusion
The CRT Candle Marker is a simple yet powerful tool for traders who want to enhance their candlestick analysis. By highlighting significant momentum candles, this indicator helps traders make more informed decisions and improve their overall trading performance.
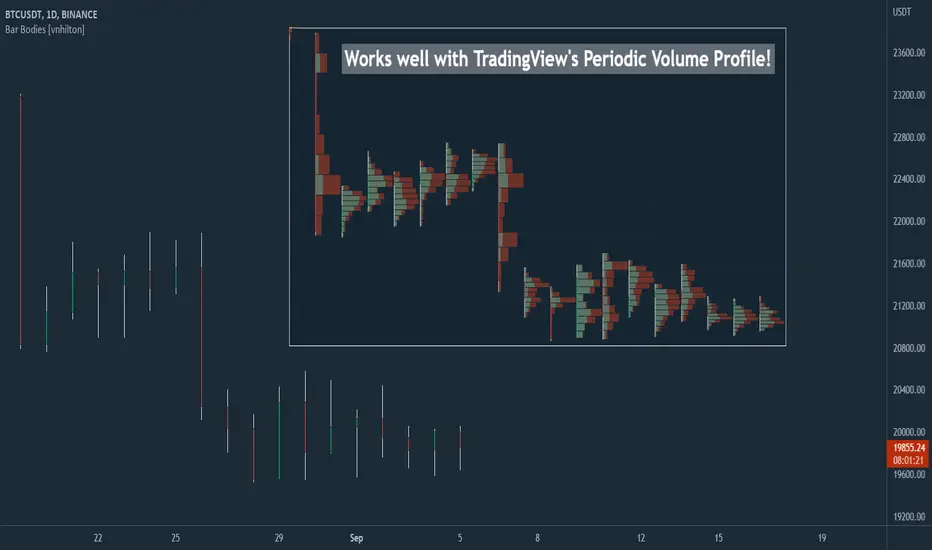
Bar Bodies [vnhilton]Note: Go to "Chart Settings" & hide "Body" & "Borders". Also uncheck "Labels on price scale" & "Values in status line" as they're not needed.
This script plots candlestick bodies with the same thickness as the wicks (similar to the bar chart, but without the horizontal lines to represent the open & close). To do this, it plots an invisible candlestick body with an invisible candlestick border from the high to the close/open for a green/red candle respectively, & uses the low wick as the candlestick body itself by plotting it from the low price to the open/close for a green/red candle respectively.
My personal use for this script is to use it in conjunction with TradingView's Periodic Volume Profile, in order to still see OHLC data without obstructing the candlesticks' volume profiles, as seen in the chart snapshot image above.
Funding Rate On-Hover TooltipFunding Rate On-Hover Tooltip
💡 What it is:
This Pine Script indicator provides a **non-intrusive and dynamic display of the current Funding Rate** for the selected perpetual futures contract. Instead of plotting the rate as a separate line or panel, the value is cleverly integrated into the indicator's name tag (tooltip) when you **hover your mouse over any candlestick** on the chart.
✨ How it's Original and Useful:
Most traders rely on external sources or a separate sub-panel for the Funding Rate, which can clutter the chart or interrupt the flow of analysis. This script offers a superior, **clean-chart solution** by making the rate instantly accessible only when needed. It allows traders to:
* **Quickly gauge market sentiment** (positive rate = long bias, negative rate = short bias) without distraction.
* Keep their main chart focused purely on price action.
* Monitor this crucial derivative metric directly within the TradingView interface.
⚙️ How it Works:
The script uses the built-in Pine functions to fetch the latest available Funding Rate data for the current symbol and resolution. The fetched value is then formatted and displayed dynamically using the **Funding Rate On-Hover Tooltip** function's name/label feature, which updates in real-time as you interact with the chart.
📖 How to Use It:
1. Add the **"Funding Rate On-Hover Tooltip"** indicator to your chart.
2. Move your mouse pointer over any candlestick.
3. The Funding Rate value (e.g., +0.0100% or -0.0250%) will appear next to the indicator's name on the chart's price axis or main window.
4. Use this quick data point as a factor in your entry and exit strategies.

Tradr Engulf
Introduction
"Candlesticks" patterns are used to predict price movements. This is engulfing candlestick pattern that is common and very useful in "technical analysis" in this script to identify itautomatically. The most important advantage of this indicator for users is saving time and high precision in identifying patterns. By using these pattern, you can predict price movements more accurately and therefore make better decisions in your trades.
Engulfing : The Engulfing candlestick pattern is a reversal pattern and consists of at least two candles, where one of them completely engulfs the body of the previous or following candle due to high volatility.
For this reason, the term "engulfing" is used for this pattern. This pattern occurs when the price body of a candle encompasses one or more candles before it. Engulfing candles can be bullish or bearish. Bullish Engulfing forms as a reversal candle at the end of a downtrend.
Bullish Engulfing indicates strong buying power and signals the beginning of an uptrend. This pattern is a bullish candle with a long upward body that completely covers the downward body before it. Bearish Engulfing, as a reversal pattern, is a long bearish candle that engulfs the upward candle before it.
Bearish Engulfing forms at the end of an uptrend and indicates the pressure of new sellers and their strong power. Additionally, forming this pattern at resistance levels and the absence of a lower shadow increases its credibility.

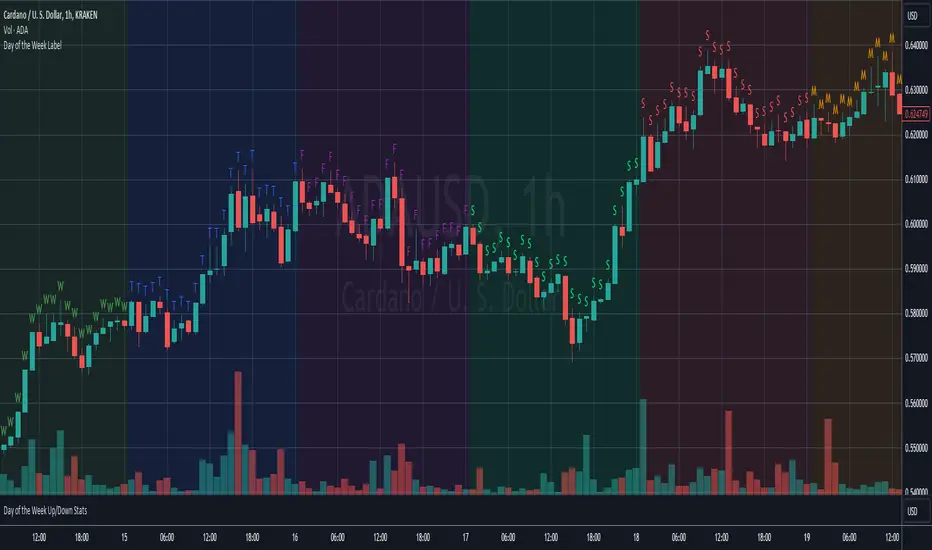
Day of the Week LabelOverview:
The "Day of the Week Label Indicator" is a simple yet powerful tool designed for traders and analysts who use TradingView for chart analysis. This indicator adds a clear visual cue to your charts by displaying the first letter of each day of the week directly above the corresponding candlestick. With this indicator, you can easily identify the day of the week at a glance without cluttering your chart.
Key Features:
Day Identification: Marks each candle with the first letter of the corresponding day of the week (e.g., "M" for Monday, "T" for Tuesday, and so on), providing immediate day recognition.
Color-Coded Labels: Each day is color-coded for better visibility and quick identification. Sundays and Saturdays are distinguished from the trading week, making it easier to spot the beginning and end of the trading week.
Overlay Design: As an overlay, this indicator seamlessly integrates with your existing chart setup, enhancing your analysis without interfering with other technical indicators or chart elements.
Benefits:
Enhanced Chart Analysis: Quickly discern patterns or trends that may be specific to certain days of the week, aiding in the refinement of trading strategies.
Time Management: Helps in planning trading activities or analysis by visually highlighting the days directly on the chart.
User-Friendly: Simple and non-intrusive, this indicator is designed to complement your chart without overwhelming it with information.
How to Use:
Simply add the "Day of the Week Label Indicator" to your chart, and the first letter of each day will automatically appear above the corresponding candlestick. No additional configuration is required, making it suitable for both novice and experienced traders.
Whether you're conducting a detailed market analysis, looking for day-specific patterns, or simply want a clearer visual representation of the time on your charts, this indicator is an essential addition to your TradingView toolkit.
Price Action Patterns DetectorIt's something like "Price Action Candlestick Pattern Detector." That is, it's an indicator that detects not only Pinbars and Engulfing but also all popular candlesticks in Price Action (Doji, Hammer, Shooting Star, Inside Bar, etc.)

Strong Body Candle (80% of Range)You said:
Strong body candle 80% range
ChatGPT said:
A strong body candle with an 80% range typically refers to a candlestick on a price chart (usually used in technical analysis) where the real body of the candle (the open-to-close price movement) makes up 80% or more of the entire candle’s range (the high-to-low movement).
Breakdown:
Candle Range = High − Low
Body Size = |Close − Open|
Body-to-Range Ratio = (Body Size ÷ Candle Range) × 100
If this ratio is ≥ 80%, the candle is considered to have a strong body.
Interpretation:
A strong bullish candle: Close is near the high, open is near the low — strong buying pressure.
A strong bearish candle: Close is near the low, open is near the high — strong selling pressure.
These candles often signal momentum or trend continuation, especially when occurring after consolidation or at breakout points.
Would you like a script or formula to help detect these on a chart?
2/2
You said:
Yeh indicator banaya hai is ki description Bana ker rain publish kernrehanhun trading view per
ChatGPT said:
Great! Here's a professional and clear description you can use to publish your indicator on TradingView:
🔥 Strong Body Candle (80% Range) — Indicator Description
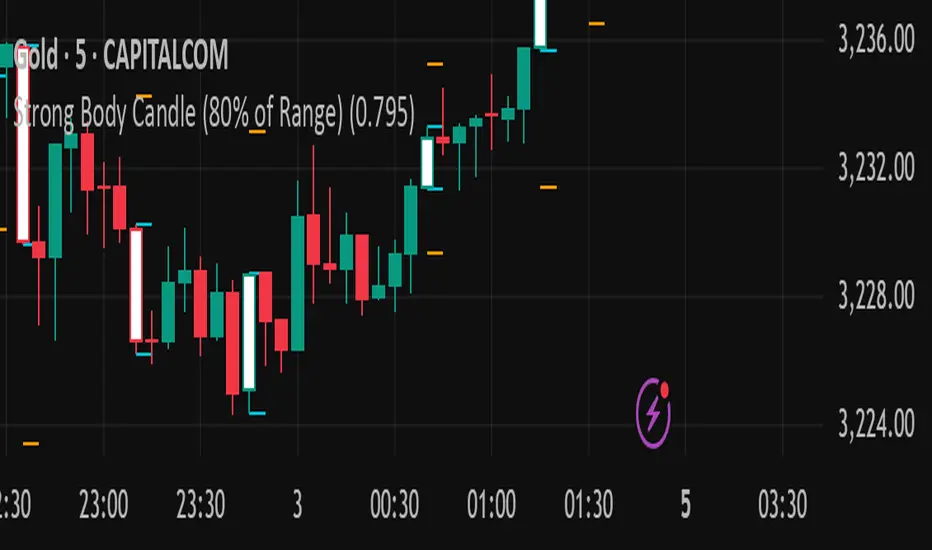
This indicator highlights candlesticks where the real body constitutes 80% or more of the entire candle's range (High − Low). These candles often represent strong momentum and are useful for identifying potential trend continuations, reversals, or breakout confirmations.
📌 Key Features:
✅ Detects both bullish and bearish strong body candles.
✅ Customizable threshold (default: 80%) for fine-tuning to your strategy.
✅ Visual markers make it easy to spot high-momentum candles on any timeframe.
📊 How It Works:
The script calculates the ratio of the candle's body size (|Close − Open|) to its total range (High − Low). If the ratio is equal to or above 80%, the candle is flagged:
Green Marker = Strong Bullish Candle (Close > Open)
Red Marker = Strong Bearish Candle (Open > Close)
🛠️ Use Cases:
Identify momentum shifts and breakout confirmations.
Use with support/resistance zones or trendlines for stronger signals.
Combine with volume indicators for enhanced precision.
fenxingFractal Sequence Trading System (Final Stable Version) identifies trends formed by two consecutive fractals based on three or five candlesticks.

CandlestickUtilitiesThis library provides essential functions for candlestick chart analysis and pattern recognition in Pine Script®.
It includes:
• Candle structure analysis (bodies, shadows, lengths)
• Trend detection using EMAs
• Common candlestick pattern recognition
This library is under construction.
Designed to support strategy development and improve signal accuracy for traders.
Created by @xprophetx — under MPL-2.0 license.

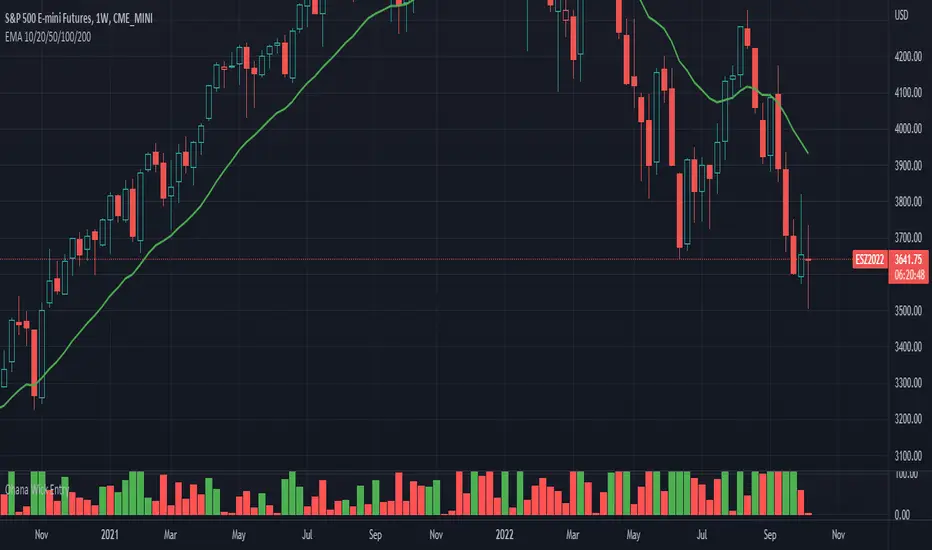
Ohana_Wick_EntryIndicator will change color depending if a wick comprises of less than 35% of the candlestick.
Strategy involves taking trades on stops above a green signal (<35% wick) to a target of the size of the candle body (expressed as the value in the indicator)
掘金社区趋势系统Of course. Here is the English translation of the provided trading system rules:
### Trading System Core Elements Explained
#### 1. Core Indicators and Definitions
* **Bull-Bear Line (Purple Line):** The primary basis for measuring the strength of long and short forces.
* *Example: If the 5-minute chart candlestick is below the Bull-Bear Line, the bears have the advantage. If the candlestick is above it, the bulls have the advantage.*
* **Trading Line (Yellow Line):** The operational line.
* **Opening/Closing Positions:** The Bull-Bear Line and Trading Line are the levels for both opening trades and taking profits.
* *Clarification: We only open or close positions when the price is at or very close to the Trading Line or Bull-Bear Line. If the price is not near these lines, it is not an opportunity for us to open or close a position. Note that the above rules for the Trading Line and Bull-Bear Line apply to all timeframes. Profit targets are scaled up through higher timeframes.*
#### 2. How to Identify a One-Sided Trend
* **Uptrend:** When the ribbon is **green** and positioned **above the Trading Line** and **above the Bull-Bear Line**, it indicates an uptrend on that timeframe.
* **Multi-Timeframe Confirmation (Resonance):** If **three timeframes simultaneously** show this state (green ribbon above both lines), it is a multi-timeframe resonance. The trading strategy then is to **buy on dips to support**, with entry positions being the Trading Line and Bull-Bear Line on the various timeframes.
* **General Rule:** When the price is **above the Bull-Bear Line**, place more trust in emerging **long signals** (e.g., green ribbon) to enter long positions.
* **Downtrend (Conversely):** When the candlestick is **below the Bull-Bear Line**, place more trust in emerging **short signals** (e.g., red ribbon) to enter short positions.
#### 3. Gauging Long/Short Strength
* The primary references for measuring the strength of bulls and bears are:
1. The positional relationship between the **Candlestick**, the **Bull-Bear Line**, and the **Trading Line**.
2. The **color of the ribbon**.
* **During Bearish Advantage:** Place more trust in emerging bearish signals for shorting. Be cautious with long operations.
* **During Bullish Trend:** Place more trust in emerging bullish signals. Focus on long positions and be cautious with shorting.
#### 4. Strong Trending Markets
* **Strong Bullish Market:** A pullback **does not break the lower ribbon**. In a strong, one-sided rally, the pullback **does not break the 5-15 minute Trading Line**.
* **Strong Bearish Market:** A rebound **does not surpass the upper ribbon**. In the strongest one-sided decline, the rebound **does not surpass the 5-15 minute Trading Line**.

始値を前日終値に合わせるローソク足A candlestick chart where each candlestick’s opening price is simply replaced with the previous candlestick’s closing price. Since there are no price gaps, a candlestick that appears to be bearish due to a gap down might actually be bullish, and a candlestick that appears bullish due to a gap up might actually be bearish.
単純に通常のローソク足の始値を前のローソク足の終値にしただけのローソク足。窓開けがなく、前回の終値から見れば窓開け陰線が実は陽線だったり、窓開け陽線が実は陰線だったりします。
