ADX and DI + CMF - Mutation [Redbeard]Hello,
this indicator was mainly made for my scalping indicator which you can find on my profile.
It displays:
- ADX and DI
- CMF
It has implemented additional functions and formulas which count the results of the lines different.
Best to use on lower Timeframe!!!!
Especially when you use it with my scalping indicator, then 1min timeframe is best!
Scalping

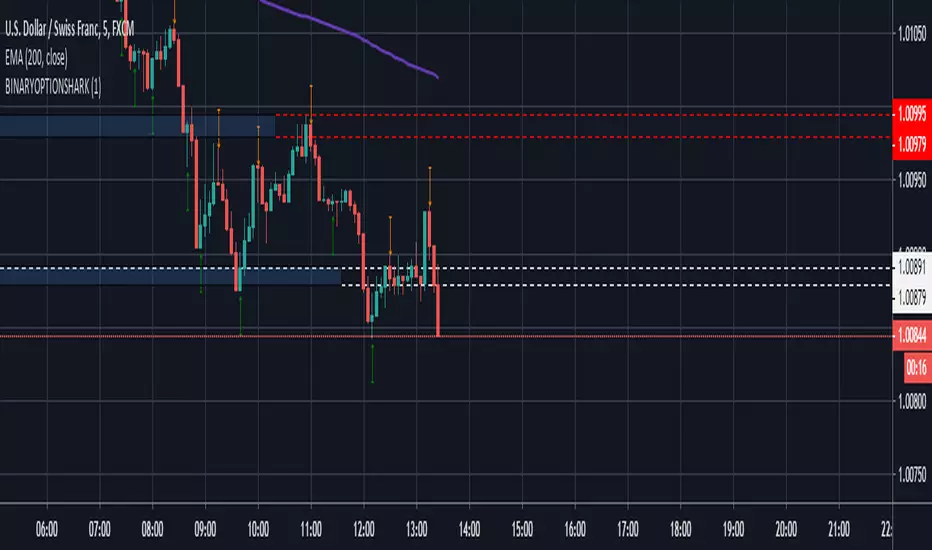
diamond_test_toolThis is a small test tool. The orders are close to random. The alg i used is nothing special.

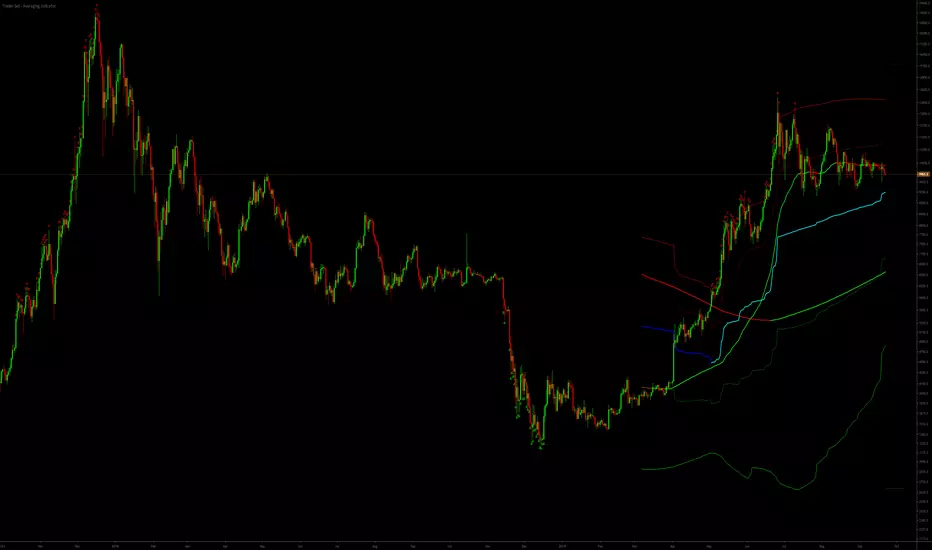
Trader Set - Averaging IndicatorThis is part of my SCALPING strategy, making the tool available for my students to use. In less than a month I will announce how you can get participated in the English version.
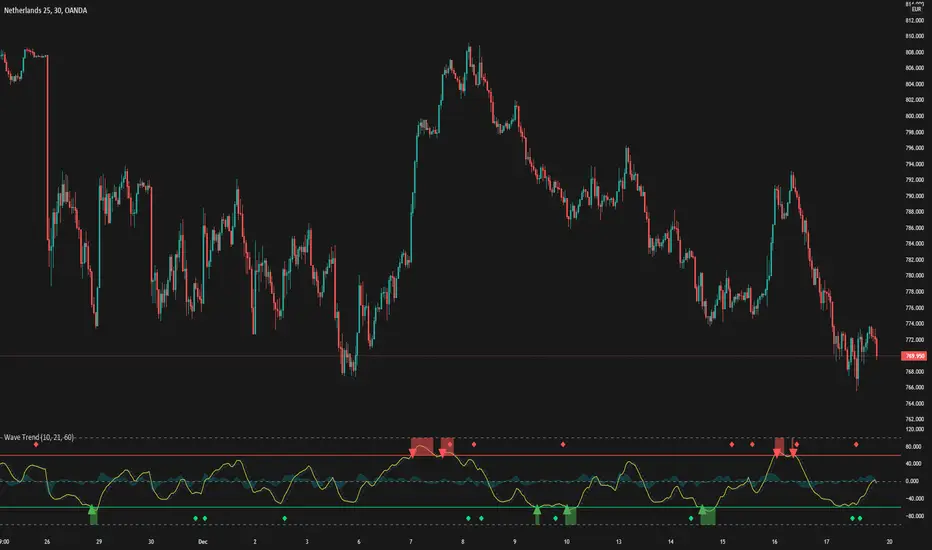
WaveTrendThis is a trend Analysis indicator request by Taleeto
To fully use this script, you will need a security key from him.
It alerts you when to buy or sell based on the market conditions
⚛WPO - Wave Period Oscillator by Cryptorhythms⚛WPO - Wave Period Oscillator by Cryptorhythms
Intro
The indicator is based on Akram El Sherbini's article "Time Cycle Oscillators" published in IFTA journal 2018. The third in a series of 4 time cycle indicators I will be publishing.
The WPO is a short-term oscillator that measures the buying and selling period of price cycles over a certain time interval. The leading oscillator indicates a rise in buying period when it moves above the zero line and a rise in selling period when it moves below the zero line.
Description
Centerline Crossover: A bullish centerline crossover occurs when the WPO line moves above the zero level to turn positive. A bearish centerline crossover occurs when the WPO line moves below the zero level to turn negative. When bulls are in control, the price rally begins and the average of the bull’s period T increases to drive the WPO line above the centerline. A buy signal is subsequently triggered. When the bulls start to loose power, prices move sideways and the average period decreases. In this case, the WPO line may flutter near the centerline and cause false signals, whipsaws. To avoid the whipsaws occurring on the centerline, the following trading tactics are proposed.
TL:DR
Bullish signals are generated when WPO crosses over 0
Bearish signals are generated when WPO crosses under 0
OverBought level is 2
OverSold level is -2
ExtremeOB level is 2.7
ExtremeOS level is -2.7
👍 Enjoying this indicator or find it useful? Please give me a like and follow! I post crypto analysis, price action strategies and free indicators regularly.
💬 Questions? Comments? Want to get access to an entire suite of proven trading indicators? Come visit us on telegram and chat, or just soak up some knowledge. We make timely posts about the market, news, and strategy everyday. Our community isn't open only to subscribers - everyone is welcome to join.
For Trialers & Chat: t.me

♒RBCI - Range Bound Channel Index by Cryptorhythms♒ RBCI - Range Bound Channel Index by Cryptorhythms
Intro
This is my best approximation of the RBCI. Its not perfect, but it does the job well enough.
A good way to use it is to enter when the singal line (light blue) RE ENTERS the channel from below. I circled these points on the indicator in green.
Description
Information to create was gathered mostly here: www.finware.com
RBCI (Range Bound Channel Index) – is calculated by means of the channel (bandwidth) filter (CF). Channel filter simultaneously fulfills two functions:
Removes low frequent trend formed by low frequent components of the spectrum with periods, more T2= 1/fc2;
Removes high frequency noise formed by the high frequent components of the spectrum with periods, less T1= 1/fc1.
👍 Enjoying this indicator or find it useful? Please give me a like and follow! I post crypto analysis, price action strategies and free indicators regularly.
💬 Questions? Comments? Want to get access to an entire suite of proven trading indicators? Come visit us on telegram and chat, or just soak up some knowledge. We make timely posts about the market, news, and strategy everyday. Our community isn't open only to subscribers - everyone is welcome to join.
For Trialers & Chat: t.me


SMA Futures Scalper - Long / Short / Trailing StopSMA Futures Scalper - Long / Short / Trailing Stop
It generates long/short signals and apply trailing stop of 3pts and offset of 1pt. Also with 3 contracts per open/closing trades.
How does it look? Let me know in the comments

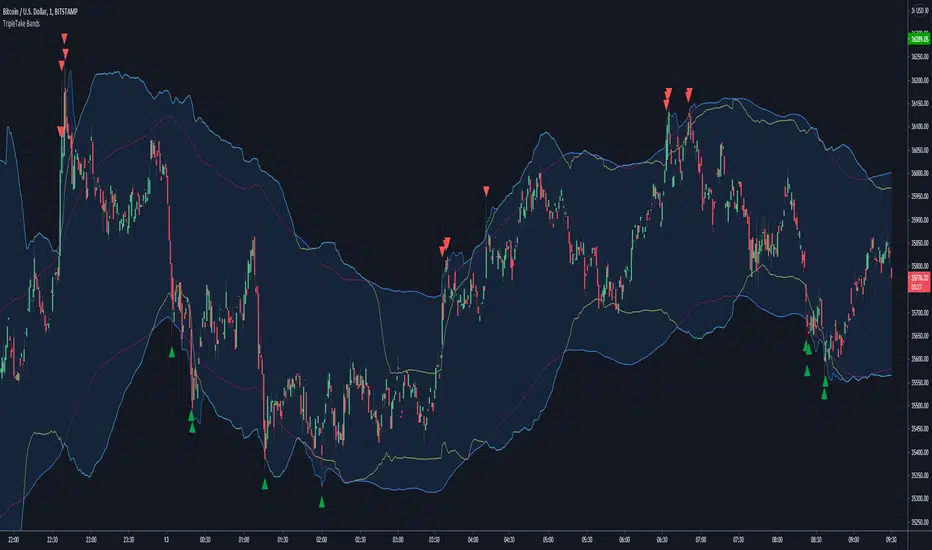
TripleTake BandsOur Most Requested Release (So you can all stop spamming me with PM's asking when it is going to be ready :D )
The original TripleTake indicator has been getting high praise from members of CryptoProTools.com but there was just one problem.. It only provided the buy signals.
This updated version comes with both the buy/long and sell/short signals. Margin traders rejoice!
-------------------------------------------------------------------
May the profits be with you! <(-.-)>
Scalping Buy and Sell IndicatorThis is the final version of scalping Buy and Sell Indicator, which is a combination of few indicators such as EMAs, MAs, Rsi, and MACD. It best used on 1hr, 4 hrs and smaller TimeFrame for scalping on Bitmex and other exchanges.
Buy symbol paints below the candle and sell symbol paints above the candle.
Buy and Sell Alerts are added for this indicator. In the Alerts window, please choose the option "Once the candle closes" for best results.
This is an invite-only script. Please message me or mail me for access. I am giving access to limited people only.

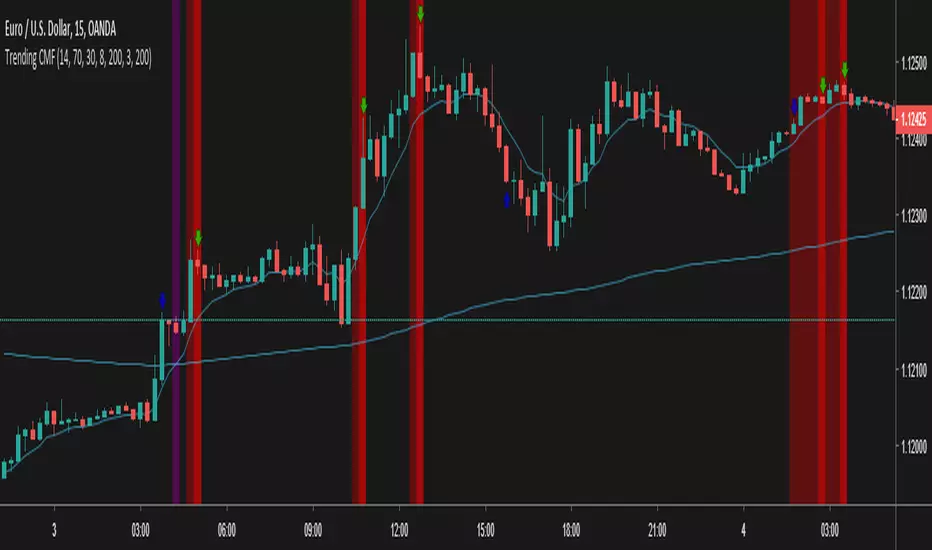
Trending CMF - InverseThis is an rsi based strategy for filtering trends and following nice signals
It is the reversal for the following script and strategy
Test and debug, lemme know what best fits, we are working to improve this
SN30 IndicatorIndicator «SN30»
Class : oscillator
Trading type : scalping
Time frame : 5 min
Purpose : reversal trading
Level of aggressiveness : standard
Indicator « SN30 » is based on the linier regression and normal distribution. Regression is one of the most popular and effective methods of the time series analysis and data prediction. Indicator « SN30 » uses regression analysis as an alternative to the moving averages analysis. The main aim is data series smoothing to reduce the noise in data. It allows to see market as it is, without deformation.
Using unique author algorithm indicator « SN30 » searches for the optimal buy/sell zones. If they are sufficient indicator generates appropriate trading signals.
Structure of the indicator «SN30»
Indicator «SN30» consists of central channel line (green line based on linier regression) and price channels (2 blue and 2 red lines with colored zones between them). Colored zones are of two types: red (overbought zone) and blue (oversold zone). They are used to define deviations of the current prices from their fair values. When the price enters the red zone it should reverse soon (the prices will go down). The same is true for the blue zone (the prices will go up).
Also when the buy/sell signal is generated special signs are displayed on the chart (red and blue triangles)
Parameters of the «SN30» indicator
1. PeriodSN30 (indicator period, default value = 21) – is used to calculate fair value of the asset based on linier regression.
2. Width – defines the width of the stationary channel (indicated by bold lines). Default value = 20 pips.
3. Sigma – defines the width of the dynamic channel (indicated by usual lines). Default value = 2standard deviations. It allows fitting 95% of price values into channel. All the price values out of the channel are treated as abnormal.
Rules of trading
The indicator is designed to work on 5-minute time frames, but after additional adjustment of parameters it can be used on any other time periods.
The general principle of the “SN30” indicator is the same as that of any indicator of the oscillatory class: when the price is in the overbought zone it is interpreted as a signal of a future price reverse in the downward direction, and when the price is in the oversold zone it is a signal of a future price reverse in the upward direction.
The rules of trading are extremely simple: when the red triangle is appeared on the chart (sell signal) or a blue triangle (a buy signal), a corresponding transaction (sell or buy an asset) should be done. Stops can be placed above/below the red/blue zones.

Gold24fx IndicatorGold24fx
Class : hybrid – trend oscillator
Trading type : scalping
Time frame : 5 min
Purpose : detection of optimal buy entry points
Level of aggressiveness : high
Indicator « Gold24fx » was developed for scalping trading in Gold market. It can be used to define optimal buy entry points when the bullish sentiments prevail.
Indicator « Gold24fx » is based on unique author algorithm. It allows to provide quantitative assessments of current market sentiments as well as to visualize them. Also «Gold24fx» can detect divergences between current market price and fair value of the Gold for a specific moment of time. Local undervaluation of the Gold is a reason to generate a buy signal in situation when market is controlled by the bulls.
Thus Indicator «Gold24fx» provides sufficient data to the trader for the successful trading in the Gold market.
Structure of the indicator
Indicator consists of the following elements:
- Market sentiments curve – is presented with 3 color gammas: blue color (bullish sentiments are dominating), red color (bearish sentiments are dominating), green color (flat is present in the market),
- Red cross on the curve – a signal in favor of contraindications for buy trades. Can be related with bearish sentiments in the market or local overbought of the Gold;
- Green triangle on the curve – is a buy signal for short term Gold trades. It appears when the bullish market sentiments are prevail and asset is temporarily undervalued.
Rules of trading
Rules of trading are very simple. Blue color of the curve evidences in favor of bullish market sentiments. When the buy signal appears (green triangle on the curve) long position in Gold should be opened.

Momentum Oscillator Momentum Oscillator
Concept for this leading indicator presented in IFTA by By M.Fawzy.

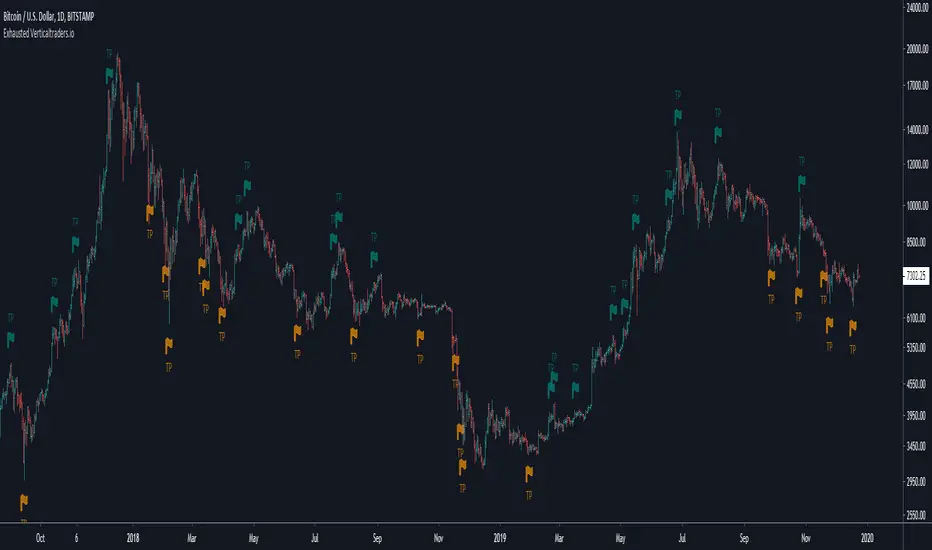
Exhausted-This algorithm takes in consideration Media averages, Volatility Movements, trend direction and other Mathematical Properties.
-After adding this signal on TradingView, you will get notified when it is suggested to protect profit or exits long and short positions.
-Meaning of colors:
Dark Red: suggestion protect profits Long
Red: suggestion exit Long
Dark green: suggestion protect profits Short
Green: suggestion exit Short
-You can activate notification alerts for any of the conditions.
-Works in any timeframe or market like Forex, Crypto, Commodities even Stocks.
-Recommended manual trading.
Do you need an Script or an expert adviser for Forex, contact our coding service!
Get this indicator today! contact us.
Stochastic RSI Signal LinesThis script is for private use only. I created it as step 1 for my Renko Trading Strategy.
Tested on BitMex on XBTUSD.

Adv Scalper-This algorithm takes in consideration Media averages, Volatility Movements, trend direction and other Mathematical Properties.
-After adding this signal on TradingView, you will get notified every of potential long and short points triggered by the indicator.
-This signal alerts you anytime bars form a bullish or bearish pattern and price start to move in the suggested direction.
- It is recommended to use in 15-30 min timeframes in forex , but It works in any timeframe or market like Forex, Crypto, Commodities even Stocks.
-Recommended manual trading.
Do you need an Script or an expert adviser for Forex, contact our coding service!
Get this indicator today! contact us.

TFFM-This algorithm takes in consideration Media averages, Volatility Movements, trend direction and other Mathematical Properties.
-After adding this signal on TradingView, you will get notified every of potential long and short points triggered by the indicator.
-This signal alerts you anytime bars form a bullish or bearish pattern and price start to move in the suggested direction.
-It works in any time frame or market like Forex, Crypto, Commodities even Stocks.
-Recommended for bots or manual trading.
Do you need an Script or an expert adviser for Forex, contact our coding service:
Get this indicator today! contact us
Premium 3-This algorithm takes in consideration Media averages, Volatility Movements and other Mathematical Properties.
-Allows you to find divergences and price trends in a simple way
-After adding this signal on TradingView, you will see potential long and short according to the colors of the candlesticks.
-It works in any time frame or market like Forex, Crypto, Commodities even Stocks.
Bullish Strength
Olive: weak
Dark green: medium
Light green: strong
Lime: very strong
Bearish strength
Fuchsia: weak
Maron: medium
Red: strong
Intense red: very strong
Do you need an Script or an expert adviser for Forex, contact our coding service
Get this indicator today! contact us

Entry Bars -This algorithm takes in consideration Media averages, Volatility Movements and other Mathematical Properties.
-After adding this signal on TradingView, you will get notified every of potential long and short points triggered by the indicator.
-This signal alerts you anytime bars form a bullish or bearish pattern and price start to move in the suggested direction.
-It works in any time frame or market like Forex, Crypto, Commodities even Stocks.
-Recommended for bots or manual trading.
Do you need an Script or an expert adviser for Forex, contact our coding service
Get this indicator today! contact us
