Soheil PKO's 5 min Hitman Scalp - 3MA + Laguerre RSI + ADX [Pt]Someone sent me this strategy found on YouTube. It is Soheil PKO's "The Best and Most Profitable Scalping Strategy" Best way to find out is to code it =)
This strategy uses Moving Average Ribbon, Laguerre RSI, and ADX. This script only displays the MA ribbon, you will need to add Laguerre RSI and ADX separately.
Long Entry Criteria:
- 16 EMA > 48 EMA > 200 SMA
- Laguerre RSI > 80
- ADX > 20
Long Exit Criterion:
- 16 EMA < 48 EMA
Short Entry Criteria:
- 16 EMA < 48 EMA < 200 SMA
- Laguerre RSI < 20
- ADX > 20
Short Exit Criterion:
- 16 EMA > 48 EMA
As mentioned in the video, risk management is very important, especially for scalping strategies. Therefore, I've added option for setting Stop Loss and Price Target in the options for you guys to play with.
All parameters are configurable.
Enjoy~~
Scalping

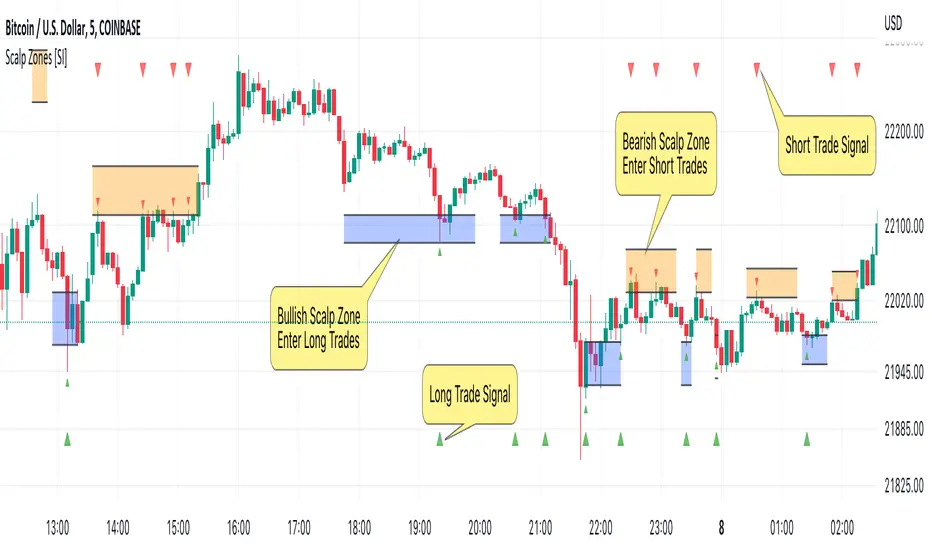
Scalp Zones [SI]The Scalp Zones indicator provides traders with visual ranges or "zones" on their charts, which can be used to quickly identify potential entry points for their trades in real time. Once price action enters the designated zone, trade signals and alerts will be generated, making it easier for both scalpers and swing traders to identify promising trading opportunities with greater confidence.
Although Scalp Zones is relatively easy to use, its simplicity is the end result of some interesting and rather complex analysis of price action and market structure.
█ CONCEPTS
Price Action vs Market Structure
For our purposes, “price action” refers to the movement of a security's price over time, whereas “market structure”, which is built upon price action, includes trends and support/resistance levels, breakouts, reversals of trend, etc. All of which can help traders identify potential entry and exit points for their trades.
Scalp Zone
A “Scalp Zone” is an area just above resistance or just below support that is deemed to be part of a trend that is exhausted or part of a “whipsaw” in the price action.
█ FEATURES
Can be combined with other indicators
Scalp Zones displays color-coded rectangles or "zones" that indicate areas of potential volatility, trend reversals and consolidation in price action. These zones can be used in conjunction with other indicators to more effectively identify trade opportunities.
Can also serve as an exit signal
Since Scalp Zones identifies areas where market participants are likely to enter or exit positions, they can offer some traders a way to spot good exits for their trades. For instance, if the price fails to surpass a significant resistance level (identified by a “scalp Zone”) and begins to decline, this may serve as a sell signal for traders who intend to lock in profits on a potential trend reversal.
Automatically adjusts to market conditions
Scalp Zones uses Average True Range (ATR) to dynamically adjust the size of the color-coded zones based on the current market conditions. By factoring in the ATR, the tool can produce zones that reflect the volatility of the market and adjust to changing levels of price movement.
█ LIMITATIONS
The Scalp Zones indicator is designed to provide traders with signals for potential entry points in the market, but it should not be used as the sole basis for making trading decisions. As with any trading indicator, it is important to acknowledge and understand that past performance does not guarantee future outcomes and that several other variables contribute to achieving success as a trader, especially proper risk management.
Drip's 11am rule breakout/breakdown (OG)This indicator is based on Drippy2hard's 11:30 am (EST) rule.
In simple terms the rule states that:
If a trending stock makes a new high after 11:15-11:30am EST, there is a 75% chance of closing within 1% of High of day (HOD). Same applies for downtrend.
Please note:
Not all stocks will abide by this, this is backtested on stocks with avg daily volume > 2M and mostly mega cap stocks which have liquid option chains. The backtesting results show very promising results on $SPY/ $SPX so it is advised to trade $SPY/ $SPX using this indicator over any other stocks.
Although the name suggests 11 AM rule, the backtesting shows higher win rate for 11:30 AM so please select that option in the settings.
As always, no indicator is perfect and please follow your risk management and understand that indicators are tools to aid your trading and by no means they are supposed to work as intended in all scenarios
How the script works
1. A HOD/LOD zone is identified based on regular session (9:30am-11:30am) EST. Users can select cut off time to 11AM in the settings. These will be indicated on chart after 11/11:30pm depending on what user selected
2. If the stock breaks above the HOD and the ADX is showing strong momentum to upside then the candlesticks will start showing neon color, if the trend based on moving averages and candle closing is also bullish then the indicator will show trend arrows under the candle indicating to stay in the trade. Same applies for break below LOD, only the colors will change to represent downtrend.
3. An optional cloud is also shown if the trend is developed. The cloud can be used as trail stop or re entry point as long as it is displayed on chart
How to use the indicator in trading
In general, there are three scenarios which are trade worthy
1. If the stocks breaks out above the HOD zone and up trend develops or the stocks breaks below the LOD zone and downtrend develops. See images below
2. You can also use the LOD/HOD zone as demand/ supply if the Price action is range bound like this example below
Thanks for reading, please give thumbs up if you like using it! Please post comments on how to use it.

Jerry J8 30-123 Spy Dashboard ProPlease watch the J8 Scalping Tutorial Video below for a walkthrough on how these indicators work.
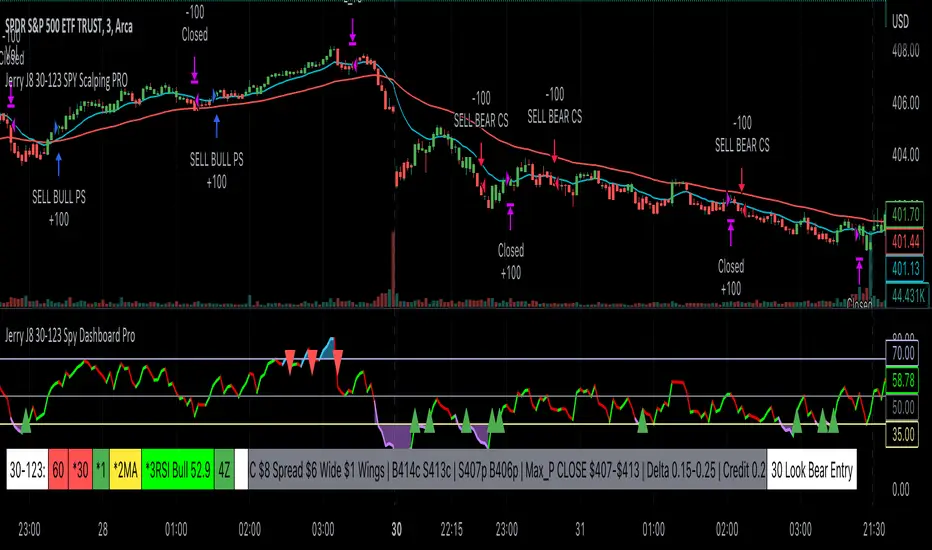
This script is used in conjunction with Jerry J8 30-123 SPY Scalping PRO” Indicator(which creates the buy and sell orders as a strategy). The Dashboard shows the 4 main criteria statuses from the strategy. I find the dashboard makes scalping the SPY much easier.
This study project is designed for scalping options that expire daily with bull put and bear call credit spreads on a 3 minute chart. The name 30_123 is a reference to 4 main criteria being met to give a green light for a potential trade. The criteria:
* 30 = 30 minute trend
* 1 = 3 minute trend
* 2 = Moving average criteria
* 3 = RSI criteria
4 = Secondary trend. Bonus if in sync but not a requirement.
* The strategy also utilizes momentum as a criteria but this is not shown on the dashboard.
This indicator is designed to trade options that expire daily including the SPY, IWM, QQQ, and NDX. However, it can be used with multiple symbols on a 3 minute chart.
When the 30_123 conditions are all green with all criteria are met a bull signal is created.
When the 30_123 conditions are all red with all criteria are met a bear signal is created.
This study is the dashboard that is designed to show how the main J8 strategy indicator is working and it shows which criteria have been met. Additionally there are multiple user INPUTS that you can adjust for the 4 main criteria plus inputs to help you with your credit spread criteria.
For example, if the SPY is at 400 we could have an order to sell a BULL PUT CREDIT SPREAD and I would likely sell the 398p and buy the 397p; The 398p delta would be approximately -.2. The spread position profits with any close over 398 and/or can be closed early with a bullish price move. IMPORTANT: If the SPY closed the day at $399 on the chart it would look like a loss based on the buy and sell orders but the spread would be a full profit since the close was above 398.
---- IRON CONDOR
For the SPY ticker only an iron condor label is generated when the SPY is trading sideways and meets specified criteria. When the criteria is met the Iron Condor label appears and it provides a recommendation for what option to buy and sell. The iron condor recommendations can be adjusted with user inputs.
This Indicator dashboard shows the criteria labels and colors the criteria as green if bullish and red if bearish. When the criteria are not met the dashboard shows “NO CLEAR SIGNAL”. There is also a label that shows whether you are looking for bullish or bearish positions based on the 30 minute trend.
The chart shown on the indicator is the RSI and for this indicator an RSI over 50 is bullish and under 50 is bearish. The line color shows the RSI trend. RSI OB (overbought) and OS (oversold) areas are shaded. The RSI can remain in an OB or OS state for a prolonged period and while some people use OB and OS as a reversal signal I use it as a strong trend indication and recognize it will not last forever. You can SET the OB and OS levels with inputs.
---- USER INPUTS
Paint Bars: Turns on/off the candle coloring. Default is OFF.
Iron Condor Settings: Defaults are what I use and can be used as a guide.
Criteria: Trend, moving averages, and RSI settings can all be adjusted.
---- SETUP & HINTS
Add "Jerry J8 30-123 SPY Scalping PRO” indicator to show bull and bear signals
Add "Jerry J8 MACD Optimal Entry Zone” indicator to show best MACD range for entry
I also like to add "Jerry Momentum Dream" indicator to see the momentum
With this indicator we’re looking for the 30, 1, 2, and 3 criteria to be met which increases our likelihood of success. IMPORTANT. Never automatically enter a position without reviewing the other indicators and drawing your own conclusions. You want to choose the entries that are the most appealing to you that take into account volume, time of day, and risk/reward. Positions should be closed based on your risk/reward goals.
Indicators are not a magic pill and should be used to support trading decisions, not to make them for you. Past performance is not a guarantee of future returns. The results of individual stocks/indexes with any strategy do not constitute proof they will repeat in the future.
DISCLAIMER: The information contained in our scripts/indicators/ideas does not constitute financial advice or a solicitation to buy or sell any securities of any type. Trading and investing in the stock market and cryptocurrencies involves substantial risk of loss and is not suitable for every investor. I’m NOT a financial adviser. All trading strategies are used at your own risk.
Please Use the AUTHOR’s INSTRUCTIONS link below for more information.
NOTE: The PERFORMANCE SUMMARY below does not accurately reflect the trading strategy because the entry orders generated in the strategy are based on the stock price and our actual order is a credit spread that is profitable even if the price moves against us a little bit. What could show as a loss in the strategy could be a profit in the credit spread.

Jerry J8 30-123 SPY Scalping PROPlease watch the J8 Scalping Tutorial Video below for a walkthrough on how these indicators work.
---- STRATEGY
This study project is designed for scalping options that expire daily with bull put and bear call credit spreads on a 3 minute chart. The name 30_123 is a reference to 4 main criteria being met to give a green light for a potential trade. The 4 main criteria:
*30 = 30 minute trend
*1 = 3 minute trend
*2 = Moving average criteria
*3 = RSI criteria
4 = Secondary trend. Bonus if in sync but not a requirement.
* The strategy also utilizes momentum as a criteria.
This indicator is designed to trade options that expire daily including the SPY, IWM, QQQ, and NDX.
When 30_123 conditions are all green and all criteria are met a bull signal is created.
When 30_123 conditions are all red and criteria are met a bear signal is created.
The bull and bear signals are based on the stock/index price; BUT the actual orders are for option spreads that are normally based on a delta of approximately .15 to .25.
For example, if the SPY is at 400 we could have an order to sell a BULL PUT CREDIT SPREAD and I would likely sell the 398p and buy the 397p; The 398p delta would be approximately -.2. The spread position profits with any close over 398 and/or can be closed early with a bullish price move. IMPORTANT: If the SPY closed the day at $399 on the chart it would look like a loss based on the buy and sell orders but the spread would be a full profit since the close was above 398.
This script is used in conjunction with Jerry J8 30-123 Spy Scalping Dashboard Pro indicator which is the dashboard to give a visual for the 4 main criteria and makes things easier to understand.
---- TRADING TIME FRAME
The default time frame is 10:00 - 15:57 and can be controlled by the user. I do not enter trades in the first 30 minutes since that can be a very volatile period and you can easily configure the indicator and trading time frame based on how you trade.
---- MAJOR USER INPUTS
Paint Bars: Turns on/off the candle coloring for the trend
Exits: Open orders can be closed with 3 different exit criteria and all should be left on. These exits are needed to provide multiple entry signals throughout the day. However, you want to close the spreads based on your own criteria and not on the indicator.
Criteria: Trend, moving averages, RSI settings, and trading time frames can all be adjusted.
---- SETUP & HINTS
Add "Jerry J8 30-123 Spy Scalping Dashboard Pro” indicator to show J8 criteria dashboard
Add "Jerry J8 MACD Optimal Entry Zone” indicator to show best range of entry
I also like to add "Jerry Momentum Dream" indicator to see the momentum
With this indicator we’re looking for the 30, 1, 2, and 3 criteria to be met which increases our likelihood of success. IMPORTANT. Never automatically enter a position without reviewing the other indicators and drawing our own conclusions. You want to choose the entries that are the most appealing to you that take into account volume, time of day, and risk/reward. Positions should be closed based on your risk/reward goals.
Indicators are not a magic pill and should be used to support trading decisions, not to make them for you. Past performance is not a guarantee of future returns. The results of individual stocks/indexes with any strategy do not constitute proof they will repeat in the future.
DISCLAIMER: The information contained in our scripts/indicators/ideas does not constitute financial advice or a solicitation to buy or sell any securities of any type. Trading and investing in the stock market and cryptocurrencies involves substantial risk of loss and is not suitable for every investor. I’m NOT a financial adviser. All trading strategies are used at your own risk.
Please Use the AUTHOR’s INSTRUCTIONS link below for more information.
NOTE: The PERFORMANCE SUMMARY below does not accurately reflect the trading strategy because the entry orders generated in the strategy are based on the stock price and our actual order is a credit spread that is profitable even if the price moves against us a little bit. What could show as a loss in the strategy could be a profit in the credit spread.
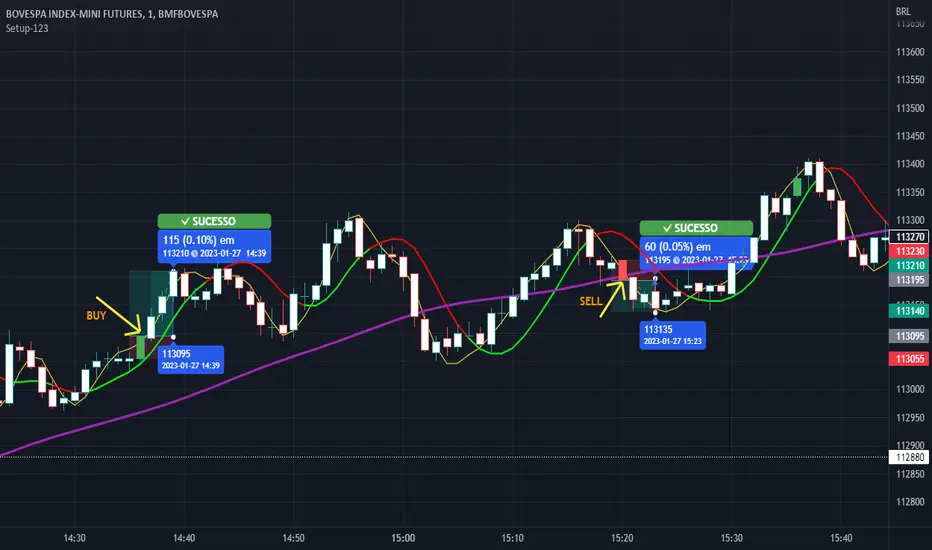
Setup 123 ScalperSetup 123 Scalper is characterized by a bottom (buy pattern formed by 3 candles where the 2nd has the lowest minimum) or a top (sell pattern formed by 3 candles where the 2nd has the highest maximum). It has a filter that only shows the signal when the asset is trending. Setup popularized by trader Alexandre Wolwacz (Stormer).
Na linguagem do autor:
O Setup 123 Scalper é caracterizado por um fundo (padrão de compra formado por 3 candles onde o 2º tem a menor mínima) ou um topo (padrão de venda formado por 3 candles onde o 2º tem a maior máxima). Possui um filtro em que só mostra o sinal quando o ativo está em tendência. Setup popularizado pelo trader Alexandre Wolwacz (Stormer).
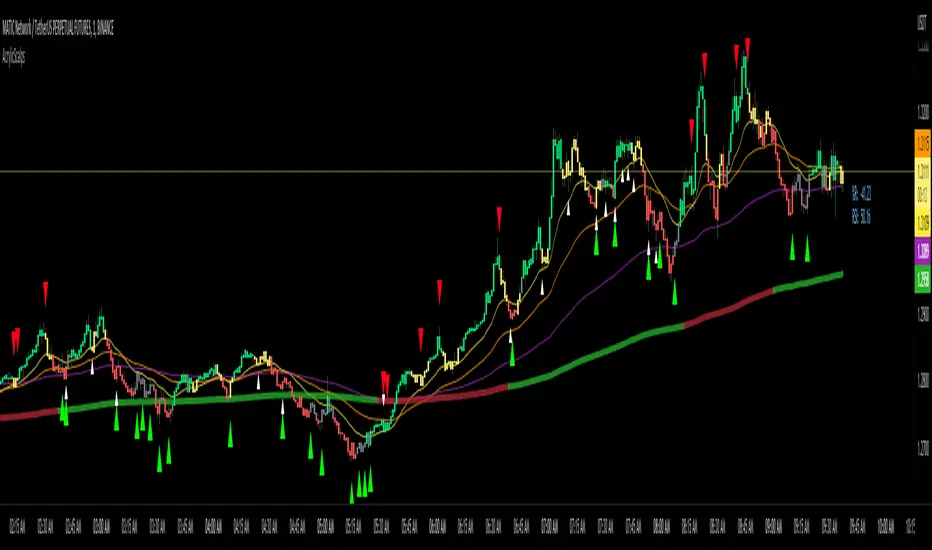
Acrylic's 1m/3m Scalper Buy/Sell SignalsAcrylic's Scalper Signals uses a combination of RSI / Stochastic / Williams %R to calculate the perfect entry signals. The script(with it's default settings) has been optimized and thoroughly tested on BTC & ETH 1 and 3 minute time frames. It's intended for quick in and out trades that should only last a few minutes unless a strong trend is caught. Basic knowledge of market structure is needed, as you will not be taking every signal generated by the script.
You also have the option to display all signals regardless of the short term trend that has been confirmed by RSI. This can be good if you're looking for reversal entries at resistance/support levels.
-Large triangle signal: Strongest signal that was confirmed with RSI & Williams %R optimized calculations. (prints at current candle close)
-Small triangle signal: Fractal signal can be used as a late entry signal/continuation. (prints after 2 candle closes)
-Candle colors are matched to stochastic strength for added confluence to enter trades. (Must hide default trading view candles to see these)
-233SMMA color is matched to the extreme short term trend based off of RSI calculations.
Perfect Long Entry Setup Image :
1) EMA21 > EMA55 > EMA100 > SMMA233(Colored green for added confluence) - All pointing up indicating strong trend
2) Enter on pullback to short term EMA after signal candle closes. (Do not take entry if candles closed below 100EMA)
Perfect Short Entry Setup Image :
1) EMA21 < EMA55 < EMA100 < SMMA233(Colored red for added confluence) - All pointing down indicating strong trend
2) Enter on pullback to short term EMA after signal candle closes. (Do not take entry if candles closed above 100EMA)
Feel free to ask questions or leave feedback in the comments, I'm always looking to improve! Thanks!
ATR PivotsThe "ATR Pivots" script is a technical analysis tool designed to help traders identify key levels of support and resistance on a chart. The indicator uses various metrics such as the Average True Range (ATR), Daily True Range ( DTR ), Daily True Range Percentage (DTR%), Average Daily Range (ADR), Previous Day High ( PDH ), and Previous Day Low ( PDL ) to provide a comprehensive picture of the volatility and movement of a security. The script also includes an EMA cloud and 200 EMA for trend identification and a 1-minute ATR scalping strategy for traders to make informed trading decisions.
ATR Detail:-
The ATR is a measure of the volatility of a security over a given period of time. It is calculated by taking the average of the true range (the difference between the high and low of a security) over a set number of periods. The user can input the number of periods (ATR length) to be used for the ATR calculation. The script also allows the user to choose whether to use the current close or not for the calculation. The script calculates various levels of support and resistance based on the relationship between the security's range ( high-low ) and the ATR. The levels are calculated by multiplying the ATR by different Fibonacci ratios (0.236, 0.382, 0.5, 0.618, 0.786, 1.000) and then adding or subtracting the result from the previous close. The script plots these levels on the chart, with the -100 level being the most significant level. The user also has an option to choose whether to plot all Fibonacci levels or not.
DTR and DTR% Detail:-
The Daily True Range Percentage (DTR%) is a metric that measures the daily volatility of a security as a percentage of its previous close. It is calculated by dividing the Daily True Range ( DTR ) by the previous close. DTR is the range between the current period's high and low and gives a measure of the volatility of the security on a daily basis. DTR% can be used as an indicator of the percentage of movement of the security on a daily basis. In this script, DTR% is used in combination with other metrics such as the Average True Range (ATR) and Fibonacci ratios to calculate key levels of support and resistance for the security. The idea behind using DTR% is that it can help traders to better understand the daily volatility of the security and make more informed trading decisions.
For example, if a security has a DTR% of 2%, it suggests that the security has a relatively low level of volatility and is less likely to experience significant price movements on a daily basis. On the other hand, if a security has a DTR% of 10%, it suggests that the security has a relatively high level of volatility and is more likely to experience significant price movements on a daily basis.
ADR:-
The script then calculates the ADR (Average Daily Range) which is the average of the daily range of the security, using the formula (Period High - Period Low) / ATR Length. This gives a measure of the average volatility of the security on a daily basis, which can be useful for determining potential levels of support and resistance .
PDH /PDL:-
The script also calculates PDH (Previous Day High) and PDL (Previous Day Low) which are the High and low of the previous day of the security. This gives a measure of the previous day's volatility and movement, which can be useful for determining potential levels of support and resistance .
EMA Cloud and 200 EMA Detail:-
The EMA cloud is a technical analysis tool that helps traders identify the trend of the market by comparing two different exponential moving averages (EMAs) of different lengths. The cloud is created by plotting the fast EMA and the slow EMA on the chart and filling the space between them. The user can input the length of the fast and slow EMA , and the script will calculate and plot these EMAs on the chart. The space between the two EMAs is then filled with a color that represents the trend, with green indicating a bullish trend and red indicating a bearish trend . Additionally, the script also plots a 200 EMA , which is a commonly used long-term trend indicator. When the fast EMA is above the slow EMA and the 200 EMA , it is considered a bullish signal, indicating an uptrend. When the fast EMA is below the slow EMA and the 200 EMA , it is considered a bearish signal, indicating a downtrend. The EMA cloud and 200 EMA can be used together to help traders identify the overall trend of the market and make more informed trading decisions.
1 Minute ATR Scalping Strategy:-
The script also includes a 1-minute ATR scalping strategy that can be used by traders looking for quick profits in the market. The strategy involves using the ATR levels calculated by the script as well as the EMA cloud and 200 EMA to identify potential buy and sell opportunities. For example, if the 1-minute ATR is above 11 in NIFTY and the EMA cloud is bullish , the strategy suggests buying the security. Similarly, if the 1-minute ATR is above 30 in BANKNIFTY and the EMA cloud is bullish , the strategy suggests buying the security.
Inside Candle:-
The Inside Candle is a price action pattern that occurs when the current candle's high and low are entirely within the range of the previous candle's high and low. This pattern indicates indecision or consolidation in the market and can be a potential sign of a trend reversal. When used in the 15-minute chart, traders can look for Inside Candle patterns that occur at key levels of support or resistance. If the Inside Candle pattern occurs at a key level and the price subsequently breaks out of the range of the Inside Candle, it can be a signal to enter a trade in the direction of the breakout. Traders can also use the Inside Candle pattern to trade in a tight range, or to reduce their exposure to a current trend.
Risk Management:-
As with any trading strategy, it is important to practice proper risk management when using the ATR Pivots script and the 1-minute ATR scalping strategy. This may include setting stop-loss orders, using appropriate position sizing, and diversifying your portfolio. It is also important to note that past performance is not indicative of future results and that the script and strategy provided are for educational purposes only.
In conclusion, the "ATR Pivots" script is a powerful tool that can help traders identify key levels of support and resistance , as well as trend direction. The additional metrics such as DTR , DTR%, ADR, PDH , and PDL provide a more comprehensive picture of the volatility and movement of the security, making it easier for traders to make better trading decisions. The inclusion of the EMA cloud and 200 EMA for trend identification, and the 1-minute ATR scalping strategy for quick profits can further enhance a trader's decision-making process. However, it is important to practice proper risk management and understand that past performance is not indicative of future results.
Special thanks to satymahajan for the idea of clubbing Average True Range with Fibonacci levels.

PSAR BBPT ZLSMA BTC 1minLong entry:
PSAR gives buy signal
BBPT prints green histogram
ZLSMA is below the price
ZLSMA has uptrend
SL is smaller than the max SL
Optional Sessions and EMA filters
Short entry
PSAR gives sell signal
BBPT prints red histogram
ZLSMA is above the price
ZLSMA has downtrend
SL is smaller than the max SL
Optional Sessions and EMA filters
SL:
Placed below ZLSMA + offset on long
Placed above ZLSMA + offset on short
TP1:
1x the SL by default
Takes no profit by default, 50% is also a good setting
TP2:
2x the SL by default
Take out all remaining position size.
If price reaches TP1, the SL is set to the entry price.

Dual Bollinger Band Mean ReversionSimple but solid mean reversion indicator with sl and tp levels. Most of the code is based on the built in bollinger bands script. Designed for scalping 1-5 minute timeframes.
The indicator consists of two sets of bollinger bands.
Price has to close below the lower (fast) bollinger band, above the moving average of the (slower) bollinger band.
If price now closes above the lower (fast) bb, the indicator draws a label at the open of the next candle (which would be a potential entry point). Take profit becomes the upper bollinger band, stop loss the same distance below the open of the candle.
I've built in a simple backtesting function that calculates the potential win/loss-ratio. Loss and profit levels are 1:1. Exit strategy could be improved on.
Adjusting the lengths depending on the asset proves to be a good idea.
The slower bollinger bands can help to identify ranging markets and/or trends following regular bollinger bands theory.
Feel free to comment with any changes that you'd like to be made.

Round Numbers Breakouts Smart Formula Signals and AlertsThis indicator uses Round Numbers breakouts and then uses smart formula with the near Round Numbers to determine best TP (take profit)/SL (stop loss) areas. Furthermore, it calculates win percentage, shows in-profit/in-loss peaks and the price amount result over a customizable date range, which when combined well with the smart formula provides decent profitable outcome. I have decided to write my own backtesting engine as the integrated TradingView strategy one has limitations and has shown inconsistencies when compared to manual backtesting…
There are many settings you can manually change to trade any instrument, any style, any approach and there are presets included for Bitcoin(BTCUSD), FOREX(EURUSD), SPY(S&P500), so you can start trading immediately! Alerts correspond to indicator settings and are turned on with a few clicks. There are 3 tables (each can be shown/hidden) showing everything you need to see/know to calibrate the indicator as you wish.
Labels, lines, tables explanations (everything can be hidden/shown):
- LONG Labels: medium-green: position open, dark-green: SL, bright-green: TP, blue: TP2
- SHORT Labels: medium-red: position open, dark-red: SL, bright-red: TP, purple: TP2
- Gray circles: position entry area | Yellow crosses: SL area
- Green line: Long TP1, Blue line: Long TP2 | Red Line: Short TP1, Purple line: Short TP2
- Grey lines: Round Numbers (customized via “Round Number up/down measure unit” input)
- Yellow labels at end of each week: end of week OVERALL total results
- Red colored background: power segment
- 3 tables: 1) INFO | STATS, 2) SPY Options Calculator, 3) Indicator Settings
If you decide to fully customize the indicator yourself, on the very top - under “PRESETS” select “MANUAL”! NOTE: If you select any of the pre-set presets, only GLOBAL settings can be changed, the rest of the settings will be “frozen” until you switch it to “MANUAL”!
- Global Settings are self-explanatory and mainly observational, show/hide, etc.
- Manual TP2 (Multi-Take-Profit) Settings:
>>>>> Include TP2 System? Turn on/off multi-profit system, with this unchecked, every trade will either end with SL or with TP1.
>>>>> TP2 System: NEAREST/FORMULA, NEAREST – after TP1 is taken > next TP2 will be a round number price target nearest to where TP1 was taken (sometimes it can be very near, sometimes further away…), FORMULA – 2nd round number price target will be optimally selected based on the distance behind and ahead of TP1 area. For TP2 – FORMULA would be the most logical choice as with multi-take-profit setting turned on – you’d want to ride it out as far as possible.
>>>>> TP1/TP2 division type: 1) Each price target (TP1, TP2) will be ½ of the position 2) TP1 will be 2/3 of the position and TP2 will be the remaining 1/3.
>>>>> TP2 hit type: “close” > candle has to close on top/crossing the price target line, “touch” > once candle touches the price target – you will be immediately alerted to take the partial profit (if you will use such setting – you will need to take the partial profits as soon as you receive the alert.
>>>>> TP1 > Back to Entry hit type: similar to TP2, “close” > candle close, “touch” > candle touch. Please note: this is a very tricky setting as if you use “close” option – your profitable trade may become a loss if a huge candle will close against your position eliminating your TP1 profit, however often the price will touch and cross the entry area to only bounce and continue with your position direction for even bigger profits… so experiment with the date range results to see what works best for your instrument/setting/strategy.
>>>>> TP2 count towards trades count: this can be a bit confusing, but it is simply how should TP2 be treated towards trades count. The indicator will show you Win Percentage and Win % is obtained from winning trades count divided by total trades count. While TP2 is not “a new trade”, it expands the profit of the trade. This is an experimental setting to count TP2 as the whole winning trade, ½ of a trade, or not count it at all.
- Manual Signals/TP1 Settings:
>>>>> TP1/TP2 offset: this one is really cool, with this feature you can hunt these conditions when the price comes very near the profit target area, but never touches it. With this setting turned on and with a good offset amount – you will be able to catch these for TP1 and TP2!
>>>>> TP1/TP2 offset amount: just what the title says, please be careful with this as this number varies significantly depending on the instrument you will be trading. Examples: 1) For SPY 0.1 would be $0.10 offset - if TP1 is $400 and price hits $399.90 > TP1 considered taken/signal shown/alert) | 2) For EURUSD, it is very different and if wrong will show TP1 immediately at position open, typical good offset for EURUSD is: 0.0005 | 3) For BTCUSD, 10 - $10 offset, if TP is $15,000 > $14,990, etc.
>>>>> Round Number up/down measure unit (in dollars $): this one is very important if you will be using “MANUAL” selection to build your own setup as it is very different for every instrument. For SPY, round numbers are single dollars or even half-dollar 50 cent numbers: 1 or 0.5 (350, 351, 352, etc. or 350.50, 351, 351.50, 352, etc.), while for Bitcoin (BTCUSD) a single unit ($1) is too small to be a round number as Bitoin moves much faster and wider every second and it would have to be at least 50 ($50) to make sense. Similar for FOREX (EUR/USD) a single 1 unit ($1) will be too big as EURUSD will never move a whole $1 in 15 minutes or even a day.. and would have to be something like 1.05500. You can easily determine if this number makes sense for your instrument by observing the grey Round Number lines which will correspond based on this setting. You can also visually observer if the price of the instrument appreciates these round numbers.
>>>>> Close Position Before Market Closes: just what the title says. Indicator will close the position 15 minutes before market closes (US session), update backtesting stats, alert you.
>>>>> Close Position Before Power Hour: 3PM – 4PM ET is the last hour of US trading session, where sudden move in any direction can happen with huge volatility, while sometimes nothing will happen at all… Many try to avoid it, so if you wish to avoid it as well - turn this on and it will alert you to close your positions 15 minutes before Power Hour starts, backtesting/stats will be adjusted accordingly.
>>>>> Skip OVERSIZED candles in signals: turn on this setting to skip signals, which happen to fall on big candles. This is basically a protection from huge volatility moves, which usually happen during financial news/events and if you are not a fan of these – you can set this option for indicator to not open anything based on the candle size.
>>>>> Color OVERSIZED candles: this will help you calibrate the size of the OVERSIZED candles if you decide to use this setting and overall visually see them.
>>>>> OVERSIZED candle size: OVERSIZED candle size must be input as it varies significantly. Please note: for each instrument – the size number is completely different, as for SPY: 2 would mean any candle bigger than $2 distance will be considered OVERSIZED, for Bitcoin it would have to be several hundred dollars, like 400-500. For FOREX, this would have to be a decimal, for EURUSD something like 0.0005. It’s best to experiment visually with this setting depending on the instrument you will be trading while setting up the size. To see a typical huge unusual candle – look up financial calendar for something like FOMC meeting, then measure the candle input it into this setting.
>>>>> OVERSIZED candle size calculation type: this is just more flexibility for your preference. If you wish to calculate the size of the candle based on the open/close – select “BODY”, if you wish to use high/low – select “STICKS (from tip to tip)”. Hard to say which one is better, so it is up to you to decide.
>>>>> Include EMA in signal formula: LONG signals will only be shown only if above EMA, SHORT if below EMA. EMA length is of course customizable in below.
>>>>> Skip opposite candle types in signals: signals where the candle color confirms the direction of the trade, but the candle type is opposite (like a green colored bearish hammer for example) will be avoided (such candles can be very uncertain/deceptive).
>>>>> Skip doji: signals where the signal candle is doji (uncertain) will be avoided.
>>>>> TP1 hit type/system: same thing as TP2 hit type/system.
>>>>> SL hit type/system: same as TP1 and TP2 types/systems.
>>>>> Intraday Session Signals Active Time in ET: time range during the day when indicator will show signals (open trades, alert you, etc.). This is specifically for intraday trading. You can turn it off completely by selecting a BLANK option.
>>>>> Intraday TP/SL Active Time in ET: same as above, but for taking profits/stop losses.
*** To add the alerts
-Right-click anywhere on the TradingView chart
-Click on Add alert
-Condition: Select this indicator by it’s name
-Alert name: Whatever you want
-Hit “Create”
-Note: If you change ANY Settings within the indicator – you must DELETE the current alert and create a new one per steps above, otherwise it will continue triggering alerts per old Settings!
If you wish to try this out for a week or so – please write me directly and I will give you access.

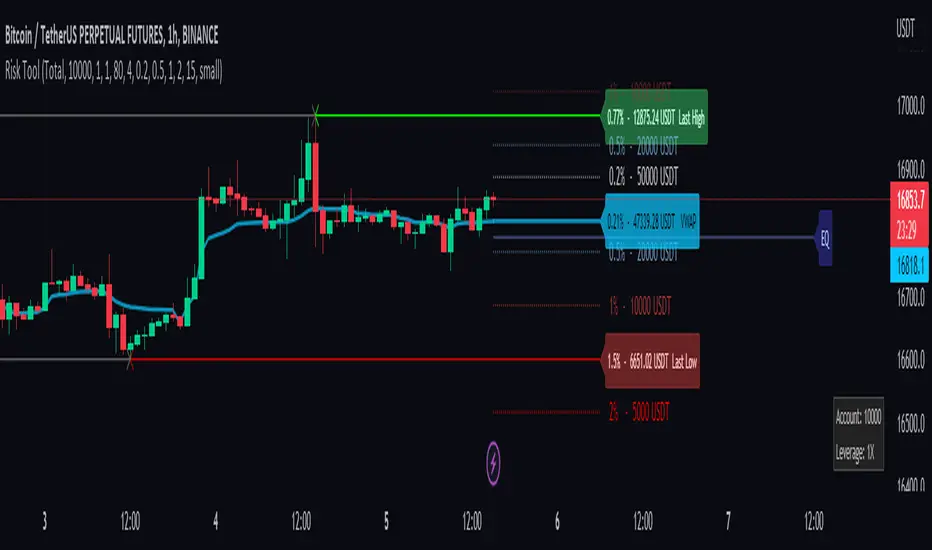
Risk Management ToolThis tool is a good way to get quick position sizing. No need to use your calculator and find that your price asset is already out of your range.
It works best with Cryptocurrencies Exchange way to manage position size calculation.
Really useful when scalping. This tool tracks the last high and low following your custom lookback bars number. It also follows the VWAP level.
You also have 4 custom ranges around the current price with the calculated position size. You set the desired percentage distance from the current price and you get the position size you need.
1. You choose the type of order
2. Account balance
3. Leverage if you use the cost base orders type
4. Amount to risk
and you get real-time risk management.
HMA Breakout Buy/Sell indicator for Scalping & Intraday - ShyamHi All,
This is a very simple indicator which provides the buy signal, when the moving average lines turns Green and sell signal, when the moving average signal turns red. This can be used for both intraday and scalping method with different timeframes. But best time frame is 5 minutes.
Buy Signal >>> Line turns GREEN (Use trailing SL to cover maximum profit)
Sell Signal >>> Line turns RED (Use trailing SL to cover maximum profit)
No trade >>> Line turns GRAY
Best timeframe >>> 5 minutes
Thanks,
Shyam

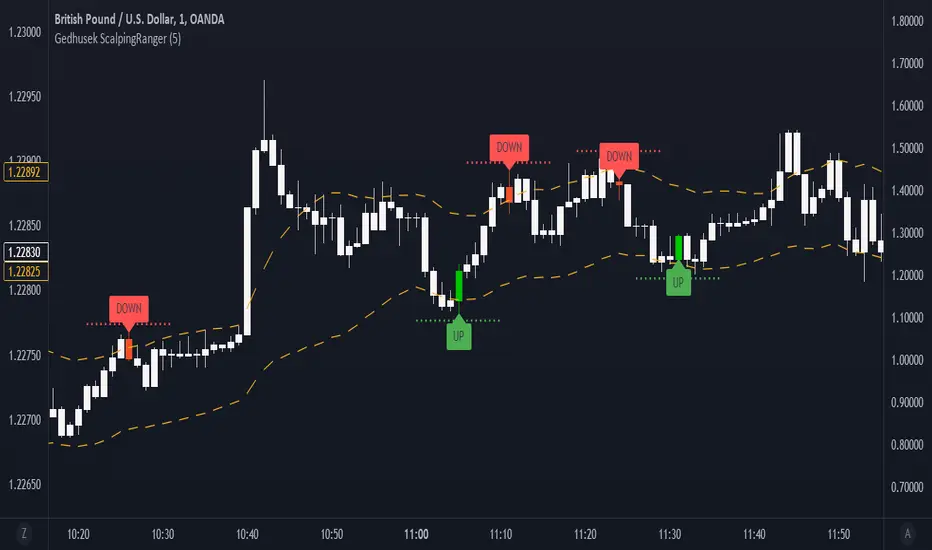
Gedhusek ScalpingRangerThis indicator was designed for finding good entries for scalping the market
How does it work:
- It works on a basis of price running out of its bands and its return
- Once the price is out of bands, the system starts scanning for two patterns --> sudden price reversion and losing of momentum.
- If any of these patterns occur, the indicator waits for a confirmation bar and after that it gives you a signal that the price could be moving upwards or downwards.
- These signals are represented by a label and sudden price change of the current bar
- Also you will see a dotted line above or below the bar that can be used as a potential Stop Loss level
Idea behind the trigger patterns:
Sudden price reversion
- Idea behind this pattern is that the price has a higher success of reversion if there is a fast change of its momentum. This pattern is recognized by measuring the divergence between prior and current price change
- The divergence is measured as correlation between shorter-term price action and longer-term price action. If the correlation is negative and statistically significant, it is counted as a reversion signal (= shorter-time price action goes in the opposite direction of longer-term price action)
Losing of momentum
- The idea behind this pattern is that once there is no strong momentum, there is lower probability of a breakout and start of strong trend
- It is calculated as a difference between current price and previous price. If the difference is minimal, it is taken as a signal that the price lost its momentum and therefore there is higher chance of reversion.
When to use:
- This indicator works well in ranging markets, but slightly less well in trending markets. Therefore look for sideways markets and use the indicator there
- Price action patterns work really well with this indicator, such as Support and Resistance levels, double Tops and Bottoms,...
Inputs:
- This indicator has only one input and that is "Analysis Period". This input declares how many bars and going to be used when finding the patterns of possible price reversion
Entry helperHello traders,
This is a script I use daily as a scalper and it helps me a lot, maybe it can help you, this is why I am sharing it!
PART 1 - DESCRIPTION
This program is specifically designed to help scalpers but can be used for all types of trading but won't be as useful.
This script is what I call an entry helper as it calculates dynamically the position size, stop loss and take profit levels and more.
When scalping and placing market entry orders, the price can move significantely while you are calculating your position size according to your stop loss, capital, risk and especially close price that changes very quickly, this results in a risk that is not ideally controlled and personally was a source of frustration and stress. I wanted to enter my quantity and stop loss values as fast as possible and make the process easier.
This script automates the calculation of the position size, stop loss and take profit levels according the the users input and prints the data visibly on the screen so it is easy to copy by the trader. It allows the trader to be confident that his risk is as controlled as possible.
The script is easy to use and set up, this guide will help you if you have any difficulies or questions.
PART 2 - HOW TO USE THE SCRIPT
- SET THE CAPITAL SETTINGS
1 - Set your capital value in $
- SET THE TRADE SETTINGS
2 - Set your trade side (BUY or SELL)
3 - Set you desired risk in % of your capital
- ENTRY SETTINGS
4 - Set your entry from 2 different options
|MARKET| (default option)
This option will place the entry level at the last available price
|LIMIT|
This option allows you to input a fixed price level for the entry
- STOP LOSS SETTINGS
5 - Select your stop loss placement from 4 different options
|EXTREMA STOP LOSS| (default option)
This option will place the stop loss at the highest/lowest (extrema) price level within the last N candles
|ATR EXTREMA|
This option uses the same price level as the EXTREMA STOP LOSS but will add/soustract the last ATR value (calculated on the N last candles) multiplied by a coefficient that you input
|TICKS EXTREMA|
This option uses the same price level as the EXTREMA STOP LOSS but will add/soustract a number of ticks that you input
|PRICE LEVEL|
This option allows you to input a fixed price level for the stop loss
- TAKE PROFIT SETTINGS
6 - Select your take profit from 3 different options
|NONE| (default option)
This option will not display any take profit level, I have added this option as I don't have take profit targets
|RR|
This option uses a risk to reward ratio (reward/risk) that you input, it will automatically calculate the take profit level that corresponds
|PRICE LEVEL|
This option allows you to input a fixed price level for the take profit
- QUANTITY AND FEE SETTINGS
7 - Set the quantity settings, it represents the quantity in a lot (usually 100 000 in forex, 100 in stocks 1 for crypto currencies)
8 - Set the fee per quantity (turning lot)
- VISUAL SETTINGS
9 - Show or remove the tab
- TAB SETTINGS
10 - Select the data that you want to display in the tab (the tab will adapt automatically)
NOTES:
The vertical dashed line shows what candle has been used for the calculation of the stop loss, it allows you to visualize what candle the script has selected in case of an EXTREMA stop loss option.
I hope this helps you out! Any suggestions are welcome and I hope that the guide is clear enough.
Happy trading!

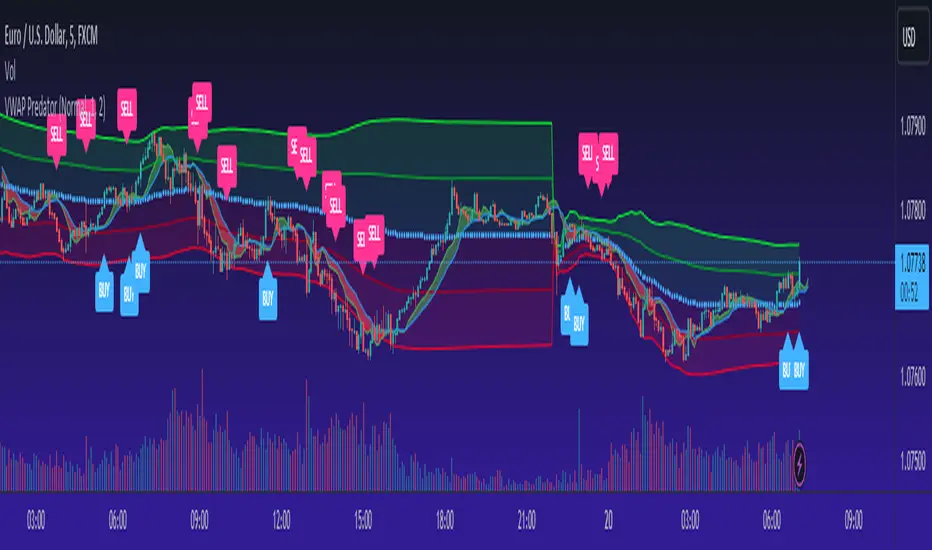
VWAP PredatorUsing VWAP as a start point, the VWAP Predator uses proprietary Fibonacci bands to help determine signal criteria. Most traders use VWAP in a simple way to determine whether an instrument is in a bearish or bullish state, but that doesn't help choosing the correct time to go long or short.
The xBat VWAP Predator uses behavioural analysis with volume, price action with open and close proximities to the Fibonacci bands/zones (Fib Zones). The following describes how the xBrat VWAP Predator is different to any standard use of Volume Weighted Average Price and uses xBrat Proprietary Behavioural logic to determine high probability long and Short signals. All of this heavy lifting and logic is done behind the scenes, keeping traders charts clean.
Long Trading Signals - Candle Coloured in Blue - There are many states with the logic to produce these signals, which are briefly described below:
1. The only standard criteria here - The price action must be above the VWAP Line
2. The Price must open below the boundary of one Fib Zone and close into the next Fib Zone
3. That Same Candle has to be an Accumulation Candle (more volume than the preceding candle and More Buyers) - This is determined with our proprietary logic coding
4. The Same signal candle also has to be higher than average volume. Again, our proprietary xBrat Logic just doesn't look back over a set number of bars, it looks at times of day and day of week, plus more to determine a true valuation of higher, lower or equal to average volume.
5. Only when these states are met, plus two more ema proximity logic, Does the xBrat VWAP predator give a Long Signal.
6. Trade Management is either set targets or indeed a simple ema cross which we provide as a ribbon on the chart to help traders. These ema's are different to entry logic. When the Ribbon turns from green to red, the trader should consider exiting the trade
Short Trading Signals - Candle Coloured in Pink - There are many states with the logic to produce these signals, which are briefly described below:
1. The only standard criteria here - The price action must be below the VWAP Line
2. The Price must open above the boundary of one Fib Zone and close into the next Fib Zone
3. That Same Candle has to be a Distribution Candle (more volume than the preceding candle and More Sellers) - This is determined with our proprietary logic coding
4. The Same signal candle also has to be higher than average volume. Again, our proprietary xBrat Logic just doesn't look back over a set number of bars, it looks at times of day and day of week, plus more to determine a true valuation of higher, lower or equal to average volume.
5. Only when these states are met, plus two more ema proximity logic, Does the xBrat VWAP predator give a Short Signal.
6. Trade Management is either set targets or indeed a simple ema cross which we provide as a ribbon on the chart to help traders. These ema's are different to entry logic. When the Ribbon turns from red to green, the trader should consider exiting the trade.
VWAP Predator is a day trading and scalping signals trading indicator.
[SPOILED]SteadyScalpyHi Traders,
This is my testing strategy which implemented Trading View's trailing stop loss feature. This strategy mainly focus on ETH/USDT perp contract15 minutes timeframe, backtest capital is set to 1000 USDT, 10% equity, 0.04% commission, limited backtest date from Jan 2022 to now, result as shown below. I have faith in this strategy, but still please use only a small amount of money to test, like 5-10% of your total capital.
The strategy contains a couple modules, entry module, trend filter module, take profit, and stop loss module.
How to use:
Stoch RSI:
5 MA types were provided which is HMA / VWMA / WMA / EMA / SMA , HMA with Length setting of 5, 8 seems to be most efficient. VWMA and WMA with 8, 13 will generate less entry signals but with less entry risks.
Price Step:
This is the core feature of this strategy and it is based on Demark9 and price action. With Step 1&2 enabled, it will generate more entry signals. signals can be filtered by trend magic. if disable this option, Stoch RSI will be the only entry signal left in this strategy.
Trend Magic:
Trend Magic uses CCI and ATR to calculate trend status; green means uptrend, red means downtrend, pretty straight forward; the best value for this indicator would be, 21, 34, 55, 89. Only long allow when trend magic turns green and vice versa.
Take Profit and Stop Loss:
The default value for TP is set to 0.4%. Once the price hits 0.4%, it begins trailing; once the price drawdown 0.01%, it will close trade. The orange line indicates the ATR trailing take profit; once 'close' crosses ATR, it will exit the trade immediately. I also added a failsafe as a final stop loss, when price movement exceeds threshold (default 1%), it will exit trade no matter what.
Enjoy :)

[SPOILED]SuperTrench - ETH Super ScalperHi Traders,
I'm republishing this script as I finally polished it to perfection IMO. The script uses 5 coding sections: entry, trend filter, pivot filter, take profit, and stop loss. The script mainly uses trailing as take profit; this is probably the easiest way to make a profitable scalper strategy.
Backtest capital is set to 1000 USDT, 35% equity, 0.04% commission, limited backtest date from Jan 2022 to now, backtested on ETH/USDT prep contracts 15m timeframe, result as shown below.
It looks unreal right? Hell no, I actually tested this strategy on Binance from Dec 06 to Dec 10. I got 8.29% return with 4x leverage, 50% equity setup; 75% win rate,1.58 profit factor, with 4.3% max drawdown, it is amazingly close to the backtest result.
User Manual
Entry >>> Stoch RSI:
I added 5 MA types to the Stoch RSI which is HMA/VWMA/WMA/EMA/SMA, HMA with Length setting of 5, 8 seems to be most efficient, VWMA and WMA with 8, 13 will generate less entry signals but with less entry risks.
Entry >>> R Style:
It based on price action, with candlestick makes a U turn, after 2nd candlestick confirmed, it generates entry signal, this will give you some extra entries, better leave it enabled.
Entry >>> Price Step:
This probably is the core feature of this strategy; also my secret ingredient to making this strategy this efficient. It is recommended to enable step 1-5, more steps basically means more entries, but they are not necessarily profitable.
Trend Filter >>> Price Step:
I couldn't tell you much details about how this indicator works, but it is a reliable indicator, based on price action, and I got some ideas from Demark9 indicator. The bigger the level, the stronger the filter is, please note that if 'Price Step Entries' less than Price Step Trend, entries will be ignored.
Pivot Filter >>> RSI Pivot & Pinbar Pivot:
RSI Pivot detects if the RSI signal line making U turn in certain condition, Pinbar detection combines R Style entry when price action U turn took place, these 2 pivot filter will close the trade once it is counter trend, so it better enable and leave it as is.
Trend Filter >>> Trend Magic:
Trend Magic uses CCI and ATR to calculate trend status, green means uptrend, red means downtrend, pretty straight forward, the best value for this indicator would be, 21, 34, 55, 89.
Trend Filter >>> Alpha:
This filter combines R style pivot, price step, EMA all together to detects consolidation area, because EMA was involved, so the best look back period would be around 15-35, it is best to use default value IMO, in another hands, if you need stronger filter, feel free to use 10, 18, 20, 25, 30, 35, make sure look back period should increase or decrease by 5 every time.
Take Profit and Stop Loss:
The default value for tp is set to 0.4%, but I also give you option to switch to ATR TP; you can adjust in the ATR multiplier, default ATR trailing stop loss uses 1 ATR, but you can adjust it for better drawdown tolerance. Fixed ATR SL is also given when fixed ATR is enabled. There will be a failsafe SL default set to 1% if price moves counter direction of opened position, it will close trade no matter what happens.
Enjoy :)

Higher Timeframe Price Action ScannerThis is a higher timeframe scanner that detects the price action trend on multiple timeframes and displays them all as red or green dots. You’ll be able to see the real time and historical price action trends so you can trade in the same direction of the overall trend on higher timeframes. You can also set it to scan a different ticker if you choose. If you find pairs that correlate very well, you can use two scanners and look at both of them for extra trend confluence.
CALCULATIONS
This scanner uses the same price action formula from our other indicator titled 1 Minute Scalping Indicator which can be found on our profile. It has Scalp Mode and Swing Mode. Both modes use the exact same price action parameters for signals, but Swing Mode will only give signals when the price action parameters are met AND the close is higher than the previous high for bull signals or when the close is lower than the previous low for bear signals.
HOW TO USE
The top line of the scanner shows the price action trend for the current chart timeframe and the rest are using the higher timeframe that you set in the input settings. They start with higher timeframe #1 as the second line from the top and go down from there.
When most or all of the dots are green, you should be looking for long positions and when most or all of the dots are red, you should be looking for short positions.
Since this scanner is using pure price action to identify trends, it’s a reliable way to see what multiple timeframes are doing.
PAIRINGS
Use this with the 1 Minute Scalping Indicator so you can get the signals and candles colored per the price action on your chart as well as see the higher timeframe price action trend from the scanner. Using both together will help you make better trading decisions.
MARKETS
You can use this scanner on any market.
TIMEFRAMES
This scanner will scan the current chart timeframe and display the result on the top line, then the lines below that will display the results from the higher timeframes you choose in the settings. It has timeframes from 1 minute all the way up to 1 year.

1 Minute Scalping IndicatorThis is a 1 Minute Scalping Indicator based purely on price action of the current candle compared to the previous candle so there is no lag from using other indicators. It works great on all timeframes, but is designed for getting in and out of positions quickly using the 1 minute chart. The candles will paint according to the direction the price is currently moving in, which is a great way to help reduce anxiety while watching the candles bounce back and forth.
HOW TO USE
It has Scalp Mode and Swing Mode. Both modes use the exact same price action parameters for signals, but Swing Mode will only give signals when the price action parameters are met AND the close is higher than the previous high for bull signals or when the close is lower than the previous low for bear signals.
This scalping indicator will show green up arrows when it detects bullish price action and red down arrows when it detects bearish price action. It will show a yellow arrow if the bullish/bearish price action conditions are met, but it detects a candle pattern that may be a weak signal such as small candle body, large wicks, etc. When this happens, make sure to wait for the next candle to show confirming price action before following the signal. You can also turn the signals off and use only the candle coloring if you prefer cleaner charts.
You can change the candle colors it uses within the input settings, as well as the color of the signal arrows to suit your preferences. You can also turn off the candle coloring if you prefer normal candles. If you are using the indicator’s candle coloring, make sure you go to your chart settings(gear icon top right) and in the symbol tab, turn off body, borders and wick for this to show up properly.
This scalper also includes alerts for bull and bear signals that can be set to alert you on any market and timeframe.
SCANNER
We also made a higher timeframe scanner that uses this same price action formula and shows you if higher timeframes are currently bullish or bearish in real time. It’s titled Higher Timeframe Price Action Scanner and can be found on our profile. I strongly recommend using both of these together to get an idea of the overall trend on longer timeframes. You can also use two of the scanners and set them to two tickers that move together or opposite of each other(like SQQQ and TQQQ) for even more market insight on your ticker's immediate direction.
MARKETS
This 1 Minute Scalping Indicator works well on any market such as stocks, crypto, forex, futures, etc.
TIMEFRAMES
This indicator is designed for scalping on the 1 Minute timeframe, but it works well on all timeframes, since it is using price action to give signals.
TIPS FOR BEST RESULTS
We recommend pairing this indicator with another support & resistance or moving average combo to find great entry areas and use the price action signals as confirmation when price bounces off of those areas. We also recommend using the Higher Timeframe Price Action Scanner with this so you can see the overall trend of higher timeframes on your chart and trade in the direction of the trend.
Scalp Mode
Swing Mode
Candle Coloring Only - No Signals - Scalp Mode
Candle Coloring Only - No Signals - Swing Mode

RSI Divergence Strategywhat is "RSI Divergence Strategy"?
it is a RSI strategy based this indicator:
what it does?
it gives buy or sell signals according to RSI Divergences. it also has different variables such as "take profit", "stop loss" and trailing stop loss.
how it does it?
it uses the "RSI Divergence" indicator to give signal. For detailed information on how it works, you can visit the link above. The quantity of the inputs is proportional to the rsi values. Long trades are directly traded with "RSI" value, while short poses are traded with "100-RSI" value.
How to use it?
The default settings are for scalp strategy but can be used for any type of trading strategy. you can develop different strategies by changing the sections. It is quite simple to use.
RSI length is length of RSİ
source is source of RSİ
RSİ Divergence lenght is length of line on the RSI
The "take profit", "stop" and "trailing stop" parts used in the "buy" group only affect buys. The "sell" group is similarly independent of the variables in the "buy" group.
The "zoom" section is used to enlarge or reduce the indicator. it only changes the appearance, it does not affect the results of the strategy.

Gedhusek MasterReversionThe MasterReversion Indicator works as a scanner for possible price reversals.
How does it work?:
The main feature of this indicator is finding extreme price deviations from its mean. This is reached by calculating the average price deviation from its mean and then comparing it with the current price deviation. This deviation is expressed as a percentage in relation to the historically highest price deviation --> if the maximum deviation is 200 points and the current deviation is 180 points, than the percentage displayed is going to be 90%.
With knowing how extreme the current deviation is, we can do some good decision making about whether the market is ready to reverse to its mean or not.
The next feature of this indicator is classic SuperTrend indicator. This tool is mainly used for identifying shifts in the market trend and in this case it becomes very useful when catching the actual price reversion.
The key idea:
The main idea behind this tool is that the price can be away from moving average, but cant stay that way forever. Therefore its convenient to know when the reversion part might happen
How to use:
Generally, you would want to wait until the current price reaches certain percentage (you can see a label on the latest bar displaying current percentage deviation). After that happens, wait for a sign of pullback. For that you can use the built-in SuperTrend indicator or any other strategy that you like. Your potential Take Profit should be somewhere around the main moving average (it has a white colour) as you are speculating on mean reversion.
[
Settings:
MA Period = Period of a moving average. Price deviations will be relative to this moving average, so as the value is larger, you will catch more significant price deviations and vice versa
Percentage Trigger = Specifies what percentage do you consider as significant.
ATR Period = Settings for a SuperTrend. Specifies a period of an ATR indicator. I like to use values 22 or 34. As the value is higher, the indicator will be generally less sensitive
ATR Multiplier = Also specifies a sensitivity of SuperTrend. As the value is higher, the SuperTrend is going to be less sensitive and vice versa
I would personally encourage you to experiment with the indicator first, so you can decide which inputs are the best ones for your style of trading.
Which markets and Time Frame:
This indicator works best on Forex and can be used on any TF.
It is possible to use it also on other instruments, but the settings has to be adjusted more.

Futures SignalThis is a Futures Signal Indictor works using support & resistance and market trend, it is designed for all type of markets (crypto, forex, stock etc.) and works on all commonly used timeframes (preferably on 5 Min, 15 Min Candles).
How it works Futures Signal Indictor :
Core logic behind this indicator is to finding the Support and Resistance , we find the Lower High (LH) and Higher Low (HL) to find the from where the price reversed (bounced back) and also we use a custom logic for figuring out the peak price in the last few candles. Based on the multiple previous Support and Resistance (HH, HL, LL LH) we calculate a price level, this price level is used a major a factor for entering the trade. Once we have the price level we check if the current price crosses that price level, if it crossed then we consider that as a long/short entry (based on whether it crosses resistance or support line that we calculated). Once we have pre long/short signals we further filter it based on the market trend to prevent too early/late signals. Along with this if we don't see a clear trend we do the filtering by checking how many support or resistance level the price has bounced off.
Stop Loss and Take Profit: We have also added printing SL and TP levels on the chart to make the it easier for everyone to find the SL/TP values. Script calculates the SL value by checking the previous support level for LONG trade and previous resistance level for SHORT trades. Take profit are calculated in 0.5 ratio as of now.
