Reversal Points [CC]This original script was created based on a suggestion from @kerpiciwuasile. My original Reversal Points script was removed because I modeled it after an indicator by Demark, but this script will have no such issues. Reversal points are an exciting concept for me because it is such a useful tool when placing trades. This is my first attempt at a new overall layout for my script and I included a bunch of customization so let me know what you think.
My script works by finding lows that are surrounded by bars that have higher lows and highs that are surrounded by lower highs. I use this logic to find short term lows or highs and I use the same concept to find mid-term lows or highs but a mid-term high is a short term high surrounded by lower short term highs and a mid-term low is a short term low surrounded by higher short term lows. And of course this means that long term highs or lows use the same logic to find highs or lows that are surrounded by mid-term highs or lows. I would recommend to buy at the long term low points or sell at the long term high points.
Keep in mind of course that short term highs and lows are very common and reversal points will get rarer as you look for longer term reversal points. I would recommend to experiment and see which reversal points work best for you and of course, know that there is no magical formula to use for all stocks.
Also there are a few scenarios where you want to enable or disable the inside bar setting. You would want to ignore inside bars if the market is currently very volatile or if you are using this indicator on a crypto chart. This is not an exact science but more of a recommendation, so feel free to experiment with it.
Reversal points are crucial for traders as they signal a potential change in the market trend, providing opportunities for entry or exit.
In summary, this code snippet is a powerful tool for traders to detect and visualize reversal points on a trading chart, providing valuable insights into potential trend changes and facilitating more informed trading decisions.
Let me know if you would like me to publish other scripts or if you want me to do something custom for you!
Reversalpoint

Big Bars DetectorIf a big bar with high volume appears during an uptrend, this may indicate strong buying pressure i.e. the bar acts as support. vice versa, if a big bar with high volume appears during a downtrend i.e. the bar acts as resistance.
How to use ?
It is easy to use whenever the label appears on the candle's high (make sure the candle's color is Red for a bear candle, for example). If a Green bar has a label on its low, simply use the candle's low as support, and vice versa. If the candle's high has a label, consider using it as resistance.
The values display in labels on the top / bottom of the bar is the volume on that particular candle
Hope you like and help in your trading !!!
if any have question / suggestion comment below or just message me.
Thanks and Regards,
TradingTail

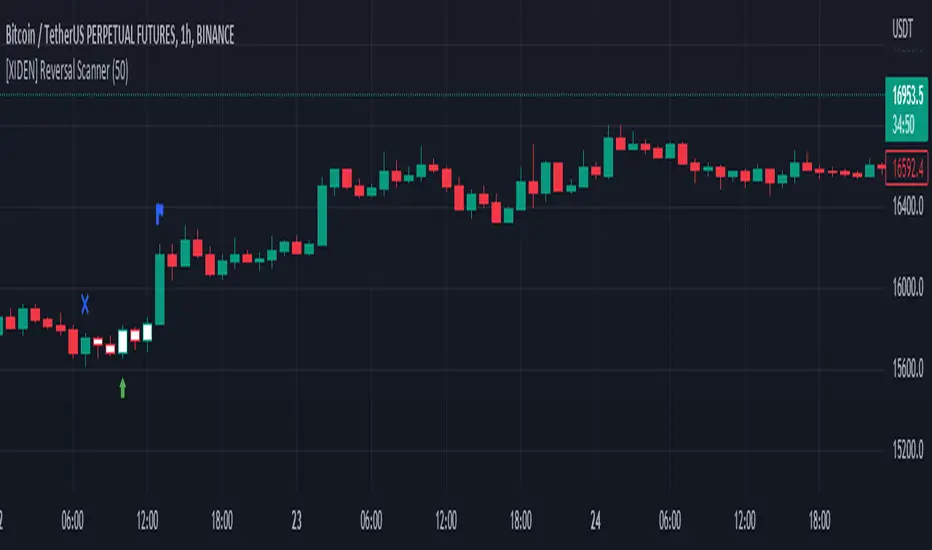
[XIDEN] Reversal ScannerXiden's reversal scanner is based on SMA.
It gives you visual reversal zones and possible entries to enter a reversal trade.
We always try to keep the chart clean, so we didn't go back on visuals, just essentials.
Here is a bullish example:
The blue cross indicates the start of a bullish reversal zone.
The blue flag indicates the end of the bullish reversal zone.
The green arrow marks a possible long entry.
Here is a bearish example:
Again:
The blue cross indicates the start of a bearish reversal zone.
The blue flag indicates the end of the bearish reversal zone.
The red arrow marks a possible short entry.
Don't use this tool as a standalone indicator to trade, always DYOR and use other factors to confirm a possible reversal.
Average Daily Range (ADR) (Multi Timeframe, Multi Period)Average Daily Range (ADR)
(Multi Timeframe, Multi Period, Extended Levels)
Tips
• Narrow Zones are an indication of breakouts. It can be a very tight range as well.
• Wider Zones can be Sideways or Volatile.
What is this Indicator?
• This is Average Daily Range (ADR) Zones or Pivots.
• This have Multi Timeframe, Multi Period (Up to 3 Levels) and Extended Target Levels.
Advantages of this Indicator
• This is a Leading indicator, not Dynamic or Repaint.
• Helps to identify the reversal points.
• The levels are more accurate and not like the old formulas.
• Can practically follow the Buy Low and Sell High principle.
• Helps to keep minimum Stop Loss.
Who to use?
• Highly beneficial for Day Traders
• It can be used for Swing and Positions as well.
What timeframe to use?
• Any timeframe.
When to use?
• Any market conditions.
How to use?
Entry
• Long entry when the Price reach at or closer to the Green Support zone.
• Long entry when the Price retrace to the Red Resistance zone.
• Short entry when the Price reach at or closer to the Red Resistance zone.
• Short entry when the Price retrace to the Green Support zone.
• Long or Short at the Pivot line.
Exit
• Use past ADR levels as targets.
• Or use the Target levels in the indicator for breakouts.
• Use the Pivot line as target.
• Use Support or Resistance Zones as targets in reversal method.
What are the Lines?
Gray Line:
• It the day Open or can be considered as Pivot.
Red & Green ADR Zones:
• Red Zone is Resistance.
• Green Zone is Support.
• Mostly price can reverse from this Zones.
• Multiple Red and Green Lines forms a Zone.
• These lines are average levels of past days which helps to figure out the maximum and minimum price range that can be moved in that day.
• The default number of days are 5, 7 and 14. This can be customized.
Red & Green Target Lines:
• These are Target levels.
What are the Labels?
• First Number: Price of that level.
• Numbers in (): Percentage change and Change of price from LTP (Last Traded Price) to that Level.
General Tips
• It is good if Stock trend is same as that of the Index trend.
• Lots of indicators creates lots of confusion.
• Keep the chart simple and clean.
• Buy Low and Sell High.
• Master averages or 50%.

Swing Failure Reversal StrategyThis strategy is using Swing Failure Patterns as a reversion indicator.
The strategy automatically adapts itself to the timeframe of the current chart.
Swing Failure Pattern occurs when the price trend fails to set new highs in uptrend or meet new lows in a downtrend. This pattern helps traders decide when to enter and exit the market. Usually, traders enter in the downtrend i.e. lower price highs and lower price lows, and exit in the uptrend situation i.e. higher price highs and higher price lows. Thus, traders go against the current trend. This helps the traders take advantage of early trend reversal indicators.
Types of Failure Swing :
Failure Swing Top: This occurs when the stock price goes higher whereas the RSI fails to make a higher high and falls below the recent fail point. The Fail Point is where the RSI line is below the recent swing low. This Failure Swing indicates a short position.
Failure Swing Bottom: This occurs when the stock price gets lower whereas RSI fails to make a lower low and rises over the recent fail point. Fail point is the point where the RSI line is above the recent swing high. This Failure Swing indicates a long position.

RSI MTF Ob+OsHello Traders,
This indicator use the same concept as my previous indicator "CCI MTF Ob+Os".
It is a simple "Relative Strength Index" ( RSI ) indicator with multi-timeframe (MTF) overbought and oversold level.
It can detect overbought and oversold level up to 5 timeframes, which help traders spot potential reversal point more easily.
There are options to select 1-5 timeframes to detect overbought and oversold.
Aqua Background is "Oversold" , looking for "Long".
Orange Background is "Overbought" , looking for "Short".
Have fun :)

CCI MTF Ob+OsHello Traders,
This is a simple Commodity Channel Index (CCI) indicator with multi-timeframe (MTF) overbought and oversold level.
It can detect overbought and oversold level up to 5 timeframes, which help traders spot potential reversal point more easily.
There are options to select 1-5 timeframes to detect overbought and oversold.
Green Background is "Oversold" , looking for "Long".
Red Background is "Overbought" , looking for "Short".
Have fun :)

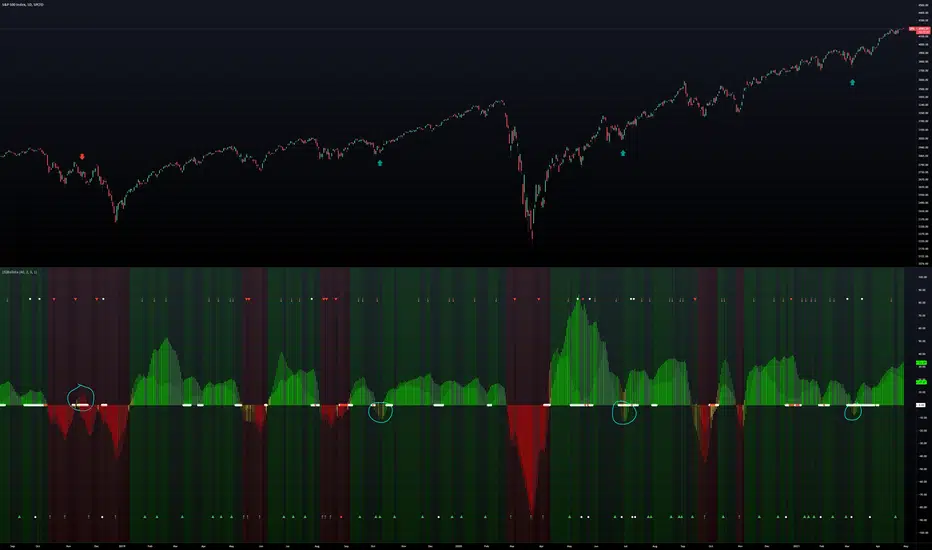
Rainbow Oscillator The Rainbow Oscillator is a technical indicator that shows prices in overbought or oversold areas. That allows you to catch the price reversal point.
---------------
FEATURES
---------------
.:: Dynamic levels ::.
The indicator levels are divided into several zones, which have a fibonacci ratio. Zones determine the overbought/oversold level. Blue and green level zones are better for buying, red and orange for selling. Dynamic levels are used as replacements for classic levels such as -100 and 100 for the CCI indicator or 30 and 70 for the RSI indicator. Dynamic levels work much better than static levels, as they are more adaptive to the current market situation.
.:: Composite oscillator (3 in 1) ::.
The main signal line of the indicator includes all three oscillators RSI, CCI, Stoch in different ratios. In the settings, you can change the proportions or completely remove one of the oscillators by setting its weight to 0
.:: CCI + RSI + Stoch ratio setting ::.
Each of the oscillators has its own weight in the calculation formula: w2 * cci ( + w1 * ( rsi - 50) + (1 - w2 - w1) * ( stoch - 50), this allows you to create the resulting oscillator from all indicators, depending on the weight of each of them. Each weight value must be between 0 and 1 so that the sum of all weights does not exceed 1.
.:: Smoothing levels and lines of the oscillator ::.
Smoothing the oscillator readings allows you to filter out the noise and get more accurate data. Level offset allows you to customize the support for inputs.
.:: Market Flat ::.
Dynamic creation of levels allows you to find in the price reversal zone, even when the price is in a flat
.:: Sources ::.
You can change the data source for the indicator to the number of longs and shorts for the selected asset. For example, BTCUSDLONGS / BTCUSDSHORTS is perfect for Bitcoin, then the oscillator will work on this data and will not use the quote price.
.:: Trend Detection ::.
The main line of the oscillator has 2 colors - green and red. Red means downtrend, green means uptrend. Trend reversal points are most often found in overbought and oversold zones.
.:: Alerts ::.
Alerts inside for next events: Buy (blue point) Sell (red point) and TrendReversal (change line color)
----------------
TRADING
—-------------
There are several possible entry points for the indicator, let's consider them all.
1) Trend reversal.
Long entry: The indicator line is in the green zone below 0 (oversold), while the line changes color from red (downward) to green (upward)
Short entry: The indicator line is in the red zone above the 0 (overbought) mark, while the line changes color from green to red.
2) Red and blue dots.
Long entry: Blue dot
Short Entry: Red Dot
I prefer to use the first trading method.
----------------
SETTINGS
----------------
.:: Trend Filter (checkbox) ::.
Use trend confirmation for red/blue dots. When enabled, the blue dot requires an uptrend, red dot requires downtrend confirmation before appearing.
.:: Use long/shorts (checkbox) ::.
Change formula to use longs and shorts positions as data source (instead of quote price)
.:: RSI weight / CCI weight / Stoch weight ::.
Weight control coefficients for RSI and CCI indicators, respectively. When you set RSI Weight = 0, equalize the combo of CCI and Stoch , when RSI Weight is zero and CCI Weight is equal to the oscillator value will be plotted
only from Stoch . Intermediate values have a high degree of measurement of each of the three oscillators in percentage terms from 0 to 100. The calculation uses the formula: w2 * cci ( + w1 * ( rsi - 50) + (1 - w2 - w1) * ( stoch - 50),
where w1 is RSI Weight and w2 is CCI Weight, Stoch weight is calculated on the fly as (1 - w2 - w1), so the sum of w1 + w2 should not exceed 1, in this case Stoch will work as opposed to CCI and RSI .
.:: Oscillograph fast and slow periods ::.
The fast period is the period for the moving average used to smooth CCI, RSI and Stoch. The slow period is the same. The fast period must always be less than the slow period.
.:: Oscillograph samples period::.
The period of smoothing the total values of indicators - creates a fast and slow main lines of the oscillator.
.:: Oscillograph samples count::.
How many times smoothing applied to source data.
.:: Oscillator samples type ::.
Smoothing line type e.g. EMA, SMA, RMA …
.:: Level period ::.
Periodically moving averages used to form the levels (zone) of the Rainbow Oscillator indicator
.:: Level offset ::.
Additional setting for shifting levels from zero points. Can be useful for absorbing levels and filtering input signals. The default is 0.
.:: Level redundant ::.
It characterizes the severity of the state at each iteration of the level of the disease. If set to 1 - the levels will not decrease when the oscillator values fall. If it has a value of 0.99 - the levels are reduced by 0.01
each has an oscillator in 1% of cases and is pressed to 0 by more aggressive ones.
.:: Level smooth samples ::.
setting allows you to set the number of strokes per level. Measuring the number of averages with the definition of the type of moving averages
.:: Level MA Type ::.
Type of moving average, average for the formation of a smoothing overbought and oversold zone

RSI true swingsRelative Strength Index (RSI) is being used by majority of the traders to get benefitted based on the swings. But these swings are hard to Identify.
This Indicator uses 4 major factors for finding the potential reversal points:
RSI Crossover or crossunder
Relative volume
Overall volume against the moving average volume
Relative closing of the candles
Size of the bars
Please read Instructions carefully before using this indicator
Recommended entry is the OHLC4 of the signal bars.
If signal bar is too large, try to enter in the retracement when another signal comes either through indicator or through types of bars
when signals comes opposite to the trend, then try to wait for the next signal of same type. This creates a RSI-price divergence in confirmation by volume price action
Timeframe can be of your choice
Recommended stoploss should be swing highs or lows

Reversal zone finderThis script would find potential reversal price zones according to RSI over bought or sell condition and big reversal candle.
It works better in range markets and lower time frames like 5M and especially in Support/Resistance zones.
Suit for scalping in forex or crypto markets.
* Use it as a trade assistant not a trade signal!

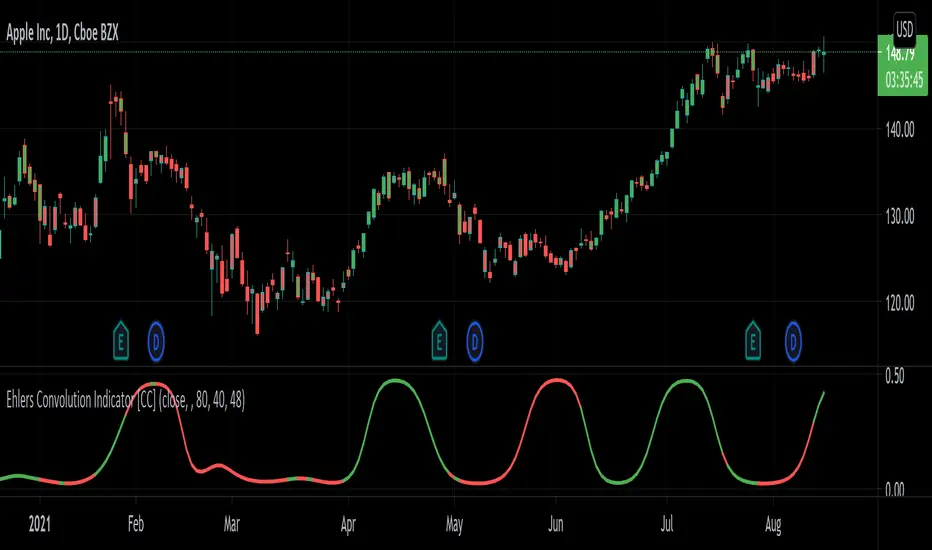
Ehlers Convolution Indicator [CC]The Convolution Indicator was created by John Ehlers (Cycle Analytics For Traders pgs 170-174) and this is version of an indicator to find potential reversal points. The idea behind this indicator is to use a variation of his AutoCorrelation Indicator that transforms the data using digital signal processing and as you can see it looks very similar to his BandPass Filter . The idea is that when this indicator peaks then it has reached a potential reversal point and so the stock may continue in the current direction but most of the time this indicator correctly points out the reversal points. I have included normal buy and sell signals but generally speaking you would want to buy when the indicator is around 0.05 to 0.10 and moving up and sell when it reaches its peak and is starting to move down.
Let me know if you have any other scripts you would like to see me publish!
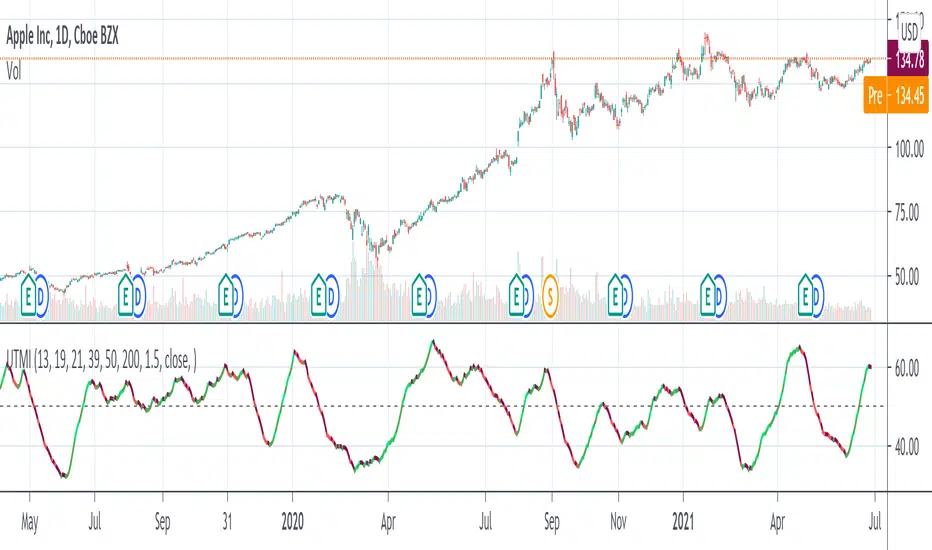
Ultimate Momentum Indicator [CC]This is a custom indicator of mine loosely based on the work by Steve J Godwin & Louisa C Schneider (Stocks and Commodities Feb 2021 pg 22) and this works pretty well at anticipating future price swings as the momentum falls. The idea I was going for was to introduce the idea of reversals in combination with a momentum indicator so you can better identify peaks and valleys. I have included strong buy and signals in addition to normal ones so darker colors are the strong buy and sell signals and lighter colors are the normal ones. I would recommend to buy when the line turns green and sell when it turns red.
Let me know if there are any other indicators you would like me to publish!
Folded Relative Strength Index [CC]The Folded Relative Strength Index was created by Richard Poster (Stocks and Commodities July 2021 pg 21) and this indicator provides both trend strength but also momentum and of course reversal points using the overbought and oversold markers. If the indicator line is above the mid line then this shows upward momentum and when it falls below the midline then this means it is losing momentum. When the indicator rises above the signal line then this shows upward trend strength and vice versa. Buy when the indicator line turns green and sell when it turns red.
Let me know if there are any other indicators you would like to see me publish!

STOCH RSI DOTSThis Indicator will display dots when the stochastic RSI is either below or above the oversold/overbought threshold.

(JS) BallistaAlright so this is a script I made by combining two existing ones and making a really cool discovery that has proven very useful.
You'll notice that there are two separate oscillators that are laid on top of each other. The background oscillator is my "Tip-and-Dip" oscillator which you can see here (will refer to this as TnD from here), and the foreground oscillator from the Squeeze , which can be viewed here .
Initially I just wanted to see how they interacted with one another and compare them, but this led to some pretty interesting observations.
First let me go through the options real quick to get that out of the way, though it is mostly self-explanatory.
Lookback Period defines the amount of bars used for the TnD oscillator.
Smoothing Value smooths out the TnD output.
Standard Deviations is used to calculate the TnD formula.
Color Scheme is preset BG colors.
Using Dark Mode changes colors based on dark mode or not.
Squeeze Momentum On turns the Squeeze in the foreground off and on.
Arrows Off turns the arrows on the indicator off and on.
Now to explain the indicator a bit more. I have the default lookback period as 40 due to the Squeeze being 20, which makes the TnD oscillator the "slow" output with the Squeeze being the "fast" output.
Some initial observations were that when both the Squeeze and the TnD are moving in the direction, when the Squeeze is higher (uptrend) or lower (downtrend) it seems to indicate strength in the move. As the move loses steam you'll notice the Squeeze diverge from the TnD.
However, the most useful thing I discovered about the interaction between these two indicators is where the name for it came from. So if you aren't familiar with what a Ballista is, per Wikipedia, "The ballista... sometimes called bolt thrower, was an ancient missile weapon that launched either bolts or stones at a distant target." There are instances where the Squeeze seems to get ahead of itself and gets too far away from the TnD (which is the long term trend between the two). The key thing to look for is an "inverted squeeze" - this is when the squeeze oscillator ends up flipping against the TnD. When this occurs there is an extremely high probability that you'll see price shoot back the opposite way of the Squeeze.
I've been using this setup myself for about a year now and have been very satisfied with the results thusfar. I circled some examples on the SPX daily chart here to show you what I mean with the inverted Squeeze shooting back.
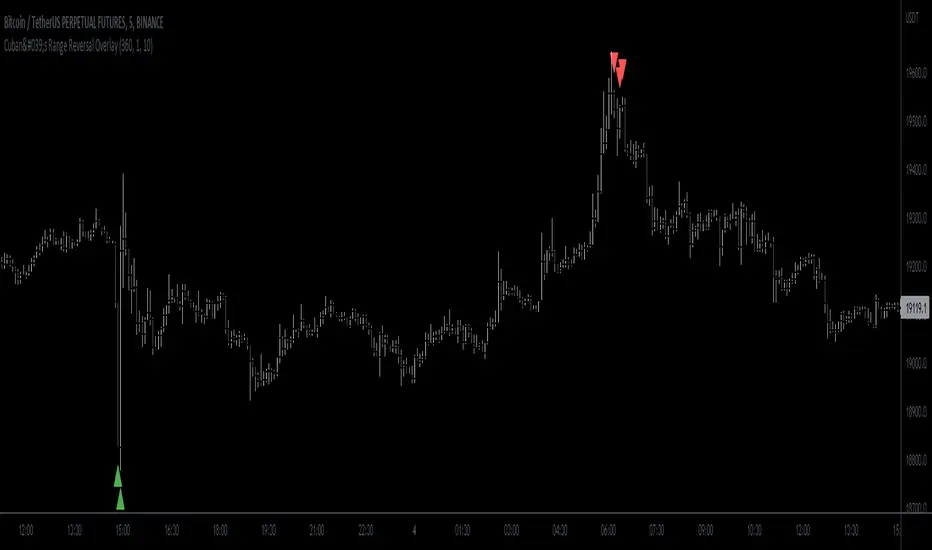
Cuban's Range Reversal OverlayBeen a minute since a public script!
This one looks at the range and recommends potential reversal depending on degree of overextension.
Originally intended for low timeframe short time horizon reversals but works well on higher timeframes as well.
Oscillator included in the image so you can see under the skirt and check what's happening.
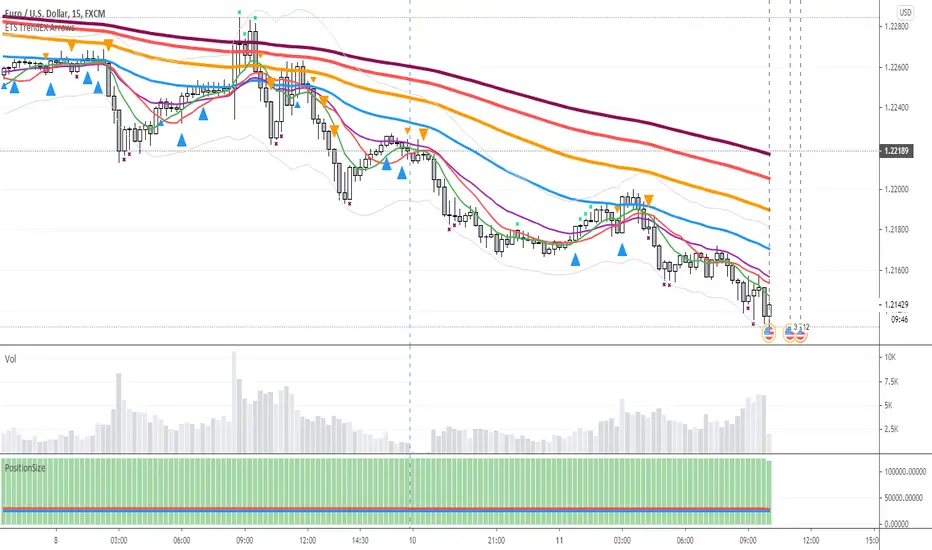
ETS Trend Early Cross ArrowsThis indicator is an updated version and alternative to the ETS Trending Arrows indicator that contains the results of years of trial and error to create an indicator aiming to mimic market entry points that a professional trader would take.
It has arrows to clearly show potential market entry points, and suggested stop-loss levels. This particular updated version of the Trending Arrows indicator responds faster to market direction changes, even before the main trend starts to change.
To use this indicator in the best way, with the best entry point, wait for the market to return close to, or touch, one of the moving averages. The larger the moving average, the better, and then enter in the direction indicated by the arrow. The arrow will not repaint once the bar closes, so use the initial arrow's appearance to prepare yourself to enter a trade, and then wait for your perfect entry that is close to a moving average or support/resistance level.
What Makes It So Powerful?
- Give you a signal as early as possible and does not "repaint" once the bar completes
- Reacts to fast market direction changes like a master trader
- Is super easy to understand and implement in your trading
- Can be used for Forex, Stocks and Crypto
- Works on all timeframes
How To Use The ETS Trend Early Cross Arrows (ETS TrendEX Arrows) Indicator
1. Add the indicator to any chart you wish to trade, Crypto, Forex or Stocks and set it to the timeframe you prefer. For instance, I use it on 1 minute and 5 minute charts for daytrading Stocks. For Forex I generally use a 15 minute chart, and longer timeframes for Crypto.
2. Open the Settings. Generally you should not need to change anything:
2.1. "Show 20, 50, 200 Moving Averages" - This is just a convenience, and is provided to help you identify where the market is trading in relation to the trend.
2.2. "Show Small Expo Moving Average" - Also provided for convenience, and goes with "SMAX" - Simple Moving Average - and the "EMAX" - Exponential Moving Average settings
2.3. "Show Potential Reversal Points" - You will notice small X indicators that appear when it's detected that the market might soon be reversing or at least halting and going sideways. A small red X at the bottom of a candle indicates that the market might not be moving further down much, warning you against taking a short position. While a small green X above a candle indicates that the market may be exhausted and soon reverse or at least stall. When the market eventually goes past the highs and lows indicated by these levels, the market often continues on its previous trend.
2.4. "Delength" - The length setting for the DeMarker indicator that's used internally.
2.5. "KC Length" - the Keltner Channel length setting.
2.6. "KC Multiplier" - the Keltner Channel multiplier setting.
2.7. "KC Source" - the Keltner Channel source setting.
2.8. "KC Exponential" - the Keltner Channel exponential or simple setting.
3. Now that you've set things up, all you need to do is to wait for a signal. Pay attention to where the market currently is in relation to the closest moving average, like the 10 SMA or 12 EMA . Keep in mind that price will often signal a new move, but then first move back to the average, before continuing in the new direction identified by the trading arrow.
4. Larger arrows are signals that go with the shorter term trend, and smaller arrows indicate a potential change in the market direction that is not yet in line with the shorter term trend. Typically it should be best to enter using the larger arrows, and be cautious, or exit a trade, that is counter to the smaller arrows.
5. These signals are intended to identify new trending moves, and for that reason, if the market moves against the signal, you should not hold on to your position hoping that it will turn in your favor.
6. When the market is moving in your favor, resist the urge to exit quickly, and use the smaller moving averages or support/resistance levels to exit your trades.
This is an "invite only" script, which means that you will need to let me know that you're interested in it before you can get access to it. This is a paid script, please follow the link in my profile to get the details or ask me directly. It may take up to 48 hours for me to respond, but I do my best to respond as quickly as possible. You will get 7 days to test it for yourself on all your charts with no restrictions.
Sniper RSniper entry can be used on any time frame and is a continuous process of possible trend changing signals based on pure price action.
This script is a depiction of a change in trend and not a recommendation from the publisher. Do consult your financial advisor if you need to get into a trade. It is not a recommendation to trade and needs to be used as a reference along with other analysis that you may already be doing currently.
Sniper entry is a graphical expression in terms of a trend change based on price action only. You may want to combine this with other indicators to bring out best results as per need.
Sniper entry can be used on a multi time frame and is not limited to one trading day and can continue into the next day to depict a change in trend.
Note: This is not a recommendation of a buy or a sell but a study of most recent trends depending on time frame selected. Please do contact your financial advisor before placing the trade.
Trade smart, trade right.
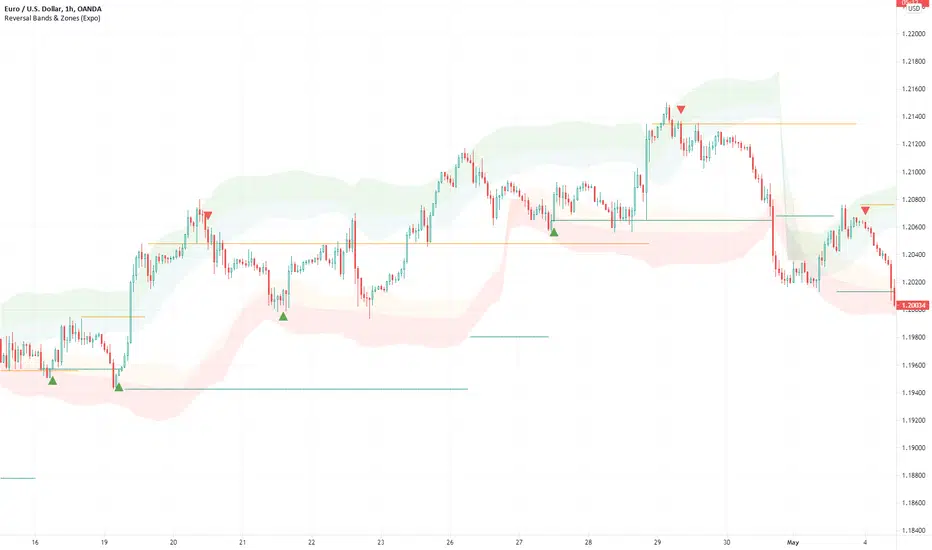
Reversal Bands & Zones (Expo) "It has never been easier to find high probability trades"
Reversal Bands & Zones (Expo) is an algorithm that analyzes the market in real-time and identifies reversal points, key market zones, and trends. The advanced and unique reversal bands act as support & resistance zones, and together with the trend tracking feature, it serves as a trend confirmation. The real-time market zones are displayed where there is a high probability of finding support/resistance. The algorithm does also map out key pivot levels based on the current market structure.
> Reversal points and key market zones have alerts.
Real-time
No repainting
Works on any market and in any timeframe
The indicator can be used standalone or as a part of your current trading strategy.
☖ Reversals
The algorithm identifies areas of potential turning points, these are displayed as Upper and Lower Reversal Cloud. When the price hits the cloud and bounces off there is a high probability that the price will reverse. If the price stays in the reversal cloud, there is a high probability that a trend is forming.
☖ Trends
Positive Trend: If the price is in or close to the upper green reversal band and above the trend- tracking line, we can be sure that the market is in a positive trend until the price crosses down from the reversal cloud and the trend tracking line.
NegativeTrend: If the price is in or close to the lower red reversal band and below the trend- tracking line, we can be sure that the market is in a negative trend until the price crosses up from the reversal cloud and the trend tracking line.
☖ Zones
"It hasn't been easier to display, in real-time, one of the most important and useful technical analysis, namely key support and resistance zones"
The algorithm analyzes the market structure in real-time and maps out key supply/resistance and demand/support zones. The user gets an instant understanding of the market structure. Support and resistance can be used to determine the range of a market, to trade reversals, bounces, or breakouts.
☖ Pivots
The indicator does also displays key pivot levels. Pivots can be used to determine the range of a market, to trade reversals, bounces, or breakouts.
HOW TO USE
- Use the indicator to identify reversals.
- Use the indicator to identify the range of the market.
- Use the indicator to identify key support/resistance zones.
- Use the indicator to identify trends.
INDICATOR IN ACTION
1-hour chart
I hope you find this indicator useful , and please comment or contact me if you like the script or have any questions/suggestions for future improvements. Thanks!
I will continually work on this indicator, so please share your experience and feedback as it will enable me to make even better improvements. Thanks to everyone that has already contacted me regarding my scripts. Your feedback is valuable for future developments!
-----------------
Disclaimer
Copyright by Zeiierman.
The information contained in my scripts/indicators/ideas does not constitute financial advice or a solicitation to buy or sell any securities of any type. I will not accept liability for any loss or damage, including without limitation any loss of profit, which may arise directly or indirectly from the use of or reliance on such information.
All investments involve risk, and the past performance of a security, industry, sector, market, financial product, trading strategy, or individual’s trading does not guarantee future results or returns. Investors are fully responsible for any investment decisions they make. Such decisions should be based solely on an evaluation of their financial circumstances, investment objectives, risk tolerance, and liquidity needs.
My scripts/indicators/ideas are only for educational purposes!
ACCESS THE INDICATOR
• Contact me on TradingView or use the links below
Ema-Weighted-GainStrategy Inputs: Capital=$10,000, Pyramiding=3, Default Quantity=1
Please note that the strategy buys when the WMA (Blue line) cross under zero and sell above it, your experience is very important in using this indicator. Do not follow the buy/sell signals. Read the plot as I explain in the Uses Section and make your own conclusion on how to use it.
Description,
This Strategy uses multiple Ema’s to calculate Weighted HPR's.
I have calculated the weight numbers based on Fibonacci.
Uses:
NOTE!! (Please Do not take those uses to be 100% Guaranteed. User your experience and judgment to decide your trade).
Zoom out to see all the arrows
White line (MA)
Blue line (WMA)
First
Ride Trends,
1-Downtrend: short
a-MA IS going down
b-Entry: WMA cross above or near the MA (White Arrows).
2-Uptrend:long
a-MA is going up
b-Entry: WMA goes below MA or Near it(Green Arrows).
Second
Trend Reversal
1-buy entry.
WMA at zero, or very close to it, in pullback (Yellow Arrows).
2-short entry
WMA at zero, or very close to it, in a bounce (Orange Arrows).
Third
Divergence as explained in the Red Arrows.
Conclusion,
Red Arrows= Divergence
Green Arrows= Buy entry (The stock is in uptrend)
Yellow Arrows= Buy entry (the stock is in downtrend and could reverse)
White arrows= short entry (the stock is in downtrend)
Orange arrows=short entry (the stock in uptrend and can reverse)
If you are interested, send a private message

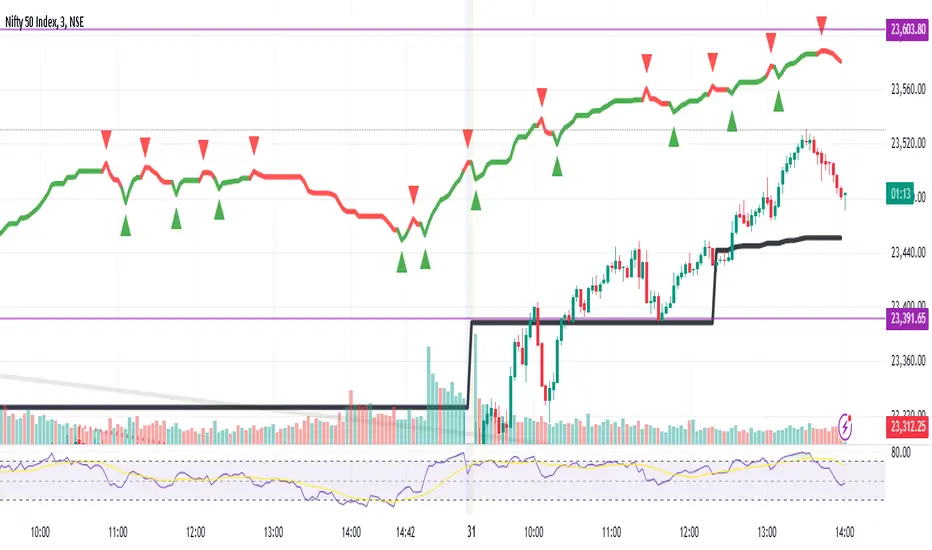
Tradingedge Academy REVERSAL CATCHER (RECAT)Core idea behind designing this tool is to CATCH REVERSALS in the live market.
Reversal can be a TREND REVERSAL or a TEMPORARY PULL BACK. This tool works perfectly in both situations.
HOW TO USE:
AFTER YOU APPLY THE SCRIPT.
1. WAIT FOR THE FORMATION BLUE/YELLOW COLOURED BARS AT DAY HIGH/LOW.
Accuracy is highest when the REVERSALS are caught at DAY HIGH/LOW. I would suggest you to work only on DAY HIGH/LOW candles.
Do not jump into the trade. Wait for the candle to close.
2. BLUE represents the start of a BEARISH TREND or simply "SELL SIGNAL".
YELLOW represents the beginning of a BULLISH TREND or simply "BUY SIGNAL".
3. If the BLUE candle is formed at DAY HIGH.
SELL below it's LOW with DAY HIGH as Stoploss. (Keep some BUFFER).
If the YELLOW candle is formed at DAY LOW.
BUY above it's HIGH with DAY LOW as Stoploss. (Keep some BUFFER).
4. TARGET
Risk : Reward = 1:1
Trail Stoploss for 1:2, 1:2.5, 1:3
NOTE:
RECAT can be used in any timeframe. However, lower timeframes tend to have more noise as compared to 15mins and above.
RECAT can be used with all the SCRIPTS. However, high volume scripts give better results.
THERE IS ABSOLUTELY NO REPAINTING AFTER THE CANDLE IS CLOSED.
CONTACT ME FOR ACCESS.
DETAILS IN SIGNATURE.

ETS MA Deviation ExtremesWhile trading, I noticed that emphasis is often placed on how far price has moved from the moving average (whichever a trader prefers). In these cases I also found that Bollinger Bands only sometimes played a factor in determining whether price had moved "too far" from the moving average to potentially result in a sharp move back to the average.
Because I wanted something more objective than a "gut feeling" that price has moved away from the average enough to make it move back, I decided to see what I could do to determine the standard deviation of how price action moved away from the average , in order to determine when it could potentially have a "rubber band effect" to jump back to the "norm". The result of that is the ETS MA Deviation Extremes indicator, and I hope that it will help you in your trading.
The indicator also has bar coloring included, which can be turned off, which gives a good on-chart visual to warn you that the price action might reverse. This has often helped me to be a bit more cautious before just jumping into a trade that might be on the brink of reversing and taking my position out, and it actually turned out to be a good indicator for a reversal trade strategy.
The histogram bars give an indication of how far the price has moved away from the average, and I look for a potential reversal as soon as the histograms move back inside the deviation lines after having been outside it. The bar coloration actually depend on more than one set of deviation lines, but putting all of that on the chart just makes it confusing, so I removed the ones that I felt were not essential to make it clearer.
I hope it helps you in your trading and makes it easier for you to trade successfully!

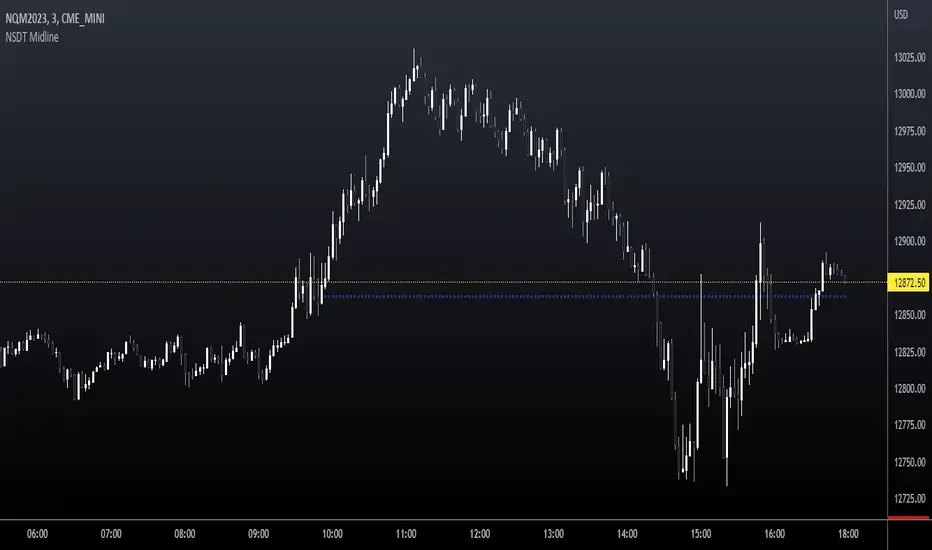
NSDT MidlineSimple script to plot the Midpoint between the High and Low of day for intraday trading. This is a key level that is respected quite often. Very easy to trade bounces or breakthroughs.