EMA13-EMA21 Difference Indicator# EMA13-EMA21 Difference Indicator
## Description
This indicator calculates the difference between the 13-period Exponential Moving Average (EMA13) and the 21-period Exponential Moving Average (EMA21), helping traders visually assess short-term market momentum.
**Core Logic:**
- When the difference is positive (green), the short-term EMA is above the long-term EMA, indicating a bullish trend
- When the difference is negative (red), the short-term EMA is below the long-term EMA, indicating a bearish trend
- Crossovers of the zero line can serve as potential trend reversal signals
**Use Cases:**
- Trend direction identification
- Momentum strength analysis
- Entry and exit timing assistance
**Disclaimer:**
This indicator is for reference only. It is recommended to combine it with other technical analysis tools for comprehensive judgment. This does not constitute investment advice.
Regressions

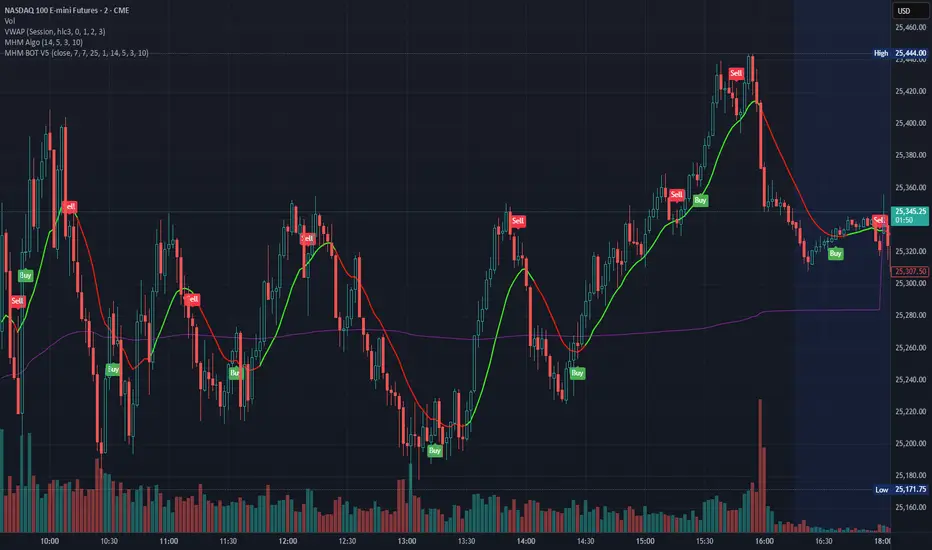
MHM BOT V5Proprietary algorithm based indicator providing clear buy / sell signals which do not repaint. Perfectly suited for scalping tickers with high liquidity and volatility. Perfectly suited for scaling NQ or ES.
TDZZ ETH 15min Vault: No-Loss Martin Gale StrategyStrategy Overview
The ETH 15min Vault is an enhanced, high-frequency Martin Gale strategy designed specifically for Ethereum on the 15-minute chart. Its core innovation lies in integrating pre-calculated margin management with a multi-layer exit system, transforming the traditional high-risk Martingale approach into a controlled, calculated growth engine. The strategy aims for sustainable compound growth of small capitals (e.g., 1000U) in ranging markets while systematically eliminating the risk of account blow-up.
Core Concept: The "No-Loss" Guarantee
Unlike conventional Martingale systems that risk infinite losses, this strategy pre-calculates and logically reserves the total margin required for all potential layers (configurable, e.g., up to 30) at the initial entry. This ensures sufficient capital is always available for the next averaging order, preventing liquidation due to margin shortage. Combined with intelligent, proactive take-profit and safety-net closures, it creates a theoretically "No-Loss" framework for the Martin Gale method.
Key Mechanisms
1、Smart Position Averaging:
Averaging distances expand geometrically (configurable multiplier), preventing rapid layer depletion during sharp drops.
Averaging order size increases progressively (configurable multiplier) to effectively lower the break-even point.
2、Dynamic Multi-Stage Exit Logic:
Rebound TP: Partially closes a position when price rebounds a certain percentage from its entry, locking in profits early during oscillations.
Cycle TP: Closes the remaining position upon reaching the primary profit target, which is dynamically recalculated after each average to reflect the new aggregate cost.
Safety-Net Close (Defense Mode): Activates after a defined number of averages. Triggers a full exit if price: a) rallies significantly from the lowest point, b) retraces from a recent high, or c) fails to make a new low within a set time. This forms the final protective layer for capital preservation.
Main Advantages
✅ True Risk Isolation: Transforms Martingale's "unlimited risk" into a "defined and manageable drawdown" via pre-calculated margins and safety-net exits.
✅ Active Profit Capture: The "Rebound TP" mechanism increases win rate and capital efficiency in ranging markets.
✅ Adaptive to Volatility: Adjustable parameters for averaging distance and size allow tuning for different market conditions.
✅ High-Frequency Compounding Potential: Operates on the 15-min timeframe, offering numerous opportunities to complete profit cycles in consolidating phases.
Configuration & Parameters
Key adjustable inputs include: Initial Capital %, Averaging Distance % and Multiplier, Order Size Multiplier, Max Layers, Take-Profit %, Rebound Close %, and all Defense Mode thresholds.
This strategy significantly reduces liquidation risk through its design but does not eliminate trading risk. Substantial drawdowns can occur during strong, sustained trends. "No-Loss" refers to prevention of margin-call liquidation, not guaranteed profitability. Always conduct thorough backtesting and forward testing in a simulated environment before committing real capital. Past performance is not indicative of future results. Trade responsibly.

Box Indicator - Auto Draw Previous Day's - High / Midline / LowThis indicator draws a box around the previous day’s high and low, calculates the midline, and displays them on the current day’s chart. It helps visualize key support/resistance levels from the prior trading day.
This script gives you a static reference box from the prior day’s trading range, including a midpoint. It’s useful for spotting potential reversal zones, breakout levels, or intraday targets based on yesterday’s price action.

wally H4 Rango Dominante + scanner X20ENGLISH
This script marks the range of the last largest candlestick. You can configure the number of candlesticks to search for the range!
Once it mitigates a high or low and re-enters the range, a signal label appears!
You can lower the timeframe to look for entry confirmation!
It comes with a scanner for 20 manually configurable currencies!

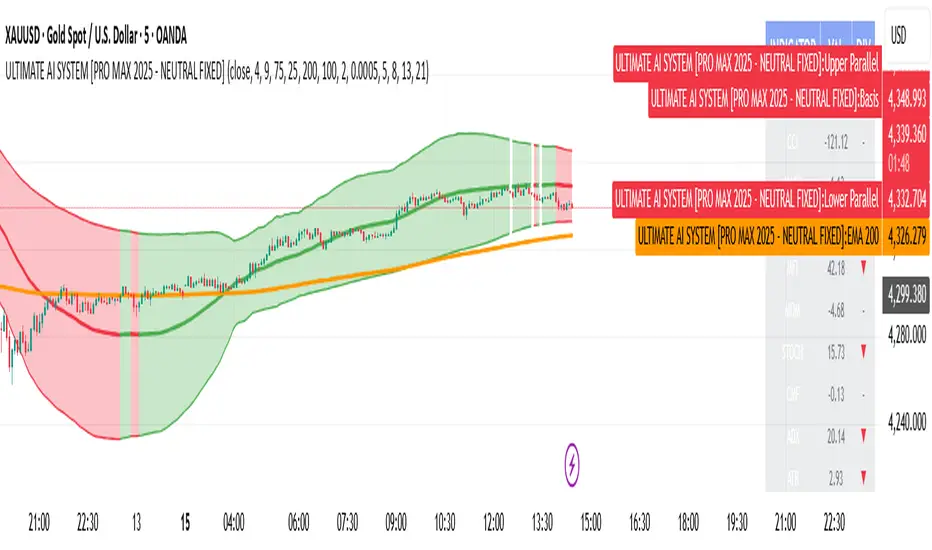
ULTIMATE AI SYSTEM [PRO MAX 2025 - NEUTRAL FIXED]🚀 Overview
The ULTIMATE AI SYSTEM is a next-generation trading toolkit designed to identify high-probability reversal setups within established trends. This Parallel Edition introduces a dynamic Linear Regression Channel combined with a powerful Multi-Divergence Engine capable of scanning 14 different oscillators simultaneously.
🔥 Key Features
1. Parallel Linear Regression Channel
This is the core of the trend filtering system. Unlike standard regression channels:
• Parallel Bands: The upper and lower bands are perfectly parallel to the baseline, calculated using Standard Deviation (Deviation 2.0 default).
• Dynamic Trend Coloring: The channel automatically changes color based on the slope:
• 🟢 Green: Uptrend (Bullish Bias)
• 🔴 Red: Downtrend (Bearish Bias)
• Mean Reversion Logic: It helps filter out trades that are over-extended (e.g., buying at the top of the channel).
2. AI Multi-Divergence Engine
The script scans 14 Indicators simultaneously across Fibonacci Lookback Periods (5, 8, 13, 21 candles) to find hidden momentum shifts.
• Indicators Scanned: RSI, CCI, MACD, OBV, MFI, MOM, STOCH, CMF, ADX, ATR, WPR, ROC, TSI.
• Algorithm: A signal is only triggered if a user-defined minimum number of indicators (default: 4) show divergence at the same time.
3. Smart Filtering Layer
To reduce false signals, every trade must pass 5 layers of confirmation:
1. Trend Filter: Price must be above/below the EMA 200 (optional).
2. Regression Filter: Buy signals are validated only if price is within the safe zone of the Linear Regression Channel.
3. RSI Guard: Prevents buying in Overbought or selling in Oversold conditions (optimized 75/25 levels).
4. Candle Validation: Buys require a Green candle; Sells require a Red candle.
5. Lookback Confirmation: Uses Fibonacci sequences to validate divergence strength.
4. Pro Dashboard
A real-time table on the chart displays:
• Current value of all oscillators.
• Live Divergence status (▲ for Bullish, ▼ for Bearish).
• Overall Market Sentiment score.
🛠 How It Works
• LONG (BUY) Signal:
1. Market Sentiment is Bullish (Minimum 4 indicators showing bullish divergence).
2. Price is above EMA 200 (Trend Confirmation).
3. Linear Regression Slope is Positive (or price is at the channel bottom).
4. RSI is below 75 (Not Overbought).
5. Candle closes Green.
• SHORT (SELL) Signal:
1. Market Sentiment is Bearish (Minimum 4 indicators showing bearish divergence).
2. Price is below EMA 200 (Trend Confirmation).
3. Linear Regression Slope is Negative (or price is at the channel top).
4. RSI is above 25 (Not Oversold).
5. Candle closes Red.
⚙️ Settings
• Min Confirmations: Number of indicators required to trigger a signal (Default: 4).
• Regression Length: Length for the Linear Regression Channel (Default: 100).
• Channel Deviation: Width of the parallel channel (Default: 2.0).
• EMA Filter: Toggle EMA 200 filtering On/Off.
• Lookback Periods: Customizable Fibonacci sequence for divergence detection.
⚠️ Disclaimer
This script is for educational and analytical purposes only. No indicator guarantees 100% accuracy. Always use proper risk management and combine signals with your own price action analysis.
Code Author:
Version: PRO MAX 2025 - PARALLEL EDITION
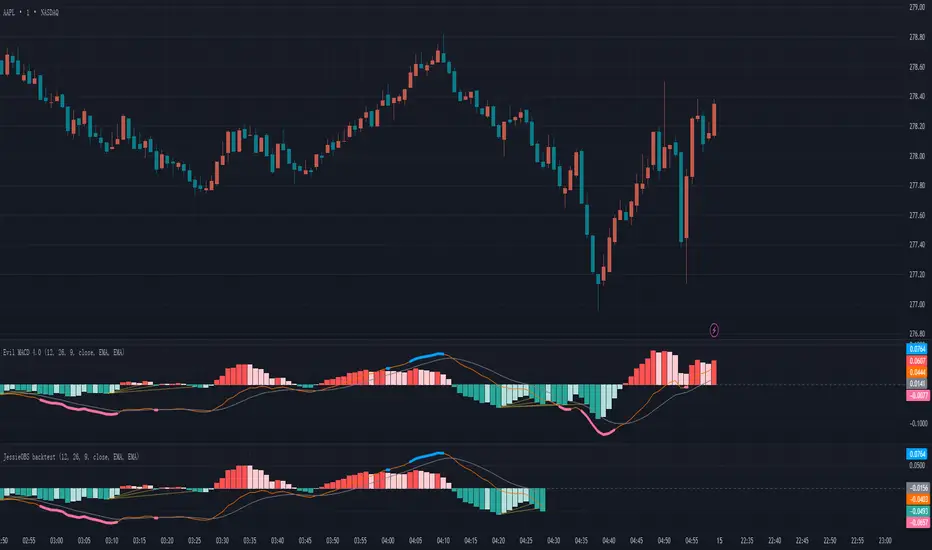
JessieOBS The Evil MACD for back testingJessieOBS – Reversal Early Warning Tool (Backtest Version)
1. Reversal Early Warning
This indicator highlights areas with the highest probability of trend reversal using thick red and blue lines.
Blue lines indicate a potential downward reversal
Red lines indicate a potential upward reversal
Instead of marking a single point, JessieOBS focuses on identifying high-probability reversal zones.
2. Sideways Market Filtering
One major weakness of many traditional indicators is their inability to filter out sideways (range-bound) markets.
JessieOBS is designed to address this issue: during consolidation phases, red and blue warning zones appear far less frequently, helping traders avoid low-quality signals and reduce noise.
3. Left-Side Signal for Advanced Analysis
JessieOBS is a left-side indicator, meaning it provides early warnings before confirmation.
Signals are often shown as a zone rather than a precise entry point. To refine entries, users are encouraged to combine JessieOBS with their own trading systems, such as:
Divergence-based strategies
Smart Money Concepts (SMC) analysis
The Theory of Entanglement structures
Different traders use different methods, and JessieOBS works as a powerful tool to enhance the accuracy and confidence of many analytical approaches.
4. Backtesting-Focused Version
This version is specifically designed for historical analysis and backtesting.
Recent data is intentionally hidden, while historical signals remain visible, making it suitable for building, evaluating, and refining trading systems.
5. Real-Time Signals
For real-time trading signals, please refer to JessieOBS with MACD – The Evil MACD 3.0.
Numanti - FairRate EUR/USD Fair ValueFairRate | EUR/USD Fair Value Indicator
Know When EUR/USD Is Overpriced or Underpriced
Price tells you where the market *is*. Fair value tells you where it *should be*.
EUR/USD doesn't move randomly. Interest rates, yield curves, risk appetite, and equity flows drive where the pair trades over time. When price strays too far from these fundamentals, it tends to snap back.
FairRate shows you exactly how far price has strayed.
How It Works
The indicator calculates a fair value for EUR/USD based on macroeconomic variables updated weekly. It then measures the deviation between current price and fair value in standard deviations (the z-score).
> +2σ --> EUR significantly overvalued — watch for pullback
+1σ to +2σ --> EUR above fair value
-1σ to +1σ --> Near equilibrium
-1σ to -2σ --> EUR below fair value
< -2σ --> EUR significantly undervalued — watch for bounce
The bigger the deviation, the stronger the fundamental pressure for mean reversion.
What You See on the Chart
- Fair Value Line — Where EUR/USD "should" be trading
- ±1σ and ±2σ Bands — Normal and extreme deviation zones
- Info Panel — Current fair value, z-score, and signal status
When price pushes into the outer bands, fundamentals are stretched. That's where opportunities often emerge.
Model Quality
This isn't a typical indicator or curve-fitted approach. It's a proper econometric model:
- R² > 80% — Fundamentals explain most of EUR/USD movement
- Out-of-sample validated — Works on data the model never saw
- Updated weekly — Fresh estimates every Friday
- Research-backed — Methodology documented in white paper
How Traders Use It
Mean Reversion
When z-score hits extreme levels (±2σ), look for reversal setups. Combine with your technical analysis for entries.
Trend Confirmation
If price is trending AND fundamentals support it (z-score moving in trend direction), that's a stronger move.
Risk Filter
Avoid counter-trend trades when z-score is near zero — there's no fundamental reason to expect a reversal.
Context Layer
Add fundamental context to pure price action. Know whether you're trading with or against the macro backdrop.
### What This Is NOT
- Not a buy/sell signal generator
- Not a timing indicator
- Not a substitute for technical analysis
FairRate is a fundamental layer — one piece of the puzzle that tells you whether EUR/USD is cheap, expensive, or fairly priced right now.
The Model
Built on peer-reviewed econometric methodology. The model captures the fundamental drivers that institutional desks use to assess currency valuation — not a black-box indicator or curve-fitted pattern.
Add FairRate to your EUR/USD analysis. Know where fundamentals stand.
© 2025 Numanti. All rights reserved.

Straight Regression Line + Normalized Slope (Adaptive Length)Find the regression line of available candles.
It will print the slope and the normalized slope

ARDO - Adaptive Regression Deviation Oscillator (v2.4.6)ARDO – Adaptive Regression Deviation Oscillator (v2.4.6)
ARDO (Adaptive Regression Deviation Oscillator) quantifies deviation of price structure from a regression-based equilibrium baseline using adaptive moving-average spreads. It combines percentile-normalized distance, linear-regression slope, and dynamic gradient scaling to reveal trend extension, exhaustion, and regime shifts—offering a structural view of trend integrity and mean-reversion timing beyond traditional momentum oscillators. It is designed to help you answer two questions:
Where are we in the regime? (extended, neutral, or reversal-prone)
Is this a “trade” environment or a “stand aside” environment? (Gate PASS vs Gate BLOCK / drift)
ARDO is best used as a context + timing framework , not a standalone entry/exit system.
What you see in the ARDO pane
1) Spread A (% vs baseline)
Primary “timing” spread (default: stepline). Spread A is colored by a 4-state maColor model:
GREEN : above baseline and strengthening
ORANGE : above baseline but weakening
RED : below baseline and weakening
GRAY : below baseline but improving
2) Spread B (% vs baseline)
Secondary “context” spread (default: columns). Same 4-state color model as above, often used to confirm or filter Spread A behavior.
3) LinReg (slope-gradient)
A LinReg line fit to a selected source (Spread A / Spread B / Spread A+B). ARDO applies a slope-magnitude gradient (opacity/intensity) to visualize regime:
Stronger slope magnitude = stronger directional regime
Fading / low slope magnitude = drift / dead-zone (lower edge, choppy conditions, or end-of-move)
4) Tier zones (Q0–Q2, H2–H4)
ARDO classifies LinReg values into percentile tiers (extremes and mid-tiers). These tiers can be rendered as:
Background regions, or
Zero-line marker circles (“MK …” plots)
Important: Background colors do not export . The “MK Q0 … MK H4” series are emitted so you can reconstruct tier membership in CSV/backtests.
5) Gate PASS / Gate BLOCK
A compact “permission layer” that can require:
Spread A > LinReg
EMA Fast > EMA Slow
Minimum Spread A threshold
Minimum absolute LinReg slope
Use Gate PASS to focus on higher-quality conditions; use Gate BLOCK as a “do nothing / reduce size” warning.
Key settings (what they change)
Tier Mode
Standard: symmetric cut structure (general purpose)
Asymmetric: separate tuning for highs vs lows (often better when upside and downside behavior are not symmetric)
Tier Population
All Bars (LinReg): tiers represent the full LinReg distribution
Pivots Only: tiers are computed from pivot events only (can tighten “extreme” definition and change how frequently zones appear)
Render Mode
Background: easiest to read visually
Zero-line Markers: best for export/backtesting workflows (MK series)
Gating options
Turn on/off each rule independently; adjust thresholds to match symbol volatility and timeframe.
Color overrides
Optional per-state color customization for Spread A, Spread B, and LinReg (4-state).
Alerts included (v2.4.6)
ARDO exposes named alerts you can use for automation or review, including:
Gradient / regime alerts (HIGH vs LOW slope-magnitude regimes; regime shift transitions)
Color-state changes (Spread B → GREEN/ORANGE/RED/GRAY; LinReg state changes)
Tier entry alert s (LinReg entering key tiers such as Q0/Q1/H3/H4)
Structural primitives (Bullish A > B, Bearish A < B, Gate PASS/BLOCK, crosses of 0, etc.)
How to use (practical workflow)
Anchor timeframe (65m or Daily): identify regime (tiers + gradient) and whether you should be aggressive or defensive.
Execution timeframe (5m/1m): time entries using Spread A/B structure and Gate PASS, aligned with the anchor regime.
Avoid forcing trades in drift: fading gradient + mid/low-edge tiers often marks “dead-zone” conditions.
Notes / limitations
ARDO is a context engine: it describes regime and location, not guaranteed direction.
Tier thresholds are distribution-based and will vary by window/timeframe.
Always apply your own risk management; this script is not financial advice.

EMA + ATR Semi-Auto strategy -Kohei Matsumura-EMAとATRを自動調節するストラテジー
This is an EMA- and ATR-based trading strategy that adapts its parameters according to recent market behavior and performance characteristics.
The strategy dynamically adjusts trend sensitivity and risk management settings to maintain robustness across varying market conditions, while operating strictly on confirmed price data.

Shiori TFGI Lite Technical Fear and Greed Index (Open Source)Shiori’s TFGI Lite
Technical Fear & Greed Index (Open Source)
---
English — Official Description
Shiori’s TFGI Lite is an open-source Technical Fear & Greed Index designed to help traders and investors understand market emotion, not predict price.
Instead of generating buy or sell signals, this indicator focuses on answering a calmer, more important question:
> Is the market emotionally stretched away from its own historical balance?
TFGI Lite combines three well-known technical dimensions — volatility, price deviation, and momentum — and normalizes them into a single, intuitive 0–100 sentiment scale.
What This Indicator Is
* A market context tool, not a trading signal
* A way to observe emotional extremes and misalignment
* Designed for any asset, any timeframe
* Fully open source, transparent and adjustable
Core Components
* Fear Factor: Short-term vs long-term ATR ratio with logarithmic compression
* Greed Factor: Price Z-score with tanh-based normalization
* Momentum Factor: Classic RSI as emotional momentum
These factors are blended and gently smoothed to form the current sentiment level.
Historical Baseline & Deviation
TFGI Lite introduces a historical baseline concept:
* The baseline represents the market’s own emotional equilibrium
* Deviation measures how far current sentiment has drifted from that equilibrium
This allows the indicator to highlight conditions such as:
* 🔥 Overheated: High sentiment + strong positive deviation
* 💎 Undervalued: Low sentiment + strong negative deviation
* ⚠️ Misaligned: Emotionally extreme, but inconsistent with historical behavior
How to Use (Lite Philosophy)
* Use TFGI Lite as a background compass, not a trigger
* Combine it with price structure, risk management, and your own strategy
* Extreme readings suggest emotional tension, not immediate reversal
> Think of TFGI Lite as market weather — it tells you the climate, not when to open or close the door.
About Parameters & Customization
All parameters in TFGI Lite are fully adjustable. Markets have different personalities — volatility, sentiment range, and emotional extremes vary by asset and timeframe.
You are encouraged to:
* Adjust fear/greed thresholds based on the asset you trade
* Tune smoothing and baseline lengths to match your timeframe
* Treat sentiment levels as relative, not universal absolutes
There is no single “correct” setting — TFGI Lite is designed to adapt to your market, not force the market into a fixed model.
Important Notes
* This is a technical sentiment indicator, not financial advice
* No future performance is implied
* Designed to reduce emotional decision-making, not replace it
---
🇹🇼 繁體中文 — 指標說明
Shiori’s TFGI Lite(技術型恐懼與貪婪指數) 是一款開源的市場情緒指標,目的不是預測價格,而是幫助你理解市場當下的「情緒狀態」。
與其問「現在該不該買或賣」,TFGI Lite 更關心的是:
> 市場情緒是否已經偏離了它自己的歷史平衡?
本指標整合三個常見但關鍵的技術面向,並統一轉換為 0–100 的情緒刻度,讓市場狀態一眼可讀。
這個指標是什麼
* 市場情緒與狀態觀察工具(非買賣訊號)
* 用來辨識情緒極端與錯位狀態
* 適用於任何商品與任何週期
* 完全開源,可學習、可調整
核心構成
* 恐懼因子:短期 / 長期 ATR 比例(對數壓縮)
* 貪婪因子:價格 Z-Score(tanh 正規化)
* 動能因子:RSI 作為情緒動量
歷史基準與偏離
TFGI Lite 引入「歷史情緒基準」的概念:
* 基準代表市場長期的情緒平衡
* 偏離值顯示當前情緒與自身歷史的距離
因此可以辨識:
* 🔥 過熱(高情緒 + 正向偏離)
* 💎 低估(低情緒 + 負向偏離)
* ⚠️ 錯位(情緒極端,但不符合歷史行為)
使用建議(Lite 精神)
* 將 TFGI Lite 作為「背景雷達」,而非進出場依據
* 搭配價格結構、風險控管與個人策略
* 情緒極端不等於立刻反轉
> 你可以把它想像成市場的天氣預報,而不是交易指令。
參數調整與個人化說明
本指標中的所有參數皆可調整。不同市場、不同商品,其波動特性與情緒區間並不相同。
建議你:
* 依標的特性自行調整恐懼 / 貪婪門檻
* 依交易週期調整平滑與基準長度
* 將情緒數值視為「相對狀態」,而非固定答案
TFGI Lite 的設計初衷,是讓你定義市場,而不是被單一參數綁住。
溫馨提示
如果你在調整指標參數時遇到不熟悉的項目,請點擊參數旁邊的 「!」圖示,每個設定都有清楚的說明。
本指標設計為可慢慢探索,請依自己的節奏理解市場狀態。
---
🇯🇵 日本語 — インジケーター説明
Shiori’s TFGI Lite は、価格を予測するための指標ではなく、
市場の「感情状態」を可視化するためのオープンソース指標です。
この指標が問いかけるのは、
> 現在の市場感情は、過去のバランスからどれだけ乖離しているのか?
という一点です。
特徴
* 売買シグナルではありません
* 市場心理の極端さやズレを観察するためのツールです
* すべての銘柄・時間軸に対応
* 学習・調整可能なオープンソース
構成要素
* 恐怖要素:ATR 比率(対数圧縮)
* 強欲要素:価格 Z スコア(tanh 正規化)
* モメンタム:RSI
ベースラインと乖離
市場自身の感情的な基準点と、
現在の感情との距離を測定します。
過熱・割安・感情のズレを視覚的に把握できます。
パラメータ調整について
TFGI Lite のすべてのパラメータは調整可能です。市場ごとにボラティリティや感情の振れ幅は異なります。
* 恐怖・強欲の閾値は銘柄に応じて調整してください
* 時間軸に合わせて平滑化やベースライン期間を変更できます
* 数値は絶対値ではなく、相対的な感情状態として捉えてください
この指標は、市場に合わせて柔軟に使うことを前提に設計されています。
フレンドリーヒント
入力項目で分からない設定がある場合は、横に表示されている 「!」アイコン をクリックしてください。各パラメータには分かりやすい説明が用意されています。
このインジケーターは、落ち着いて市場の状態を理解するためのものです。
---
🇰🇷 한국어 — 지표 설명
Shiori’s TFGI Lite는 매수·매도 신호를 제공하는 지표가 아니라,
시장 감정의 상태를 이해하기 위한 기술적 심리 지표입니다.
이 지표의 핵심 질문은 다음과 같습니다.
> 현재 시장 감정은 과거의 균형 상태에서 얼마나 벗어나 있는가?
특징
* 거래 신호 아님
* 시장 심리의 과열·저평가·불일치를 관찰
* 모든 자산, 모든 타임프레임 지원
* 오픈소스 기반
구성 요소
* 공포 요인: ATR 비율 (로그 압축)
* 탐욕 요인: Z-Score (tanh 정규화)
* 모멘텀: RSI
활용 방법
TFGI Lite는 배경 지표로 사용하세요.
가격 구조와 리스크 관리와 함께 사용할 때 가장 효과적입니다.
파라미터 조정 안내
TFGI Lite의 모든 설정 값은 사용자가 직접 조정할 수 있습니다. 자산마다 변동성과 감정 범위는 서로 다릅니다.
* 공포 / 탐욕 기준값은 종목 특성에 맞게 조정하세요
* 타임프레임에 따라 스무딩 및 기준 기간을 변경할 수 있습니다
* 감정 수치는 절대적인 값이 아닌 상대적 상태로 해석하세요
이 지표는 하나의 정답을 강요하지 않고, 시장에 맞춰 적응하도록 설계되었습니다.
친절한 안내
설정 값이 익숙하지 않다면, 항목 옆에 있는 "!" 아이콘을 클릭해 보세요. 각 입력값마다 설명이 제공됩니다.
이 지표는 천천히 시장의 맥락을 이해하도록 설계되었습니다.
---
Educational purpose only. Not financial advice.
---
#FearAndGreed #MarketSentiment #TradingPsychology #TechnicalAnalysis #OpenSourceIndicator #Volatility #RSI #ATR #ZScore #MultiAsset #TradingView #Shiori

TFGI Lite: Technical Fear & Greed Dashboard (All-Assets)📊 TFGI Lite: Technical Fear & Greed Dashboard (All-Assets)
Don't guess the sentiment. Measure it.
不要猜測情緒,去測量它。
🇹🇼 繁體中文:市場情緒的導航儀
什麼是 TFGI Lite?
這是一個簡潔的「市場氣象儀表板」,直接顯示在您的 K 線圖上。它幫助您判斷現在市場是處於「過度恐懼(適合貪婪)」還是「過度貪婪(適合謹慎)」的狀態。適用於股票、加密貨幣、外匯與期貨。
數字代表什麼意義?
分數範圍為 0 到 100:
0 - 25 (極度恐懼 / 綠色區域):
市場陷入恐慌,價格可能被低估。這通常是尋找買點的機會(別人恐懼我貪婪)。
75 - 100 (極度貪婪 / 紅色區域):
市場過熱,追高風險極大。這通常是考慮獲利了結或警惕回調的時刻。
25 - 75 (中性震盪):
市場處於正常波動範圍,順勢操作即可。
儀表板上的三個關鍵數據:
Local TFGI (當前商品):您現在看的這張圖表(例如比特幣或台積電)的情緒分數。
Global TFGI (全球宏觀):全球資金的流向與風險偏好(綜合了美股、波動率 VIX、美元與債市)。這就像是「大盤天氣」。如果全球都在下雨(恐慌),您的股票也很難獨善其身。
Spread (情緒溫差):
如果 Local 分數遠高於 Global,代表這個商品漲過頭了,要注意風險。
如果 Local 分數遠低於 Global,代表這個商品被錯殺了,可能是機會。
🇺🇸 English: Navigate Market Sentiment Simply
What is TFGI Lite?
A clean, professional "Weather Dashboard" for your chart. It quantifies market psychology, helping you decide when to be contrarian. It works on any asset class (Stocks, Crypto, Forex).
How to Read the Numbers (0-100 Score)
0 - 25 (Extreme Fear / Green Zone):
Investors are panicking. The asset may be oversold. Historically, this is often a buying opportunity.
75 - 100 (Extreme Greed / Red Zone):
The market is overheated and FOMO is high. The risk of a correction is increasing. It might be time to take profits.
25 - 75 (Neutral):
Normal market fluctuations.
Key Features on the Dashboard:
Local TFGI: The sentiment score of the specific asset you are watching right now.
Global TFGI: The sentiment of the entire global market (Aggregating SPY, VIX, DXY, and Bonds). Think of this as the "Macro Tide". It's hard to swim against the tide.
Spread: The difference between the Asset and the Global market.
Positive Spread: This asset is hotter than the global market (Potential Overvaluation).
Negative Spread: This asset is weaker than the global market (Potential Undervaluation).
🇯 日本語:相場の「過熱感」を一目で判断
TFGI Liteとは?
チャート上に表示されるシンプルな「センチメント(市場心理)ダッシュボード」です。市場が「悲観(買い時)」にあるのか、「楽観(売り時)」にあるのかを客観的な数値で示します。株、仮想通貨、FXなど、あらゆる資産に対応しています。
スコアの見方(0〜100)
0 - 25 (極度の恐怖 / 緑エリア):
市場はパニック状態です。売られすぎの可能性があり、逆張りの買いチャンスとなることが多いゾーンです。
75 - 100 (極度の強欲 / 赤エリア):
市場は過熱しており、イケイケの状態です。暴落のリスクが高まっているため、利益確定を検討する警戒ゾーンです。
25 - 75 (中立):
通常の変動範囲内です。
ダッシュボードの3つの重要指標:
Local TFGI (個別): 現在表示している銘柄のセンチメントスコアです。
Global TFGI (全体): 世界市場全体のムード(米国株、VIX指数、ドル、債券を総合分析)。「地合い」を確認するために使います。
Spread (乖離): 個別銘柄と世界市場の温度差。この数値が大きい場合、その銘柄だけが異常に買われすぎている可能性があります。
🇰🇷 한국어: 시장의 공포와 탐욕을 한눈에
TFGI Lite란 무엇인가요?
차트 위에 직접 표시되는 깔끔한 "시장 심리 계기판"입니다. 현재 시장이 '과도한 공포(저점 매수 기회)'인지 '과도한 탐욕(고점 매도 주의)'인지 판단하는 데 도움을 줍니다. 주식, 코인, 외환 등 모든 자산에 적용 가능합니다.
숫자가 의미하는 것 (0~100점)
0 - 25 (극심한 공포 / 초록색 구간):
투자자들이 패닉에 빠져 투매가 나옵니다. 역사적으로 이는 저가 매수(Buy the dip)의 기회일 가능성이 높습니다.
75 - 100 (극심한 탐욕 / 빨간색 구간):
시장이 과열되었습니다. 추격 매수는 위험하며, 이익 실현을 고려하거나 조정을 대비해야 할 때입니다.
25 - 75 (중립):
일반적인 시장 변동 구간입니다.
대시보드의 핵심 데이터:
Local TFGI (개별 종목): 지금 보고 계신 차트(코인/주식)의 자체적인 심리 점수입니다。
Global TFGI (글로벌 매크로): 전 세계 자금의 흐름과 위험 선호도(미국 증시, VIX, 달러, 채권 종합). 시장 전체의 "날씨"를 알려줍니다。
Spread (괴리율): 개별 종목과 글로벌 시장 간의 온도 차이. 개별 종목 점수가 글로벌보다 훨씬 높다면, 해당 종목이 과매수되었을 수 있습니다。

Momentum Marks - Buy and Sell IndicatorsIndicator Overview
This tool is a multi‑factor entry signal system designed to highlight potential BUY and SHORT opportunities directly on the chart with hard‑anchored labels. It combines trend, momentum, volatility, and volume conditions to reduce noise and provide more reliable trade signals.
Core Components
- EMA Trend Filter
- Uses a fast EMA (9) and a slow EMA (21) to determine short‑term vs. medium‑term trend direction.
- Signals only trigger when price aligns with the EMA relationship (e.g., fast above slow for shorts, fast below slow for buys).
- RSI Extremes
- RSI thresholds (default 65/35) ensure signals occur only when momentum is stretched into overbought or oversold zones.
- Helps avoid false triggers during neutral conditions.
- Linear Regression Channel
- A regression line with ±2 standard deviation bands defines dynamic support and resistance.
- Signals require price to be near the top (for shorts) or bottom (for buys) of the channel, adding a structural filter.
- TTM Squeeze Histogram
- Measures momentum shifts by comparing price to its EMA.
- Signals require histogram confirmation: weakening momentum for shorts, strengthening momentum for buys.
- Volume Confirmation
- Volume must fade for shorts or surge for buys relative to a 20‑period average.
- Ensures signals align with participation strength.
Visual Output
- Red “SHORT” label above bars when all short conditions align.
- Green “BUY” label below bars when all buy conditions align.
- Optional plotshape arrows (triangles) as backup markers.
- Linear regression channel shaded between upper and lower bands.
- EMA lines plotted for trend context.
Key Features
- Hard‑anchored labels: Signals are locked to confirmed bars, preventing repainting or shifting.
- Multi‑layer confirmation: Requires trend, momentum, volume, and structure to align before firing.
- Customizable inputs: Users can adjust EMA lengths, RSI thresholds, regression length, and squeeze parameters.

80% EDGE Rule - TPO Based═════════════════════════════════════════════════════════════
80% EDGE RULE - TPO BASED
═════════════════════════════════════════════════════════════
█ OVERVIEW
The 80% Edge Rule is a high-probability Market Profile concept that identifies when price is likely to traverse the prior session's Value Area. This indicator automates the detection, confirmation, and tracking of 80% EDGE Rule setups using true TPO (Time Price Opportunity) calculations—not volume profile.
When price opens outside the previous day's Value Area and then re-enters and is "accepted" back inside, there is an 80% statistical probability that price will travel to the opposite side of the Value Area. This indicator does all the heavy lifting: calculating the prior session's Value Area, detecting valid setups, confirming acceptance, and tracking progress toward the target.
█ THE 80% EDGE RULE EXPLAINED
The 80% Edge Rule is based on Market Profile theory developed by J. Peter Steidlmayer at the Chicago Board of Trade. The rule states:
❶ If price OPENS OUTSIDE the prior day's Value Area...
❷ And then ENTERS and is ACCEPTED back into the Value Area...
❸ There is an 80% chance price will rotate to the OTHER SIDE of the Value Area.
"Acceptance" is defined as price spending TWO OR MORE TPO periods (typically 30-minute blocks) inside the Value Area. This indicates that the market has accepted these prices as fair value, and the auction process will likely continue through to the opposite boundary.
BULLISH SETUP: Price opens BELOW the prior VAL → Enters and is accepted → Target is VAH
BEARISH SETUP: Price opens ABOVE the prior VAH → Enters and is accepted → Target is VAL
█ HOW THIS INDICATOR WORKS
This indicator performs several automated functions:
1. TPO VALUE AREA CALCULATION
• Analyzes the prior RTH (Regular Trading Hours) session
• Builds a true TPO distribution using 30-minute time blocks
• Each price level receives +1 TPO for each period it was touched
• Calculates POC (Point of Control) as the price with highest TPO count
• Expands from POC using the CME/CBOT standard "two-price" method until 70% of TPOs are captured
• This defines VAH (Value Area High) and VAL (Value Area Low)
2. SETUP DETECTION
• Monitors the RTH open (default 9:30 AM ET)
• Detects if price opened outside the prior Value Area
• Determines setup direction (Bullish or Bearish)
3. ACCEPTANCE MONITORING
• Tracks TPO blocks where price remains inside the Value Area
• Confirms setup when required number of blocks is reached (default: 2)
• Resets count if price exits VA before confirmation
4. TARGET & INVALIDATION TRACKING
• Monitors for target completion (opposite VA boundary)
• Monitors for invalidation (price moves beyond entry VA boundary + buffer)
• Visual feedback on outcome
█ VISUAL ELEMENTS
PRIOR VALUE AREA LINES (Dashed)
• RED DASHED LINE: Prior Day VAH (Value Area High)
• GREEN DASHED LINE: Prior Day VAL (Value Area Low)
• PURPLE DOTTED LINE: Prior Day POC (Point of Control)
TRADE LINES (Solid)
• YELLOW LINE: Entry price (where setup was confirmed)
• CYAN LINE: Target price (opposite VA boundary)
• GREEN LINE: Entry line turns green when target is hit
• GRAY LINES: Both lines turn gray if setup is invalidated
STATUS LABEL
• Floating label showing current setup state
• ORANGE "WATCHING": Setup detected, monitoring for acceptance
• YELLOW "CONFIRMED": Setup confirmed, tracking toward target
• GREEN "TARGET HIT ✓": Target successfully reached
• RED "INVALIDATED ✗": Setup failed, price moved against
DASHBOARD (Top Right Corner)
• Prior VAH: Yesterday's Value Area High
• Prior VAL: Yesterday's Value Area Low
• Prior POC: Yesterday's Point of Control
• Open Price: Today's RTH opening price
• Direction: BULLISH ↑ or BEARISH ↓
• Status: Current setup state
█ CONFIGURABLE SETTINGS
┌────────────────────────────────────────────────────────────
│ TPO SETTINGS
├────────────────────────────────────────────────────────────
│ Tick Size (Default: 0.25) │ • Price increment for TPO calculations
│ • ES/MES: 0.25
│ • NQ/MNQ: 0.25
│ • YM/MYM: 1.0
│ • RTY: 0.1 │ • CL/MCL: 0.01
│ • GC/MGC: 0.1
│
│ Value Area % (Default: 70)
│ • Percentage of TPOs to include in Value Area
│ • Standard is 70% (one standard deviation)
│ • Can adjust 50-90% based on preference
│
│ TPO Block Duration (Default: 30 minutes)
│ • Length of each TPO period
│ • Standard Market Profile uses 30-minute periods
│ • Adjust if using non-standard TPO settings
└────────────────────────────────────────────────────────────
┌────────────────────────────────────────────────────────────
│ 80% EDGE RULE SETTINGS
├────────────────────────────────────────────────────────────
│ TPO Blocks Required for Acceptance (Default: 2)
│ • Number of 30-min periods price must stay inside VA
│ • Standard rule requires 2 periods for acceptance
│ • More conservative: Increase to 3
│ • More aggressive: Reduce to 1 (not recommended)
│
│ Invalidation Distance (Default: 10 points)
│ • Buffer beyond VA boundary before setup is invalidated
│ • Bullish: Invalidates if LOW goes below VAL minus this distance
│ • Bearish: Invalidates if HIGH goes above VAH plus this distance
│ • Adjust based on product volatility and your risk tolerance
│
│ Fade Delay (Default: 5 minutes)
│ • How long entry/target lines stay visible after outcome
│ • Lines and floating label disappear after this delay
│ • Dashboard retains the outcome status until next session
└────────────────────────────────────────────────────────────
┌────────────────────────────────────────────────────────────
│ SESSION SETTINGS
├────────────────────────────────────────────────────────────
│ RTH Session (Default: 0930-1600)
│ • Regular Trading Hours window
│ • This determines which bars are used for TPO calculation
│ • Also determines when RTH "open" is detected
│
│ PRODUCT-SPECIFIC RTH SESSIONS:
│ • Equity Index Futures (ES, NQ, YM, RTY): 0930-1600
│ • Crude Oil (CL): 0900-1430 (pit session)
│ • Gold (GC): 0820-1330 (pit session)
│ • Treasury Bonds/Notes: 0720-1400
│ • Forex Futures: Varies by product
│
│ Timezone (Default: America/New_York)
│ • Timezone for session calculations
│ • Options: New York, Chicago, Los Angeles, UTC
│ • Use exchange timezone for accurate session detection
└────────────────────────────────────────────────────────────
┌────────────────────────────────────────────────────────────
│ VISUAL SETTINGS
├────────────────────────────────────────────────────────────
│ Show Prior VA Lines: Toggle VAH/VAL/POC lines on/off
│ Show Entry/Target Lines: Toggle trade-related lines on/off
│ VAH Color: Color for Value Area High line
│ VAL Color: Color for Value Area Low line
│ POC Color: Color for Point of Control line
│ Entry Line Color: Color for entry price line
│ Target Line Color: Color for target price line
│ Target Hit Color: Color when target is reached (default: green)
│ Line Width: Thickness of all lines (1-5)
└────────────────────────────────────────────────────────────
┌────────────────────────────────────────────────────────────
│ DEBUG SETTINGS
├────────────────────────────────────────────────────────────
│ Show Debug Info: Displays additional diagnostic information
│ • Session High/Low of prior day
│ • Current RTH status
│ • Current TPO block number
│ • Outcome timestamp
│ • Useful for troubleshooting or verifying calculations
└────────────────────────────────────────────────────────────
█ ALERTS
This indicator includes three configurable alerts:
① SETUP CONFIRMED
• Triggers when acceptance criteria is met
• Includes entry price and target price in alert message
② TARGET HIT
• Triggers when price reaches the opposite VA boundary
• Confirms successful completion of the 80% Rule setup
③ INVALIDATED
• Triggers when price moves beyond the invalidation threshold
• Signals that the setup has failed
To enable alerts:
1. Ensure "Enable Alerts" is checked in indicator settings
2. Right-click on the indicator → "Add Alert"
3. Select the condition you want to be alerted on
4. Configure notification method (popup, email, webhook, etc.)
█ RECOMMENDED USAGE
TIMEFRAME:
• Best used on 5-minute, 15-minute, or 30-minute charts
• The chart timeframe should divide evenly into 30 minutes
• Ensure sufficient historical bars are loaded for prior session calculation
BEST PRACTICES:
• Wait for full confirmation (2 TPO blocks inside VA) before considering entry
• Use the target line as your profit objective
• Consider the invalidation level for stop-loss placement
• Monitor the dashboard for real-time setup status
• Combine with other confluence factors (order flow, support/resistance, etc.)
IMPORTANT NOTES:
• This indicator calculates TRUE TPO-based Value Area, not volume profile
• Prior day VA is recalculated at each new session
• The 80% Rule is a statistical tendency, not a guarantee
• Always use proper risk management
█ ADJUSTING FOR DIFFERENT PRODUCTS
This indicator defaults to Equity Index Futures (ES, NQ, etc.) with:
• RTH Session: 0930-1600
• Timezone: America/New_York
• Tick Size: 0.25
FOR OTHER PRODUCTS, ADJUST:
CRUDE OIL (CL/MCL):
• RTH Session: 0900-1430
• Tick Size: 0.01
GOLD (GC/MGC):
• RTH Session: 0820-1330
• Tick Size: 0.10
TREASURY FUTURES (ZB, ZN):
• RTH Session: 0720-1400
• Tick Size: 0.03125 (ZB) or 0.015625 (ZN)
E-MINI DOW (YM/MYM):
• RTH Session: 0930-1600
• Tick Size: 1.0
RUSSELL 2000 (RTY):
• RTH Session: 0930-1600
• Tick Size: 0.10
Always verify the RTH session times and tick sizes for your specific product and exchange.
█ DISCLAIMER
This indicator is provided for educational and informational purposes only. It is not financial advice and should not be construed as a recommendation to buy or sell any financial instrument. Trading futures and other leveraged products involves substantial risk of loss and is not suitable for all investors.
Past performance is not indicative of future results. The 80% Edge Rule is a statistical observation based on Market Profile theory and does not guarantee any specific outcome. Always conduct your own analysis and use proper risk management.

Vietnamese Stock: Discount Linear Regression Liquidity GrabThe Discount Linear Regression Liquidity Grab is a sophisticated technical analysis tool that combines statistical trend analysis with Premium/Discount Zone and Price Action logic. Unlike standard Linear Regression Channels that repaint or stretch indefinitely, this indicator is dynamic: it automatically detects volatility breakouts to "reset" the channel, creating distinct market "Sections."
This tool is designed to help traders identify trend exhaustion, fair value gaps (FVGs), and high-probability reversal or continuation zones using two distinct built-in strategies.
Key Features
1. Dynamic Channel Resets
The core engine calculates a Linear Regression Channel based on a Pearson R coefficient and Deviation multipliers.
- How it works: When price breaks out of the Upper or Lower Deviation bands, the script recognizes a shift in momentum. It "locks" the previous channel and begins calculating a new one from the breakout point.
- Benefit: This creates a historical map of market structure, showing you exactly where previous trends began and ended.
2. Smart Money Concepts (SMC) Integration
For every completed section (channel), the indicator automatically highlights:
Highest High & Lowest Low Boxes: Identifies the structural range of the previous move.
- Gaps & FVGs: Automatically draws boxes for Fair Value Gaps and Price Gaps within the channel, acting as potential magnets for price.
3. The Discount Zone (New Feature)
The indicator projects a Discount Area (Red Box) from the previous section's midline down to its lowest low.
- Logic: This box represents the "Discount" pricing relative to the previous move.
- Behavior: The box extends to the right until price successfully "grabs liquidity" (closes below the midline/red line). Once the grab occurs, the box stops extending, marking that the liquidity event is complete.
Built-In Strategies
This indicator includes two automated strategy signals based on the interaction between current price and historical sections.
Strategy 1: Breakout & Retest (Trend Continuation)
This strategy looks for a classic resistance-turned-support setup.
- Breakout: Price closes above the Highest High of a previous section (Triangle Up).
- Retest: Price pulls back and closes at or below that breakout level (Triangle Down).
- Confirmation: Price breaks above the high of the initial breakout candle (Green Background).
Strategy 2: Midline Reclaim (Mean Reversion / Discount Buy)
This strategy focuses on buying from the "Discount" zone.
- Liquidity Grab: Price drops below the Midline (Red Line) of a previous section, entering the Discount Zone.
- Reclaim: Price closes back above the Midline, signaling that the dip was bought up.
Signal: A Diamond shape and Teal Background appear.
How to Use
- Trend Trading: Use the Dynamic Channels to visualize the current slope. If the channel is angling up, look for long setups.
- Confluence: Use the Discount Zones and FVG boxes as areas of interest. If price enters a Red Discount Box and forms a reversal pattern, it is a high-probability entry.
- Stop Loss Placement: The Lowest Low boxes of previous sections serve as excellent invalidation points for long positions.
Alerts
The indicator comes with pre-configured alerts for:
- Strategy 1 Confirmation.
- Strategy 2 Midline Reclaim.
- New Channel Formation (Trend Reset).
- Liquidity Grab Events.

Ratio with Lag• Ratio = X(T) / Y(T-lag)
• Auto-detects “X/Y” typed in chart search bar
• Plots ratio directly on main chart
• Adds 30-week MA (weekly SMA of the ratio)
• Adds 150-day SMA (daily SMA of the ratio)

BTC Spot vs Perpetual CVD Divergence + Delta Confirm + Band FillThis indicator detects real market turning points by comparing Spot vs Perpetual CVD flows to identify forced positioning changes, leverage clean-ups, and true spot absorption.
It tracks normalized CVD for both Spot and Perps, calculates the divergence between them, and applies a dynamic volatility-based threshold to filter noise. Signals only trigger at confirmed pivot points, ensuring accuracy over early false reversals. An optional Delta confirmation layer further validates setups by requiring aggressive market flow in the direction of the pivot reversal.
This tool is not designed for blind entries — it highlights high-probability reversal zones. Best used in combination with VWAP, HTF structure, OI, and funding rate analysis to time optimal entries via pullbacks and momentum confirmation.
✅ Ideal for:
• Identifying local tops & bottoms
• Tracking spot vs leverage dominance
• Trading mean reversion and squeeze setups
• Flow-based scalping
❌ Not intended for:
• Chasing breakouts
• Standalone entry signals without price structure


Trend Flip Exhaustion SignalsThis Pine Script is designed to generate buy and short trading signals based on a combination of technical indicators. It calculates fast and slow EMAs, RSI, a linear regression channel, and a simplified TTM squeeze histogram to measure momentum.
- Short signals trigger when price is above both EMAs, near the upper regression channel, momentum is weakening, volume is fading, and RSI is overbought.
- Buy signals trigger when price is below both EMAs, near the lower regression channel, momentum is strengthening, volume is surging, and RSI is oversold.
- Signals are displayed as labels anchored to price bars (with optional plotshape arrows for backup).
- The script also plots the EMAs and regression channel for visual context.
In short - it’s a trend‑following entry tool that highlights potential exhaustion points for shorts and potential reversals for buys, with clear on‑chart markers to guide decision‑making.

Physics of PricePhysics of Price is a non-repainting kinematic reversal and volatility overlay. It models price as a physical object with position, velocity, and acceleration, then builds adaptive bands and a short-term predictive “ghost cone” to highlight where reversals are statistically more likely.
CONCEPT
Instead of using only moving averages, the core engine tracks a smoothed price (position), trend speed (velocity), and change in trend speed (acceleration). Standard deviation of the model error defines probabilistic bands around this kinematic centerline. When price stretches too far away and snaps back, the move is treated as a potential exhaustion event.
CORE COMPONENTS
– Kinematic centerline (Alpha–Beta–Gamma style filter) that bends with trend instead of lagging like a simple MA.
– Inner and outer bands based on the standard deviation of residuals between price and the kinematic model.
– Regime filter using R² and band width to avoid signals in chaotic or ultra-wide regimes.
– Optional RSI “hook” filter that waits for momentum to actually turn instead of buying into a falling RSI.
– Optional divergence add-on using kinematic velocity, so a marginal new price extreme with weaker velocity is recognized as a possible exhaustion pattern.
REVERSAL EVENTS AND SCORING
Raw events are detected when price wicks through the outer band and closes back inside (band hit with snap). These are plotted as diamonds and treated as candidates, not automatic trades.
Each event is then scored from 0 to 100 using several factors:
– How far price overshot the outer band.
– How strongly it snapped back inside.
– Whether an RSI hook is present (if enabled).
– Regime quality from the kinematic model.
– Basic kinematic safety to avoid the most aggressive “knife-catch” situations.
– Optional divergence bonus when price makes a new extreme but velocity does not.
Only events with a score above the chosen threshold become confirmed signals (triangles labeled PHYSICS REV).
GHOST CONE (PREDICTIVE BAND)
On the latest bar, the script projects a short-horizon “ghost cone” into the future using position, velocity, and a damped acceleration term. This creates a curved predictive band that visualizes a plausible short-term path and range, rather than a simple straight line. The cone is meant as context for trade management and risk, not as a hard target.
FILTERS AND OPTIONS
– Regime filter (R² and band width) can be tightened or relaxed depending on how selective you want the engine to be.
– RSI and volume filters can be toggled on for extra confirmation or off to see the raw kinematic behavior.
– An optional trend baseline (EMA) can be enabled to bias or restrict reversals relative to a higher-timeframe trend.
– Dynamic cooldown scales with volatility so the script does not spam signals in fast environments.
HOW TO USE
Physics of Price is primarily a mean-reversion and exhaustion tool. It works best in markets that respect ranges, swings, and two-sided order flow. Confirmed PHYSICS REV signals near the outer bands, with decent model health and a clean RSI hook, are the core use case. The bands and ghost cone can also be used as a context overlay alongside your own entries, exits, and risk framework.
This is an indicator, not a complete trading system. It does not use lookahead or higher-timeframe security calls and is designed for “once per bar close” alerts. Always combine it with your own risk management and confluence.

Syntropy - System v4Syntropy System v4 – La Estrategia de Acumulación Profesional que Todos Están UsandoEDICIÓN LIMITADA – SOLO 10 PLAZAS DISPONIBLES EN TODO EL MUNDOPor primera (y única) vez, libero mi estrategia privada más potente:
La misma que uso personalmente y que ha cambiado por completo la forma en que acumulo en Bitcoin, Ethereum y altcoins de alto potencial.¿Qué incluye Syntropy v4?8 motores de entrada independientes (PG Solo, PG+FA, RZ1/RZ2, SFP, Liquidity Sweep, STE Bottom + reentradas inteligentes)
Piramidación hasta 20 niveles con control total de riesgo
Medias móviles dinámicas + proyecciones extendidas
Tabla en tiempo real con P&L total, capital invertido y operaciones abiertas/cerradas
Señales 100% visuales y sin repintado
Optimizada para cripto, pero funciona perfecto en forex y acciones
OFERTA EXCLUSIVA Y POR TIEMPO MUY LIMITADOPrecio normal: 499 USD (pago único de por vida + todas las futuras actualizaciones) PRECIO LANZAMIENTO SOLO PARA LOS PRIMEROS 10 COMPRADORES:
50 USD DE POR VIDA
(Sí, leíste bien: cincuenta dólares una sola vez y el indicador es tuyo para siempre)Una vez que se vendan las 10 primeras licencias, este precio desaparece para siempre y vuelve al valor real de 499 USD.Ya van 7/10 vendidas en las últimas horas…¿Quieres ser uno de los últimos 3 que se lleven Syntropy v4 a precio de lanzamiento?Envíame YA un mensaje privado con la palabra “SYNTROPY 50” y te mando el enlace de pago + acceso inmediato al script protegido.No hay prueba gratis esta vez porque a este precio es literalmente un regalo… pero sí te doy mi palabra: si en 30 días no estás 100% convencido de que es la mejor estrategia que has usado jamás, te devuelvo hasta el último centavo.Quedan muy pocas horas antes de que suba el precio para siempre.Los primeros 10 que escriban ahora se llevan el indicador de por vida por solo 50 USD.
El resto pagará 10 veces más.Tú decides si estás dentro del grupo élite o te quedas mirando desde afuera.Te espero del otro lado.Aviso importante (reglas de TradingView):
Este es un script privado de pago. No constituye asesoramiento financiero. Operar implica riesgo de pérdida de capital. Los resultados pasados no garantizan resultados futuros. Uso bajo tu propia responsabilidad.
Syntropy System v4 – The Most Powerful Accumulation Strategy Ever ReleasedWORLDWIDE LIMITED EDITION – ONLY 10 LIFETIME SEATSFor the first and last time ever, I’m opening my personal, private strategy that I use every single day to stack Bitcoin, Ethereum, Ethereum and high-conviction altcoins.What you get with Syntropy v48 independent & complementary entry engines (PG Solo, PG+FA, RZ1/RZ2, SFP, Liquidity Sweep, STE Bottom + smart reentries)
Up to 20 pyramiding levels with perfect risk scaling
Dynamic moving averages + extended visual projections
Real-time dashboard (total P&L, invested capital, open/closed trades)
100% visual, non-repainting signals
Built for crypto, but works flawlessly on forex and stocks too
INSANE LAUNCH PRICE – ONLY FOR THE FIRST 10 PEOPLENormal lifetime price: $499 (one-time payment + all future updates forever)LAUNCH PRICE – FIRST 10 BUYERS ONLY:
$50 USD LIFETIME
(Yes, you read that right: fifty dollars one time and the indicator is yours forever)Once these 10 licenses are gone, the price jumps permanently to $499 and will never come back down.7 out of 10 already sold in the last few hours…That leaves only 3 seats at this ridiculous price.Want to be one of the last 3 people on Earth to grab Syntropy v4 for $50 lifetime?Send me a private message RIGHT NOW with the words
“SYNTROPY 50”
and I’ll instantly send you the payment link + immediate access to the protected script.There is no free trial at this price (it would be insane), but I give you my personal word:
If within 30 days you’re not 100% blown away and convinced this is the best strategy you’ve ever used, I’ll refund every single penny — no questions asked.The clock is ticking. In a few hours this $50 offer disappears forever.The first 10 who message me now get lifetime access for only $50.
Everyone else will pay 10× more.Your move: be part of the elite 10 or watch from the sidelines.I’ll see you inside.TradingView Required Disclaimer
This is a paid private script. Not financial advice. Trading involves substantial risk of loss. Past performance is no guarantee of future results. Use only capital you can afford to lose. You are solely responsible for your trading decisions.

Bitcoin Power-Law Bands + Quantile OscillatorDescription
This indicator visualizes a set of statistically derived Power-Law bands for the Bitcoin price.
The model is based on a log–log regression of the Bitcoin price over time and a weighted quantile regression that captures the distributional structure of the price across several long-term quantiles.
It provides a historical context for where the price currently lies relative to these mathematically estimated zones.
This indicator does not perform any new model fitting; it only displays the pre-computed band structure derived from the full historical dataset.
How the model works
This indicator is based on a statistical Power-Law model of the Bitcoin price.
A long-term trend was estimated using a log–log OLS regression, and the deviations from this trend were analyzed through a rolling multi-year volatility measure.
The inverse of this volatility served as the weight for several quantile regression fits, producing robust long-term bands at multiple distribution levels (0.1%, 15%, 50%, 85%, 95%, 99.9%).
These quantile curves represent the historical valuation zones of the Bitcoin price.
All final regression coefficients are fixed and embedded into the Pine script, which reconstructs the bands directly on the chart.
The extension of the bands into the future is based solely on the mathematical form of each curve and does not use any future market data.
What the indicator displays
• Six Power-Law quantile bands (0.1%, 15%, 50%, 85%, 95%, 99.9%) displayed as stacked colored zones
• Future-offset projection curves (mathematical extrapolation of the fitted Power-Laws, not based on future prices)
• Quantile Oscillator: A normalized representation of where the current price lies relative to the quantile structure.
How to use it
This indicator is not a timing tool.
It provides a structural, long-term statistical context for the Bitcoin price, showing:
• how extreme a current valuation is relative to long-term history
• where the price sits within the Power-Law quantile spectrum
• long-term distribution zones derived from the quantile regressions
• a volatility-weighted representation of historical deviations
It may be useful for long-term cycle studies or valuation comparisons, but there is no guarantee that this historical relationship will persist.
Important notes
• This indicator does not repaint.
• All projections are non-predictive mathematical extrapolations.
• This script is designed only for the symbol: INDEX:BTCUSD
• It does not provide trading signals, recommendations, or financial advice.
Why closed-source?
The underlying regression model, weighting logic, and quantile estimations were produced externally using Python and constitute the core intellectual component of the study. The Pine version contains only the pre-calculated parameters and the visualization logic.
