50% level of Daily RangeThe 50% or midpoint between the current days highest and lowest points be used to divide the premium and discount of the days range. Price often reacts at this point and it can be used as a target for reversal trades. This indicator plots the level as it moves through out each day so is useful for backtesting as well as determining whether the current price is in premium or discount.
Pivot-Punkte und Levels

Universe PACut through the noise: The "Universe PA" Strategy
You don't need to get lost in thousands of complex terms like Order Flow, PO3, or Judas Swing. This indicator is based on the purest and most effective form of Price Action: Simplicity.
The Core Philosophy: While many traders focus on old history, the real opportunity lies in the last valid break (BOS). We call this the "Magic Line". The key is the Supply/Demand zone that caused that specific break.
Key Features:
Magic Line (BOS): Automatically marks the level where structure is broken.
Auto Supply & Demand Zones: Identifies the origin of the move (Order Block) that caused the break and draws a zone.
Smart Clean: Keeps your chart clean by automatically removing old/invalid zones, focusing only on the latest opportunity.
Entry Signals: Detects Pinbar (P) and Engulfing (E) patterns to help you time your entry perfectly within the zones.
How to Use:
Identify the "Magic Line" break and the Zone on higher timeframes (e.g., H4).
Wait for price to return (retest) to the Zone.
Look for "P" or "E" signals inside the zone for confirmation.
Simplicity pays.

Momentum Burst Pullback System v66* Detects **momentum “bursts”** using:
* **Keltner breakout** (high above upper band for long, low below lower band for short), and/or
* **MACD histogram extreme** (highest/lowest in a lookback window, with correct sign).
* Optional **burst-zone extension** keeps the burst “active” for N extra bars after the burst.
* Marks bursts with **K** (Keltner) and **M** (MACD) labels:
* Core burst labels use one color, extension labels use a different color.
* Tracks the most recent burst as the **dominant side** (long or short), and stores burst “leg” anchors (high/low context).
* Adds **structure-based invalidation**:
* On a new **core burst**, it locks the most recent **confirmed swing** level (pivot):
* Long: locks the last confirmed **swing low**.
* Short: locks the last confirmed **swing high**.
* After the burst, if price **breaks that locked level**, the burst regime is **cancelled** (and any pending setup on that side is dropped).
* Finds **pullback setups** after a dominant burst (and not inside the active burst zone), within min/max bars:
* Long pullback requires a sequence of **lower highs** and price still below the burst high.
* Short pullback requires **higher lows** and price still above the burst low.
* Optional background shading highlights pullback bars.
* On pullback bars, plots **static TP/SL crosses** using ATR:
* Anchor is the pullback bar’s high (long) or low (short).
* TP/SL are ± ATR * multiple.
* TP plots are visually classified (bright vs faded) based on whether TP would exceed the prior burst extreme.
* Maintains a **state-machine entry + trailing stop**:
* Sets a “waiting” trigger on pullback.
* Enters when price breaks the trigger (high break for long, low break for short).
* Trails a stop using **R-multiples**, with different behavior pre-break-even, post-break-even, and near-TP.
* Optionally draws the trailing stop as horizontal line segments.
* Optionally shows a **last-bar label** with the most recent pullback’s TP and SL values.

Ghost Protocol: Smart Money HUD [Ash_TheTrader]👻 GHOST PROTOCOL: The Institutional HUD
"Stop trading blind. Start seeing where the Smart Money is hiding."
Most indicators lag. They tell you what happened. Ghost Protocol tells you what is happening right now by combining two powerful concepts: Volume Absorption (Whale Defense) and Kinematic Physics (Price Velocity).
This is not just an indicator; it is a complete Heads-Up Display (HUD) for scalpers and day traders on NQ, ES, Gold, and Crypto.
🧠 The Concept: Why It Works
Retail traders lose money for two reasons:
Selling into a bottom (where Whales are absorbing orders).
Buying a fake breakout (where price lacks the energy to continue).
Ghost Protocol solves both by visualizing the invisible battle between aggressive orders (Retail) and passive limit orders (Institutions).
🛠️ The 3 Core Features
1. The "Ghost Walls" (Reversal Detector) 🛡️
What it is: Detects when massive volume hits the market but Price fails to progress. This is Absorption. A "Whale" is using a Limit Order Wall to absorb panic selling or FOMO buying.
The Visual:
🟢 Green Ghost Bubble + Beam: Buyers are absorbing sellers. (Bullish Wall).
🔴 Red Ghost Bubble + Beam: Sellers are absorbing buyers. (Bearish Wall).
Sticky Tech: The bubbles "stick" to the wicks perfectly, regardless of zoom level.
2. The "Velocity Terminal" (Breakout Validator) 🚀
What it is: A Physics Engine for price. It calculates Jerk (Change in Acceleration). Standard breakouts often fail, but a breakout with high "Jerk" (Surge) rarely comes back.
The Visual:
🟣 Plasma Purple Candle: Valid Breakout. Price is moving with high physical energy. Safe to follow.
⚪ Grey/Dull Candle: Fakeout. Price broke a level but lacks energy. The move is likely a trap.
3. The Smart Money Dashboard 💻
A sleek, "Classy" panel in the bottom right corner.
Monitors both engines simultaneously:
GHOST WALL: Scans for Reversals (Buy/Sell Walls).
VELOCITY: Scans for Momentum (Surge/Fakeout).
🎯 How to Trade This Script
Strategy A: The "Whale Reversal" (Scalping)
Step 1: Wait for price to push hard into a level.
Step 2 : A Ghost Wall (Ghost Icon 👻) appears.
Step 3 : A vertical Neon Beam lights up the background.
Action: Take the reversal immediately. Place stop loss just behind the bubble.
Strategy B: The "Physics Breakout" (Trend Following)
Step 1: Price breaks a key resistance or support level.
Step 2: Look at the candle color.
If it is Plasma Purple: ENTER. The physics engine confirms true momentum.
If it is Grey: WAIT. It is likely a fakeout designed to trap you.
⚙️ Settings & Customization
Bubble Distance: Adjust how close the Ghost bubbles sit to the candles.
Sensitivity: Tune the "Jerk Threshold" for the physics engine.
Visuals: Toggle the Background Beams, Dashboard size, and Neon colors to fit your dark/light mode setup.
Created by @Ash_TheTrader Trade with the Whales, not against them.
Confluence Levels + Vol Triangles + No-Trade GrayWhen two levels cross: Premarket High (PMH), Premarket Low (PML), Yesterday High (YH), Yesterday Low (YL), Opening Range High (ORH), Opening Range Low (ORL),VWAP, you get a confluence trigger (line cross) that is green for a bull signal and red for a bear signal. Orange line cross signals confluence, but it is unclear what direction. Additional confluence is signaled by a triangle once volume

Liquidity Sweep Reentry ToolkitHere’s a clear breakdown of what your Liquidity Sweep Reentry Toolkit script does, and how you can use it on your charts:
🔎 Script Breakdown
1. Visual Controls (Inputs)
• : Master toggle to turn all visuals on/off.
• : Show labels when a liquidity sweep + ChoCh condition occurs.
• : Plot green/red triangles for bullish/bearish reentry signals.
• : Prevent multiple signals within the same swing.
• : Show HH/HL/LL/LH market structure letters.
• : Slider to adjust how dim the background of HH/HL/LL/LH labels appear.
2. Core Conditions
• Defines simple bullish () and bearish () candles.
• is a placeholder for your Change of Character logic.
3. Sweep Detection
• : Detects when price makes a new high compared to the last 5 bars.
• : Detects when price makes a new low compared to the last 5 bars.
4. Restriction Flags
• Tracks whether a sweep signal has already triggered in the current swing.
• Resets when sweeps end, so new signals can appear.
5. Composite Triggers
• : Fires when bullish candle + buy-side sweep + ChoCh condition align.
• : Fires when bearish candle + sell-side sweep + ChoCh condition align.
6. Visual Labels
• Gold labels mark “BS Sweep + ChoCh” or “SS Sweep + ChoCh” events.
• Green triangle below bar = bullish reentry.
• Red triangle above bar = bearish reentry.
• Blue HH/HL/LL/LH labels narrate market structure pivots, with adjustable transparency.
7. Alerts
• Alerts can be set for bullish or bearish sweep reentry triggers, so you get notified when conditions align.
📘 How to Use It
1. Apply to Chart
Add the script to your TradingView chart (works best on intraday timeframes like 5‑minute).
2. Configure Visuals
• Use the Visual Controls panel to toggle features on/off.
• Adjust the Label Transparency slider to dim or brighten the HH/HL/LL/LH labels.
3. Interpret Signals
• Gold labels show when a sweep + ChoCh condition occurs.
• Triangles mark potential reentry points (green = bullish, red = bearish).
• HH/HL/LL/LH labels narrate market structure shifts for clarity.
4. Set Alerts
• Use the built‑in alert conditions to get notified when bullish or bearish sweep reentry triggers fire.
👉 In short: this toolkit helps you spot liquidity sweeps, confirm with ChoCh, and visualize reentry signals, while also narrating market structure pivots. It’s modular, so you can toggle features depending on how much visual clutter you want.
🛠 Workflow Example
1. Setup
• Apply the script to your chart (e.g., 5‑minute S&P futures).
• In the indicator settings, decide which visuals you want:
• Turn on Sweep + ChoCh labels if you want to see gold tags narrating liquidity events.
• Keep Entry triangles on to highlight actionable reentry points.
• Adjust the Label Transparency slider so HH/HL/LL/LH structure labels are dim enough not to clutter.
2. Watch for Sweeps
• As price pushes above recent highs → a Buy‑side Sweep is detected.
• As price dips below recent lows → a Sell‑side Sweep is detected.
• If ChoCh logic is true at the same time, you’ll see a gold label (“BS Sweep + ChoCh” or “SS Sweep + ChoCh”).
3. Confirm Reentry
• If conditions align (bullish candle + buy‑side sweep + ChoCh), you’ll see a green triangle below the bar.
• If bearish candle + sell‑side sweep + ChoCh, you’ll see a red triangle above the bar.
• These triangles are your potential reentry triggers.
4. Narrate Market Structure
• HH/HL/LL/LH labels appear at pivots, giving you a running commentary of structure shifts.
• Example: HH → HL → HH shows bullish continuation; LH → LL → LH shows bearish pressure.
• Use the transparency slider to keep these labels subtle but visible.
5. Alerts
• Set alerts for “Bullish Sweep Reentry” or “Bearish Sweep Reentry” so you don’t miss signals even if you’re away from the screen.
📘 How to Use in Practice
• Intraday trading: On a 5‑minute chart, use the toolkit to spot liquidity grabs and confirm reentry points.
• Narration: The HH/HL/LL/LH labels help you keep track of structure without manually marking pivots.
• Decision making: Gold labels + triangles = potential trade setups. Structure labels = context for trend bias.
• Customization: Dim labels when you want a cleaner chart, brighten them when you’re focused on structure.
👉 In short: this script gives you a modular toolkit — sweeps, ChoCh confirmation, reentry signals, and structure narration — all adjustable so you can tailor the visuals to your workflow.
📈 Bullish Scenario Walkthrough
1. Market Context
• You’re watching the 5‑minute chart.
• Price has been consolidating near recent highs, building liquidity above.
2. Liquidity Sweep
• Price spikes above the prior swing high → the script detects a buy‑side sweep.
• A gold label appears: “BS Sweep + ChoCh” (if your ChoCh condition is true).
3. Change of Character (ChoCh)
• The candle closes bullish ().
• Your ChoCh condition confirms a structural shift.
• Together, sweep + ChoCh = potential reentry setup.
4. Reentry Trigger
• The script plots a green triangle below the bar.
• This marks a bullish sweep reentry signal: price grabbed liquidity and is now showing strength.
5. Market Structure Narration
• At the same time, the HH/HL labels update:
• The sweep bar prints a new HH.
• The next pivot low prints an HL.
• This narrates bullish continuation: HH → HL → HH.
6. Trade Decision
• You can use the green triangle as your entry cue.
• The HH/HL narration gives you confidence that structure supports the trade.
• Alerts can be set so you don’t miss the trigger.
7. Risk Management
• Stop placement: below the HL pivot or sweep low.
• Target: next liquidity pool above, or measured move.
🧭 How to Use This in Practice
• Gold label = liquidity event + ChoCh confirmation.
• Green triangle = actionable bullish reentry trigger.
• HH/HL narration = context for trend bias and trade management.
• Transparency slider = keep structure labels subtle so the chart stays clean.
📉 Bearish Scenario Walkthrough
1. Market Context
• You’re watching the 5‑minute chart.
• Price has been consolidating near recent lows, building liquidity underneath.
2. Liquidity Sweep
• Price spikes below the prior swing low → the script detects a sell‑side sweep.
• A gold label appears: “SS Sweep + ChoCh” (if your ChoCh condition is true).
3. Change of Character (ChoCh)
• The candle closes bearish ().
• Your ChoCh condition confirms a structural shift.
• Together, sweep + ChoCh = potential bearish reentry setup.
4. Reentry Trigger
• The script plots a red triangle above the bar.
• This marks a bearish sweep reentry signal: price grabbed liquidity below and is now showing weakness.
5. Market Structure Narration
• At the same time, the LH/LL labels update:
• The sweep bar prints a new LL.
• The next pivot high prints a LH.
• This narrates bearish continuation: LH → LL → LH.
6. Trade Decision
• You can use the red triangle as your entry cue.
• The LH/LL narration gives you confidence that structure supports the short.
• Alerts can be set so you don’t miss the trigger.
7. Risk Management
• Stop placement: above the LH pivot or sweep high.
• Target: next liquidity pool below, or measured move.
🧭 How to Use This in Practice
• Gold label = liquidity event + ChoCh confirmation.
• Red triangle = actionable bearish reentry trigger.
• LH/LL narration = context for trend bias and trade management.
• Transparency slider = keep structure labels subtle so the chart stays clean.

Premarket, Previous Day, Current Day high/lowHighs and lows for premarket, previous day, and current day

X-trend Liquidation Heatmap 🔥 X-TREND Liquidation Heatmap: Market Fuel Visualization
Stop trading blindly. X-Trend Liquidation Heatmap is an institutional-grade analytical tool designed to reveal what remains hidden from most retail traders: where the crowd's money is located.
The market always moves from liquidity to liquidity. This script transforms your chart into a professional heatmap, highlighting the specific price zones where stop-losses and liquidation levels of leveraged traders (10x, 25x, 50x, 100x) are concentrated. These are not just support and resistance lines—they are magnets for price action.
💎 WHAT YOU SEE ON THE CHART:
🟣 Liquidity Gradient Heatmap: Our unique algorithm visualizes the "density" of resting orders.
Faint Zones: Liquidation levels of low leverage positions (10x-25x).
Bright Neon Zones: Dense clusters of high leverage liquidations (50x-100x). Price often spikes through these zones to "sweep" the liquidity.
🟡 Gold Zones (Tested Liquidity): Areas of maximum interest that price has touched but not broken. These represent critical defense levels protected by market makers.
📊 Market Pressure Dashboard: A built-in panel analyzes Buyer/Seller pressure across all timeframes (LTF, MTF, HTF) + BTC Correlation. You get a clear numerical view of market sentiment (e.g., "Total 92% Long Pressure").
HOW TO USE IT? Stop placing your stop-losses where everyone else does. Use these zones as targets for Take Profit (exit into the crowd's liquidity) or look for reversal patterns when price "sweeps" a bright zone.
🚀 Perfect Synergy: Use the Heatmap to define your TARGETS, and use X-Trend Reversal (PRO) to pinpoint the exact ENTRY.
🔒 HOW TO GET ACCESS (INVITE-ONLY)
This script is a closed-source proprietary tool. Access is granted exclusively through our official channels.
⛔ NOTE: We do NOT respond to access requests in the comment section below. Please use the links above for instant support and license activation.

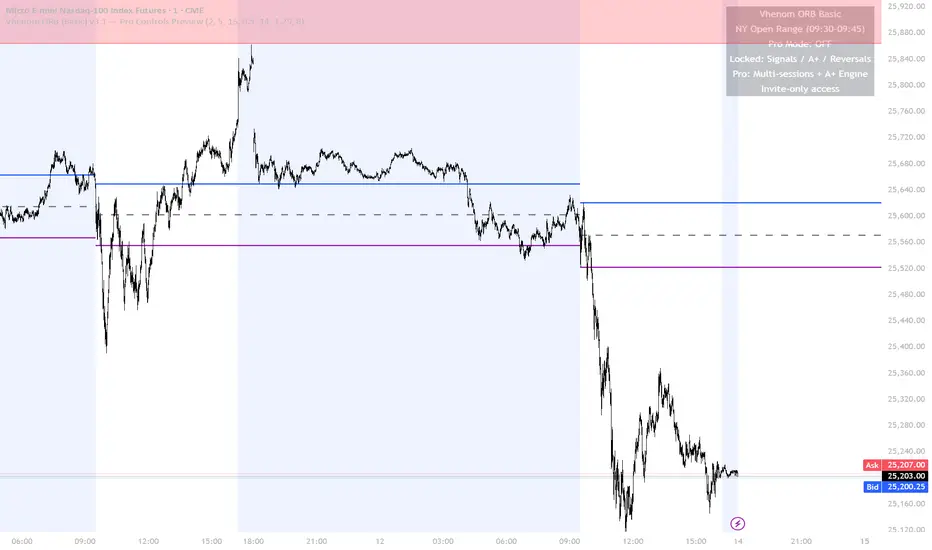
Vhenom ORB (Basic)Vhenom ORB (Basic)
Opening Range Levels for the NY Session
Vhenom ORB (Basic) is a clean, no-nonsense Opening Range indicator designed for traders who want clear NY session structure without clutter.
This version plots the Opening Range High, Low, and Midline for the 9:30–9:45 New York session, then extends those levels for the rest of the trading day so you can trade reactions, breakouts, and acceptance with clarity.
It’s intentionally simple, fast, and lightweight — perfect for discretionary traders who prefer to manage entries and risk manually.
What This Version Includes
• NY Session Opening Range (9:30–9:45 ET)
• ORB High, Low, and optional Midline
• Levels extend through the full trading day
• Previous ORBs remain on chart for context
• Custom colors, line width, and label controls
• No repainting, no signals, no noise
Who This Is For
• Futures, index, and day traders
• Traders who already understand ORB concepts
• Discretionary execution (you decide entries & exits)
• Anyone who wants structure without automation
What This Version Does Not Include
This Basic edition does not include:
• Breakout signals
• A+ momentum filtering
• Failed breakout (reversal) logic
• Multiple ORB sessions
• Advanced session controls
• Automated signal timing
Those features are intentionally reserved for the Professional version.
Looking for More?
If you want confirmed breakouts, A+ momentum filtering, failed breakout reversals (R Buy / R Sell), and multi-session ORBs, check out:
👉 Vhenom ORB A+ (Professional)
whop.com
The Professional version is invite-only and built for traders who want structured confirmation, not guesswork.
Final Notes
This script is designed as a foundation tool.
Trade it your way — combine it with your own execution, risk management, and higher-timeframe bias.
No claims. No hype. Just structure.
Gann Volume Swing (GVS)## **Gann Volume Swing (GVS) Indicator**
*Professional Hybrid Volume-Gann Reversal Detector*
### **Core Concept & Purpose**
The Gann Volume Swing (GVS) indicator is a sophisticated trading tool designed to identify high-probability reversal points by integrating three key market dimensions: **volume dynamics**, **geometric price levels**, and **momentum confirmation**. Developed for serious technical traders, GVS addresses the common challenge of distinguishing meaningful breakouts/reversals from temporary noise.
The indicator operates on the principle that **significant volume expansions** at **precise geometric support/resistance levels** (derived from Gann theory) often precede substantial price movements. By combining these elements with traditional momentum filters (RSI, MACD), GVS provides a multi-factor approach to market timing.
### **Theoretical Foundation**
The methodology synthesizes:
1. **Wyckoff's Volume-Price Relationship**: Volume precedes and confirms price action
2. **Gann's Geometric Trading**: Price moves in predictable angular patterns from swing points
3. **Modern Momentum Filters**: Additional confirmation from established oscillators
This creates a robust framework that respects both classical technical analysis and contemporary trading psychology.
---
## **TECHNICAL ARCHITECTURE**
### **1. Volume Engine Module**
```
Inputs:
• Volume MA Period (20): Smoothing window for volume baseline
• Volume Multiplier (2.0): Threshold for "abnormal" volume detection
Calculation Logic:
Current Volume > AND
Current Volume >
Output: Boolean flag signaling institutional-grade participation
```
### **2. Gann Geometry Module**
```
Pivot Detection:
• Swing Highs: PivotHigh(25,25) - Identifies significant peaks
• Swing Lows: PivotLow(25,25) - Identifies significant troughs
Line Generation:
• 1x1 Lines: Base angular lines from pivots (45-degree equivalents)
• 2x1 Lines: Secondary steeper/flatter lines (dynamic angles)
Key Parameter:
• Gann Sensitivity (0.5): Controls line steepness (0.1=flat, 1.0=steep)
```
### **3. Signal Generation Logic**
```
Long Signal =
+ + + +
Short Signal =
+ + + +
Anti-Whipsaw Protection:
• 5-bar cooldown between same-direction signals
• Proximity threshold: 0.5×ATR from Gann lines
```
### **4. Visualization System**
```
Primary Elements:
• Real-time Gann lines (4 colors, 2 styles)
• Signal markers (▲/▼ triangles)
• Bar coloring (lime/red highlights)
Display Control:
• Toggle Gann lines on/off
• Adjust transparency levels
• Custom alert configurations
```
---
## **QUICK REFERENCE CARD**
**GANN VOLUME SWING (GVS)**
*Volume-Powered Geometric Reversal Indicator*
### **🔧 PARAMETER SETTINGS**
**VOLUME GROUP**
`Volume MA Period`: 20 (14-30 range)
`Volume Multiplier`: 2.0 (1.5-2.5 optimal)
**GANN GROUP**
`Swing Period`: 50 bars (pivot sensitivity)
`Gann Sensitivity`: 0.3-0.5 (adjust for market type)
**FILTERS GROUP**
`RSI Period`: 14 (standard)
`Use Filters`: ON (recommended)
**DISPLAY GROUP**
`Show Gann Levels`: ON
`Cooldown Bars`: 5 (prevents signal flooding)
### **🎯 SIGNAL INTERPRETATION**
**LONG SETUP (Green ▲)**
- Volume spike (2× average) + Price at Gann support + Bullish candle
- Entry: Close of signal bar
- SL: 1.5×ATR below support line
- TP: Next Gann resistance or 2:1 R/R
**SHORT SETUP (Red ▼)**
- Volume spike + Price at Gann resistance + Bearish candle
- Entry: Close of signal bar
- SL: 1.5×ATR above resistance line
- TP: Next Gann support or 2:1 R/R
### **📊 VISUAL ELEMENTS KEY**
**LINES**
- `Solid Green`: 1x1 Support (primary)
- `Solid Red`: 1x1 Resistance (primary)
- `Blue Dots`: 2x1 Support (secondary)
- `Orange Dots`: 2x1 Resistance (secondary)
**MARKERS**
- `▲ Below Bar`: Long signal
- `▼ Above Bar`: Short signal
- `Bar Coloring`: Confirmation highlight
### **⚙️ OPTIMIZATION GUIDE**
**TRENDING MARKETS**
- Sensitivity: 0.2-0.3 (shallower angles)
- Volume Multiplier: 1.8-2.0
- Filters: Strict (RSI 65/35)
**RANGING MARKETS**
- Sensitivity: 0.6-0.8 (steeper angles)
- Volume Multiplier: 2.2-2.5
- Filters: Moderate (RSI 70/30)
**HIGH VOLATILITY**
- Increase ATR multiplier to 0.7-1.0
- Extend cooldown to 7-10 bars
- Require stronger volume confirmation
### **🚫 LIMITATIONS & NOTES**
**KNOWN CONSTRAINTS**
- Less effective in extremely choppy markets
- Requires adequate historical data (200+ bars)
- Volume reliability varies by asset class
- Gann lines repaint as new pivots form
**BEST PRACTICES**
- Combine with higher timeframe trend analysis
- Use on 1H+ charts for reliability
- Wait for close confirmation before acting
- Track win rate by market condition
**ALERT CONFIGURATION**
- Enable both Long/Short alerts
- Set to "Once Per Bar Close"
- Include ATR distance in alert message
- Log all signals for performance review
---
## **TRADING SYSTEM INTEGRATION**
### **Recommended Confluence Factors**
1. **Trend Alignment** (Higher timeframe direction)
2. **Market Structure** (Support/Resistance clusters)
3. **Economic Context** (News event proximity)
4. **Session Timing** (High-volume trading hours)
### **Risk Management Protocol**
- Maximum risk: 1% per trade
- Correlation limit: 2 simultaneous GVS signals
- Daily loss cap: 3% of portfolio
- Weekly review of signal accuracy
### **Performance Metrics to Track**
- Signal-to-Noise ratio (profitable signals/total)
- Average Reward/Risk achieved
- Best/worst market conditions
- Optimal parameter sets per asset
---
## **SUMMARY**
The **Gann Volume Swing** indicator represents a sophisticated approach to technical analysis, blending time-tested principles with modern computational techniques. By focusing on the confluence of **unusual volume**, **geometric price levels**, and **momentum confirmation**, it provides traders with a structured framework for identifying high-quality setups.
**Ideal User Profile**: Intermediate to advanced traders comfortable with multi-factor analysis, geometric concepts, and disciplined risk management.
**Disclaimer**: This tool generates probabilities, not certainties. Always combine with comprehensive market analysis and strict risk control measures.
---
**Version**: 5.0
**Category**: Volume + Geometric Analysis
**Complexity**: Advanced
**Best Timeframe**: 1H - Daily
**Recommended Assets**: Liquid stocks, major Forex pairs, indices

QQQ Overlay on NQ/NDX by @DashingBixbyEnhanced version of PtGambler's for drawing QQQ levels over NQ/NDX.

Next Day CPR LevelsThis indicator plots the next trading day’s Central Pivot Range (CPR) levels in advance, allowing traders to prepare key reference levels before the market opens.
CPR is a widely used market structure tool that helps traders identify intraday bias, balance vs expansion, and potential support–resistance zones. By projecting tomorrow’s CPR levels today, traders can plan entries, exits, and risk more effectively instead of reacting during live market movement.
The indicator derives structured reference levels based on prior market behavior and established pivot-based principles. These levels are projected onto the chart to provide a stable framework for analyzing price action during the trading session.
Rather than reacting to live price fluctuations, the indicator focuses on pre-defined market structure, allowing traders to evaluate price acceptance, rejection, and momentum around key zones.
The spacing and positioning of these levels offer insight into prevailing market conditions, helping traders distinguish between balance, expansion, and directional movement.
The plotted levels remain consistent throughout the session, providing a reliable context for decision-making.
Important : You have to toggle on Next day levels in settings for Next days projection. Better you turn off during live market to clear noise and toggle on again once the market closes or You can use it post market close for analysis.
This works for Nifty, Banknifty, other Indian stocks and Indices as well.

X-Trend Reversal (Lite version)🚀 X-TREND REVERSAL (LITE): Market Extremes Detector
X-Trend Reversal is a professional algorithm designed to identify high-probability trend inflection points. We have stripped away the "noise" to provide you with deterministic, clean execution signals.
Unlike standard lagging indicators, X-Trend analyzes market structure to find the exact moment a trend is exhausted, giving you the "Sniper Entry" advantage.
💎 KEY FEATURES:
🛡 Immutable Signals: Guaranteed Non-Repainting technology. What you see on historical data is exactly what happened in real-time. No disappearing signals.
🎯 High-Probability Setups: Advanced filtering logic eliminates false moves to pinpoint the most reliable counter-trend entry points.
🌍 Multi-Timeframe Scalability: Universal adaptation to the volatility of any asset class (Crypto, Forex, Indices) and any timeframe (from 15s scalping to 4H swing trading).
🏛 Institutional Confidence: Trade reversals with the clarity usually reserved for institutional desks.
📊 X-TREND ECOSYSTEM
This indicator is a powerful standalone tool, but it is designed to be part of a larger professional suite. For a comprehensive market view and deeper confluence analysis, we highly recommend pairing this tool with our X-Trend Dashboard and other advanced modules from the X-Trend series. Combining these tools provides a 360-degree view of market sentiment and liquidity.
🔒 HOW TO GET ACCESS (INVITE-ONLY)
This script is a closed-source proprietary tool. Access is granted exclusively through our official channels.
⛔ NOTE: Please do not ask for access in the comment section below. Use the links above for instant support and license activation.

FreeSisters - System v1.8System v1.8
Marks out high time frame levels.
Market Structure defined by quarters theory, based on the lowest price within a 12 month period.

QSYCThis indicator helps one to take huge longer term bets on the basis of
Quarterly
Semi Annually
Yearly
Custom levels

SB-VDEMA + PivotsBest use - Intraday Scalping ( 1 Mt, 3 Mts, 5 Mts )
Uses Volatility weighted DEMA for smoother and reliable signals.
One can use dynamic colour coding of VWDEMA for entering call or puts. VWAP and Henkin ashi Supertrend is also there but, i think VWDEMA is quite enogh for decision making.

The Rumers - Magic LinesThe Rumers Magic Lines identify key pivotal price points commonly used by institutional traders as liquidity areas to fill positions.
These levels highlight zones where large players are most active — areas where price tends to pause, reverse, or accelerate as liquidity is absorbed.
I personally use Magic Lines to:
Buy near the lower lines
Sell near the upper lines
Combine them with Pitchfork structure and candlestick confirmation for precise entries and exits
This indicator is not a signal by itself. It provides context and structure, allowing you to align with institutional activity and let price action confirm the trade.
Clean levels. Institutional logic. No noise.
by Silvia Rumer
Trade Live with The Rumers:
course.therumers.com

Daily Levels ImporterUser Guide: Daily Levels Importer
What This Indicator Does
This tool allows you to instantly draw multiple support and resistance lines on your TradingView chart by pasting a list of data. It avoids the need to manually draw lines one by one. It also features a dashboard to identify the ticker and filters to toggle specific line colors on or off.
1. The Data Format
The indicator reads text in a specific 3-column format (Comma Separated).
Format: \, \, \
* Ticker: The symbol name (used for the dashboard display).
* Price: The price level where the line will be drawn.
* Color Code:
r = Red
g = Green
y = Yellow
Example:
ES, 4150.25, r
ES, 4200.00, g
ES, 4175.50, y
2. How to Use It
3. Copy Your Data: Select your list of levels (from Excel, a text file, or a website) and copy them to your clipboard.
4. Open Settings: On your TradingView chart, hover over the indicator name and click the Settings (Gear Icon).
5. Paste Data:
* Find the "Paste Data Here" text box in the Inputs tab.
* Delete any existing text.
* Paste your new list.
6. Save: Click OK. The lines will instantly render on your chart.
7. Controls & Filters
You can customize the view without deleting data by using the checkboxes in the Settings menu:
* Line Filters:
* Show Red Levels: Uncheck to hide all red lines.
* Show Green Levels: Uncheck to hide all green lines.
* Show Yellow Levels: Uncheck to hide all yellow lines.
* Dashboard Location:
* Use the dropdowns to move the Ticker ID box to any corner of the screen (e.g., Top Right, Bottom Left) or change its size.
8. Troubleshooting
Lines aren't showing up?
* Ensure the prices match the asset you are viewing (e.g., don't paste SPX prices on an AAPL chart).
* Check if you accidentally unchecked the "Show " box in the settings.
"No Data" in Dashboard?
* The script reads the ticker name from the first row of your pasted data. Ensure the first row is not blank.
Is there a limit?
* Yes. TradingView allows approximately 4,000 characters in the text box. This is roughly 250 lines of price levels. If you need more, add a second instance of the indicator to the chart.

Smart High low Pivot Points
## Description
The **Pivot High Low Indicator** is a powerful technical analysis tool designed to automatically identify and highlight significant pivot points in price action. This indicator marks crucial reversal zones where price has formed local peaks (pivot highs) and troughs (pivot lows), helping traders spot potential support/resistance levels and trend reversal points.
The indicator features intelligent price formatting that adapts to any market - from crypto tokens to large-cap stocks - displaying values in readable formats (M/B/T notation for large numbers, precise decimals for small values).
---
## Key Features
### 🎯 **Dual Pivot Detection System**
- **Pivot Highs**: Automatically identifies local price peaks where price is higher than surrounding bars
- **Pivot Lows**: Detects local price bottoms where price is lower than surrounding bars
- Independent left/right length settings for each pivot type
### 🎨 **Fully Customizable Appearance**
- Separate color controls for pivot high and low labels
- Custom text colors for optimal visibility
- Distinct label background colors (default: green for highs, red for lows)
- Clean, non-intrusive chart overlay
### ⚙️ **Flexible Configuration**
- Adjustable left/right bar lengths for sensitivity control
- Independent settings for highs and lows
- Real-time adaptation to market conditions
---
## Benefits
✅ **Identify Key Support & Resistance Levels** - Pivot points often act as important price levels where reversals occur
✅ **Spot Trend Reversals Early** - Recognize when momentum shifts from bullish to bearish or vice versa
✅ **Enhanced Market Structure Analysis** - Understand swing highs and lows for better trade timing
✅ **Works Across All Markets** - Optimized for stocks, forex, crypto, commodities, and indices
✅ **Clean Visual Presentation** - Labeled price points directly on chart without clutter
✅ **Universal Price Display** - Automatically formats prices for readability regardless of asset value
## Settings Available
### **LENGTH LEFT / RIGHT**
| Setting | Default | Min | Description |
|---------|---------|-----|-------------|
| **Pivot High - Left** | 15 | 1 | Number of bars to the left that must be lower than the pivot high |
| **Pivot High - Right** | 15 | 1 | Number of bars to the right that must be lower than the pivot high |
| **Pivot Low - Left** | 7 | 1 | Number of bars to the left that must be higher than the pivot low |
| **Pivot Low - Right** | 7 | 1 | Number of bars to the right that must be higher than the pivot low |
**💡 Tip**: Higher values = fewer, more significant pivots. Lower values = more frequent, minor pivots.
### **TEXT COLOR / LABEL COLOR**
| Setting | Default | Description |
|---------|---------|-------------|
| **Pivot High - Text Color** | White | Color of the price text on pivot high labels |
| **Pivot High - Label Color** | Green (#005703) | Background color of pivot high labels |
| **Pivot Low - Text Color** | White | Color of the price text on pivot low labels |
| **Pivot Low - Label Color** | Red (#7b0000) | Background color of pivot low labels |
## Use Cases
- 📈 **Swing Trading**: Identify swing high/low entry and exit points
- 🎯 **Support/Resistance**: Mark key levels for limit orders
- 📊 **Market Structure**: Analyze higher highs/higher lows or lower highs/lower lows
- ⚡ **Breakout Trading**: Spot when price breaks above pivot highs or below pivot lows
- 🔄 **Reversal Trading**: Enter trades at confirmed pivot points

Impulse %Impulse % — Liquidation Cascade Detector (BTC · 1H)
Impulse % identifies sharp impulsive price moves and liquidation cascades by measuring how much a candle’s range deviates from its historical average in percent.
How it works
Calculates the candle range (in %) relative to price and compares it to the average over N periods.
When the range exceeds the upper band, an Impulse is detected.
Inside each 1H candle, the indicator checks lower timeframes (1m / 5m) to classify the impulse phases:
PANIC — the first minutes of a violent move (forced liquidations, stop hunts).
CAUTION (Cascade) — continuation and “cleanup” phase with elevated risk.
Determines whether the impulse is against the trend using EMA 50 / EMA 200 — the most dangerous scenario.
Highlights risk zones to protect positions and filter new entries.
What it’s for
Avoid entering during liquidation cascades.
Exit at break-even or partially take profit during risky phases.
Recommended Settings — BTC (1H)
Calculation
Calculation TF: (empty = current)
Average Mode: By N bars
N (bars): 100
Range Type: High–Low
Bands
Upper Band (% of average): 130
Lower Band: Auto (same %)
Cascade (First Minutes)
Enable Cascade Filter: ON
When to trigger safety: Only against trend
PANIC (minutes): 3
CAUTION (minutes after PANIC): 15
Trend (EMA)
Use EMA Trend: ON
Fast EMA: 50
Slow EMA: 200
Lower TF Detection
Lower TF: 1m (or 5m if you prefer smoother signals)
Visualization
Style: Columns
Show Bands: ON
Show Band Lines & Mean: ON
How to read it (BTC · 1H)
Purple (PANIC): first minutes of liquidation — do not enter.
Yellow (CAUTION): cascade phase — high risk, manage/exit.
Normal color: no active cascade — strategy allowed.
Best practice:
1m/5m → real-time cascade detection
1H → decision level
4H → market context

VD FRFS PROVD FRFS PRO
This trader centric, multi-functional indicator built on Pine Script v6 that seamlessly integrates four of the most critical price and volatility tools into a single overlay. Designed for day traders, swing traders, and institutional analysts, this tool provides a comprehensive view of volatility, trend, volume-based pricing, and structure, all without chart clutter.
Overview & Concept
The VD FRFS PRO is engineered for efficiency and clarity. Instead of layering four separate indicators, which can lead to performance issues and confusion, this script combines the calculations into one, allowing traders to execute complex technical analysis rapidly.
It serves as a powerful foundation for strategies that require:
1. Volatility Assessment (Bollinger Bands)
2. Volume-Weighted Fair Value (VWAP)
3. Price Structure & Swings (Zig Zag)
4. Dynamic Trend Filtering (Configurable SMA)
Customization & Settings
All inputs are logically grouped for ease of use in the indicator's settings menu.
Bollinger Bands Settings
BB Length: Period for the Basis SMA and StdDev calculation (default: 20).
BB Source: Price series for the calculation (default: `close`).
BB StdDev Multiplier: Multiplier for the Standard Deviation (default: 2.0).
BB Offset: Shifts the bands horizontally (default: 0).
VWAP Settings
VWAP Source: Price series for the VWAP calculation (default: `hlc3`).
Zig Zag Settings
Zig Zag High/Low Length: Lookback period for determining swing points (default: 3).
SMA Settings
SMA Period: Lookback period for the configurable SMA (default: 20).
Show SMA: Checkbox to toggle the visibility of this SMA (default: `true`).
Disclaimer
Feel free to reach out for suggestions and modification requests.

Vortex Imbalance DetectorVortex Imbalance Detector (VID)
Core Purpose:
To spot "fresh" institutional order flow entering the market, aiming to catch the early stage of a potential reversal driven by an imbalance between aggressive buyers and sellers.
It looks for moments when a surge in buying or selling pressure coincides with a sharp acceleration in price momentum at a market extreme.
The Vortex Imbalance Detector identifies high-probability reversal points by detecting simultaneous shifts in order flow (buy/sell pressure) and price momentum acceleration.
What It Does:
Order Flow Proxy: Creates a cumulative delta-like metric using price action (body vs. range) to estimate net buying or selling pressure.
Momentum Vortex: Calculates price acceleration (the rate of change of velocity) to gauge the force behind a move.
Imbalance Signal: Triggers when both conditions align:
Flow Flip: The order flow proxy crosses above/below zero with significant strength (exceeding a threshold).
Vortex Reversal: The momentum acceleration confirms the direction (positive for buys, negative for sells).
Price Extreme: The signal occurs at a recent low (for buys) or high (for sells).
Output:
Buy Signal (▲): A bullish order flow imbalance with upward momentum acceleration at a short-term low.
Sell Signal (▼): A bearish order flow imbalance with downward momentum acceleration at a short-term high.

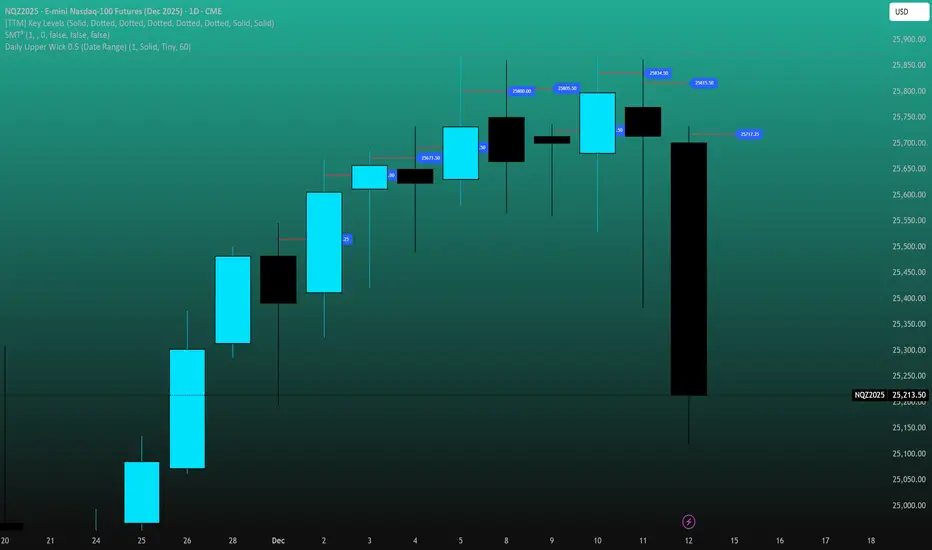
Daily Upper Wick 0.5 (Date Range)Appearance settings modified: Extend lines OFF, level color, Date Range filter, line thickness, Prices labeled and resized tiny, plot lines OFF.