Inversion Fair Value Gap Model [PJ Trades]GENERAL OVERVIEW:
The Inversion Fair Value Gap Model indicator is a complete rule-based system designed to identify trade setups using the Inversion Fair Value Gap strategy taught by PJ Trades. It automates the strategy’s workflow by detecting liquidity sweeps, confirming V-shape recoveries, identifying valid Inversion Fair Value Gaps, validating higher-timeframe Fair Value Gap taps, and checking for a clear opposite Draw On Liquidity. These factors are evaluated together to produce a signal rating of A, A+, or A++, based on how many of these criteria the setup satisfies. When a long or short setup is confirmed, the indicator automatically plots an entry, stop-loss, break-even, and two take-profit levels.
A dashboard that updates in real-time displays the current directional bias, liquidity sweep activity, Inversion Fair Value Gap confirmation state, V Shape Recovery state, higher-timeframe Fair Value Gap context, opposite Draw on Liquidity, SMT divergence, and other key information relevant to the trading model. The indicator also includes optional trade statistics on the dashboard that tracks the recent win rates for A, A+, and A++ setups, as well as separate long and short win rates.
This indicator was developed by Flux Charts, in collaboration with PJ Trades.
What is the theory behind the indicator?:
The Inversion Fair Value Gap model is built on the idea that when the market pushes above a high or below a low, it often does so to sweep liquidity. If that move quickly fails and price reverses, it shows the sweep was a grab for orders and not a continuation. That quick rejection is the V Shape Recovery behavior. An Inversion Fair Value Gap forms when a Fair Value Gap that once supported the original move gets invalidated afterward. That invalidation confirms the shift in direction and becomes the new reference point for trades. The Inversion Fair Value Gap model uses this sequence because it highlights when the market has taken liquidity, rejected continuation, and started delivering in the opposite direction.
INVERSION FAIR VALUE GAP MODEL FEATURES:
The Inversion Fair Value Gap Model indicator includes 15 main features:
Sessions
Key Levels & Swing Levels
Liquidity Levels
Liquidity Sweeps
V Shape Recoveries
Higher-Timeframe Fair Value Gaps
Inversion Fair Value Gaps
Macros
Bias
Signals
New Day Opening Gap
New Week Opening Gap
SMT Divergences
Dashboard
Alerts
SESSIONS:
The Inversion Fair Value Gap Model indicator includes five trading sessions (times in EST):
Asia: 20:00 - 00:00
London: 02:00 - 05:00
NY AM: 09:30 - 12:15
NY Lunch: 12:15 - 13:30
NY PM: 13:30 - 16:00
Session highs and lows are automatically tracked and used within the indicator’s signal logic.
🔹Session Zones:
Each session has a zone that outlines its active time window. These zones can be toggled on or off independently. When active, they visually separate each part of the trading day. Users can adjust the color and opacity of each session box. Users can also enable session labels, which place a label above each session zone showing its corresponding session name.
🔹Session Time:
Users can toggle on ‘Time’ which will display each session’s time window next to its session title.
🔹Session Highs/Lows:
Every session can display its own high and low as horizontal lines. Users can customize the line style for session highs/lows, choosing between solid, dashed, or dotted. The color of the lines will match the same color used for the session box. Users can adjust the color of the labels as well, which is applied to all session high/low labels.
When price has moved above a session high, or below a session low, the label will not be displayed anymore.
🔹Extend Levels:
When enabled, each session’s high and low levels can be extended forward by a set number of bars.
Please Note: Disabling a session under the main Sessions section only hides its visuals (boxes, lines, or labels). It does not impact signal detection or logic.
KEY LEVELS:
The Inversion Fair Value Gap Model indicator includes 11 key market levels that outline important structural price areas across daily, weekly, and monthly timeframes. These levels include the Daily Open, Previous Day High/Low, Weekly Open, Previous Week High/Low, Monthly Open, Previous Month High/Low, Midnight Open, and 08:30 Open. The levels can be enabled or disabled and customized in color and line style. All of the levels except the Midnight Open and 08:30 Open are used for the indicator’s signal logic.
🔹Daily Open
The Daily Open marks where the current trading day began.
🔹Previous Day High/Low
The Previous Day High (PDH) marks the highest price reached during the previous regular trading session. It shows where buyers pushed price to its highest point before the market closed.
The Previous Day Low (PDL) marks the lowest price reached during the previous regular trading session. It shows where selling pressure reached its lowest point before buyers stepped in.
When price pushes above the PDH or below the PDL, the level is removed from the chart.
🔹Weekly Open
The Weekly Open marks the first price of the current trading week.
🔹Previous Week High/Low
The Previous Week High (PWH) marks the highest price reached during the previous trading week. It shows where buying pressure reached its peak before the weekly close.
The Previous Week Low (PWL) marks the lowest price reached during the previous trading week. It shows where sellers pushed price to its lowest point before buyers regained control.
When price pushes above the PWH or below the PWL, the level is removed from the chart.
🔹Monthly Open
The Monthly Open marks the opening price of the current month.
🔹Previous Month High/Low
The Previous Month High (PMH) marks the highest price reached during the previous calendar month. It represents the point at which buyers achieved the strongest push before the monthly close.
The Previous Month Low (PML) marks the lowest price reached during the previous calendar month. It shows where selling pressure was strongest before buyers stepped back in.
When price pushes above the PMH or below the PML, the level is removed from the chart.
🔹Midnight Open
The Midnight Open marks the first price of the trading day at 00:00 EST.
🔹08:30 Open
The 08:30 Open marks the opening price at 08:30 EST.
🔹Customization Options:
Users can fully customize the appearance of all key levels, including the following:
Labels
Label Size
Line Style
Line Colors
Labels:
Users can toggle on ‘Show Labels’ to display labels for each toggled-on level that price hasn’t pushed above/below. Users can also adjust the size of labels, choosing between auto, tiny, small, normal, large, or huge.
Line Style:
Users can select a line style, choosing between solid, dashed, or dotted, which is applied to all toggled-on key levels.
Line Color:
Users can choose different colors for each of the following key levels:
Daily Open, Previous Day High, Previous Day Low
Weekly Open, Previous Week High, Previous Week Low,
Monthly Open, Previous Month High, Previous Month Low
Midnight Open
08:30 Open
🔹Extend Levels:
When enabled, each key level is extended forward by a set number of bars.
Please Note: Disabling a level in the “Key Levels” section only hides its visuals and does not affect the indicator’s signals.
🔹Swing Levels
The indicator automatically plots Swing Highs and Swing Lows which are used in the indicator’s signal generation logic.
A swing high forms when a candle’s high is greater than the highs of the bars immediately before and after it.
A swing low forms when a candle’s low is lower than the lows of the bars immediately before and after it.
🔹Swing Level Colors
Users can customize the color of Active Levels and Swept Levels.
Active Levels are levels that price has not pushed above or below
Swept Levels are levels that price pushed above or below.
🔹Swing Levels – Show Nearest
This setting determines how many swing highs/lows are displayed on the chart. The indicator will display the nearest X highs to price and the nearest X lows to price.
For example, if ‘Show Nearest’ is set to 2, the nearest 2 swing highs and nearest 2 swing lows to price will be plotted on the chart.
LIQUIDITY LEVELS:
The Inversion Fair Value Gap Model indicator automatically identifies and plots liquidity at key structural points in the market. These include swing highs and swing lows, session highs and lows, and major higher timeframe reference points as explained in the SESSIONS and KEY LEVELS sections above. All of these areas are treated as potential pools of resting orders and are used throughout the indicator’s signal logic.
🔹What is Buyside Liquidity?:
Buyside Liquidity (BSL) represents price levels where many buy stop orders are sitting, usually from traders holding short positions. When price moves into these areas, those stop-loss orders get triggered and short sellers are forced to buy back their positions. These zones often form above key highs such as the previous day, week, or month. Understanding BSL is important because when price reaches these levels, the sudden wave of buy orders can create sharp reactions or reversals as liquidity is taken from the market.
🔹What is Sellside Liquidity?:
Sellside Liquidity (SSL) represents price levels where many sell stop orders are waiting, usually from traders holding long positions. When price drops into these areas, those stop-loss orders are triggered and long traders are forced to sell their positions. These zones often form below key lows such as the previous day, week, or month. Understanding SSL is important because when price reaches these levels, the surge of sell orders can cause sharp reactions or reversals as liquidity is taken from the market.
🔹 Which Liquidity Levels Are Used
The indicator tracks liquidity at the following areas:
Asia Session High/Low
London High/Low
NY AM High/Low
NY Lunch High/Low
NY PM High/Low
Previous Day High and Low
Previous Week High and Low
Previous Month High and Low
Daily Open
Weekly Open
Monthly Open
Swing Highs/Lows
🔹 How Liquidity Levels Are Used
All tracked levels across sessions, swing points, and higher timeframes serve as potential liquidity targets. When price trades above one of these highs, the indicator looks for short setups if other confluences align. When price trades below lows, the indicator looks for long setups if other confluences align.
LIQUIDITY SWEEPS:
The indicator automatically detects Buyside Liquidity and Sellside Liquidity sweeps using the liquidity levels mentioned in the previous section.
🔹What is a Liquidity Sweep?
Liquidity sweeps occur when price trades beyond a key high or low and activates resting buy-stop or sell-stop orders in that area. It’s how the market gathers the liquidity needed for larger participants to enter positions.
Traders often place stop-loss orders around obvious highs and lows, such as the previous day’s, week’s, or month’s levels. When price pushes through one of these areas, it triggers the stops placed there and generates a burst of volume. This can lead to quick movements in price as those orders are executed.
🔹Sellside Liquidity Sweep
These occur when price dips below a Sellside Liquidity (SSL) level, taking out the stop-loss orders placed by long traders below that low. When this happens, the indicator records the sweep and begins monitoring for potential long setups as the next step in the IFVG trading strategy. Long trades are only eligible after a SSL sweep.
🔹Buyside Liquidity Sweep
These occur when price dips above a Buyside Liquidity (BSL) level, taking out the stop-loss orders placed by short seller traders above that high. When this happens, the indicator records the sweep and begins monitoring for potential short setups as the next step in the trading strategy. Short trades are only eligible after a BSL sweep.
🔹How to Use Liquidity Sweeps
Liquidity sweeps are not direct trade signals. They are best used as context when forming a directional bias. A sweep shows that the market has removed liquidity from one side, which can hint at where the next move may develop.
For example:
When BSL is swept, it often signals that buy stops have been triggered and the market may be preparing to move lower. Traders may then begin looking for short opportunities.
When SSL is swept, it often signals that sell stops have been triggered and the market may be preparing to move higher. Traders may then begin looking for long opportunities.
V SHAPE RECOVERIES:
🔹 What Is a V Shape Recovery?
A V shape recovery is a sharp, immediate reversal that happens right after price sweeps BSL or SSL. It indicates that price quickly moved back in the opposite direction after trading through the level. This behavior signals a shift in momentum and is a required confirmation in the indicator for signal generation. The indicator will not look for long trades after a SSL sweep unless a V shape recovery occurs. It will not look for short trades after a BSL sweep unless a V shape recovery occurs. Without this behavior, the indicator assumes that price may still be delivering in the direction of the sweep, so no valid setups can form.
🔹 Why V Shape Recoveries Matter
V shape recoveries help confirm that the liquidity the sweep did not immediately continue in the same direction. They separate false breaks from true continuation. A sweep without recovery often means price may keep trending, so the indicator does not generate signals in those cases. A sweep with a V shape recovery confirms rejection and sets the foundation for valid Inversion Fair Value Gap formation. This makes the V shape recovery one of the most important sequence steps in the Inversion Fair Value Gap Model.
🔹 How the Indicator Detects V Shape Recoveries
V shape recoveries can be visually intuitive when looking at a chart, but they are difficult to define consistently programmatically. To ensure reliable and repeatable detection, the indicator uses a rules-based method that evaluates candle size, candle direction, and the strength of the move immediately following the liquidity sweep. This approach removes subjectivity and allows the indicator to confirm V shape behavior the same way every time.
The indicator does not plot any visual elements specifically for V shape recoveries. Instead, the presence of a V shape recovery is implied through the signals themselves. Every valid long or short signal that appears after a liquidity sweep requires a confirmed V shape recovery. This means that if a signal is generated following a sweep, a V shape recovery has occurred.
🔹 V Shape Recovery After a Sellside Sweep (SSL Sweep)
After price trades below a sellside liquidity level, long positions are liquidated. If buyers quickly step in and force price upward with strong momentum, this forms a V shape recovery. This signals that the sweep below the low was rejected and that buyers have reclaimed control. When this occurs, the indicator begins monitoring for long setups.
🔹 V Shape Recovery After a Buyside Sweep (BSL Sweep)
After price pushes above a buyside liquidity level, many short positions are stopped out. If sellers immediately step in and drive price back down with strong movement, this forms a V shape recovery. This behavior reflects a quick change in candle direction immediately following the sweep. When this occurs, the indicator begins monitoring for short setups.
🔹Failed V Shape Recoveries
These examples show failed V shape recoveries, where price did not reverse decisively after the BSL or SSL sweep. The lack of strong response from buyers or sellers indicates that momentum did not shift. Thus, the indicator will not detect valid long/short setups using these liquidity sweeps.
HIGHER-TIMEFRAME FAIR VALUE GAPS:
Higher-timeframe Fair Value Gaps (HTF FVGs) provide important context in the Inversion Fair Value Gap Model because they show where significant imbalance occurred on larger market structures. The indicator automatically detects HTF FVGs and uses them as part of the signal rating system.
🔹 What Is a Fair Value Gap?
A Fair Value Gap (FVG) is an area where the market’s perception of fair value suddenly changes. On your chart, it appears as a three-candle pattern: a large candle in the middle, with smaller candles on each side that don’t fully overlap it.
A bullish FVG forms when a bullish candle is between two smaller bullish/bearish candles, where the first and third candles’ wicks don’t overlap each other at all.
A bearish FVG forms when a bearish candle is between two smaller bullish/bearish candles, where the first and third candles’ wicks don’t overlap each other at all.
This creates an imbalance because price moved so quickly that one side of the auction did not trade.
Examples:
🔹 What Makes an FVG “Higher-Timeframe”?
In this indicator, HTF FVGs are Fair Value Gaps detected on timeframes higher than the chart’s current timeframe. For example, on a 5-minute chart, a 1-hour FVG would be considered a HTF FVG. The indicator automatically plots and checks whether price interacts with these HTF FVGs during a liquidity sweep and incorporates this into the signal rating (A, A+, A++).
🔹 How the Indicator Uses Higher-Timeframe FVGs
The indicator automatically scans up to three user-selected higher timeframes for valid bullish and bearish FVGs and tracks price’s behavior around them in the background. When any of these higher timeframes are enabled, their FVGs are used directly within the signal logic.
During a liquidity sweep, the indicator checks whether price taps into any enabled HTF FVG. A tap occurs when price trades inside the boundaries of a higher-timeframe FVG during or immediately after the sweep.
A bullish HTF FVG tap during a sellside sweep supports a long setup.
A bearish HTF FVG tap during a buyside sweep supports a short setup.
When an HTF FVG tap aligns with the direction of the setup, the signal’s rating is increased. This can increase a setup’s rating from A to A+ or from A+ to A++.
🔹 Higher-Timeframe FVG Customization
Users can select up to three higher timeframes for HTF FVG detection. When a higher timeframe is enabled, its FVGs are used in the model’s signal logic. Users can also choose whether to display these HTF FVGs visually on the chart, by enabling the ‘Plot HTF FVGs’ setting.
Each enabled HTF FVG can be customized with the following options:
Bullish and Bearish Colors: Users can set different fill colors for bullish and bearish HTF FVGs for each selected timeframe.
Midline: When enabled, a midline is drawn through the center of each HTF FVG. Users can customize the midline’s line style, choosing between solid, dashed, or dotted and also customize the midline’s color.
Labels: When enabled, each plotted HTF FVG displays a label that shows its originating timeframe (for example, 1H, 4H).
Plot HTF FVGs: When disabled, the HTF FVG zones are hidden from the chart while the logic remains active in the background for signals.
Show Nearest:
This setting controls how many HTF FVGs are displayed based on proximity to current price. Users can choose to show the nearest X bullish HTF FVGs and the nearest X bearish HTF FVGs. This filter is applied across all enabled higher timeframes and does not limit by timeframe individually.
🔹When are Higher Timeframe Fair Value Gaps mitigated?
A Higher Timeframe Fair Value Gap is considered mitigated when a candle from the chart’s timeframe closes above the gap for a bearish FVG or below the gap for a bullish FVG.
INVERSION FAIR VALUE GAPS:
Inversion Fair Value Gaps (IFVGs) are a core requirement of the Inversion Fair Value Gap Model. Every long and short signal generated by the indicator requires a valid IFVG, just like liquidity sweeps and V shape recoveries. Without a confirmed IFVG, the model will not produce a setup.
🔹 What Is an Inversion Fair Value Gap?
An Inversion Fair Value Gap is a Fair Value Gap that becomes invalidated by a candle close in the opposite direction. This “flip” confirms that the original imbalance failed and that the market has shifted.
A bullish IFVG forms when a bearish FVG is invalidated by a candle closing above it.
A bearish IFVG forms when a bullish FVG is invalidated by a candle closing below it.
In the indicator, IFVGs are not used as retracement areas. Signals are generated immediately when a valid IFVG forms, not after price returns to the gap. The IFVG itself is the confirmation event that finalizes a setup sequence after a liquidity sweep and V shape recovery.
🔹 How the Indicator Plots IFVGs
The indicator only plots IFVGs that are used in long or short setups. Not every possible IFVG is shown on the chart. Only the IFVG involved in a confirmed signal is displayed. Users can disable IFVG plots entirely if they prefer a minimal view. This hides the visual gaps but does not affect the signal logic.
🔹 Customization Options
Users can customize how IFVGs appear on the chart:
Color Settings: Choose separate fill colors for bullish IFVGs and bearish IFVGs.
Midline: Toggle an optional midline inside the IFVG and choose between a solid, dashed, or dotted line.
Midline Color: Adjust the color of the IFVG Midline.
MACROS:
Macros are short, predefined time windows, where price is more likely to seek liquidity or rebalance imbalances. These periods often create sharp movements or shifts in delivery, giving additional context to setups. In the Inversion Fair Value Gap Model, macros are used as a confluence factor. When a long or short signal forms during a macro time window, the setup’s rating can increase from A to A+ or from A+ to A++.
Macros are not required for a signal to form, but they increase the signal’s rating when the setup aligns with macro timing.
🔹 How the Indicator Uses Macros
The indicator allows users to enable up to five macros. Each macro has its own start and end time, which the user can customize. These time windows are used directly in the signal logic. If a valid IFVG setup forms while price is inside any of the enabled macro windows, the indicator increases the signal’s rating.
Users may visually disable macros on the chart without affecting signal logic. Disabling visuals hides the macro zones, labels, and lines, but the underlying macro logic continues to function in the background for signals.
The indicator’s default macros use the following time periods (in EST):
09:50 - 10:10
10:50 - 11:10
11:50 - 12:10
12:50 - 13:10
13:50 - 14:10
🔹 Macro Settings
Each macro displays a shaded zone representing the active time window. This zone can be toggled on or off. Users can customize:
The color of each macro zone
The opacity of each zone
Whether the zones display at all (‘Show Zones’)
These visuals help identify whether price is currently inside a macro window.
🔹 Macro Labels:
Users can enable macro labels, which place a text label showing the macro’s title and its time window. The label color is global (applies to all macros), and the label size can be adjusted. Individual macros cannot have unique label colors.
🔹 Macro Start/End Lines
For additional clarity, the indicator draws two vertical markers for each macro:
One at the start of the macro
One at the end of the macro
A horizontal macro line is then drawn between the highs of these two candles to highlight the full duration of the macro window. Users can customize:
The line styles (solid, dashed, dotted) of the Macro Line and Start/End Lines
BIAS:
Bias determines which direction the indicator is allowed to generate signals. A bullish bias means only long setups can be confirmed. A bearish bias means only short setups can be confirmed. The bias acts as the final directional filter after a liquidity sweep, V shape recovery, and IFVG have all been validated. Even if all model conditions are met, the indicator will only confirm the setup if the direction aligns with the active bias.
Users are able to manually set a bias or use an automatic bias filter, which is explained below.
🔹 Manual Bias
Users can manually choose the directional bias at any time and choose between Bullish, Bearish, or Both.
When set to Bullish, the indicator will only confirm long setups, regardless of market structure.
When set to Bearish, only short setups are allowed.
When set to Both, the indicator can confirm both long and short setups if all requirements are met.
🔹 Automatic Bias
Automatic bias is fully rules-based and determined by how the previous session interacted with major draw-on-liquidity (DOL) levels. These levels include 1-hour highs and lows, 4-hour highs and lows, previous session highs and lows (such as Asia or London), and the previous day’s high and low. The indicator evaluates whether the previous session consolidated, manipulated liquidity, or manipulated and reversed before closing. Based on this behavior, the indicator establishes a directional bias for the current session.
◇ Previous Session Consolidation:
If the previous session did not sweep any major liquidity levels and price remained inside its range, the session is classified as consolidation.
After the current session sweeps a key low, the bias becomes bullish.
After the current session sweeps a key high, the bias becomes bearish.
The bias is determined live based on which side the current session manipulates first.
◇ Previous Session Manipulation (No Reversal):
If the previous session swept a major high-timeframe level but did not reverse before the session closed, the model assigns a reversal-based bias at the start of the current session.
If the previous session swept a low, the current session bias is bullish.
If the previous session swept a high, the current session bias is bearish.
Here, bias is determined immediately because the previous session’s manipulation defines the directional framework for the current session.
◇ Previous Session Manipulation + Reversal:
If the previous session swept a DOL level and also reversed away from it within the same session, the model assigns a continuation-based bias at the start of the current session.
If the previous session swept a low and reversed upward, the bias for the current session is bullish.
If the previous session swept a high and reversed downward, the bias is bearish.
🔹 How the Indicator Uses Bias in Practice
After the indicator validates the liquidity sweep, V shape recovery, and IFVG, it checks the active bias before confirming a signal.
If bias is bullish, only long setups are allowed.
If bias is bearish, only short setups are allowed.
If bias is Both, setups of either direction may form.
The bias does not influence the detection of liquidity sweeps, V shape recoveries, or IFVGs. It only determines whether those validated components are allowed to produce a final signal. Automatic bias updates based on session behavior, while manual bias remains fixed until the user changes it.
SIGNALS:
Signals are the final output of the Inversion Fair Value Gap Model indicator. A signal is only generated when all model conditions are satisfied in a clear, rules-based sequence.
A signal consists of:
An Entry
A Stop-Loss (SL)
A Breakeven (BE) level
Two Take-Profit levels (TP1 and TP2)
These components are plotted immediately once the final requirement (the IFVG confirmation) is met and the directional filter (bias) allows the setup.
Signals can be rated A, A+, or A++, based on whether certain confluences were present during the setup’s formation.
🔹 What All Signals Have in Common
Each signal type (A, A+, A++) requires the same four mandatory conditions. If any of these four are missing, the indicator will not print a signal.
◇ Required Component #1 – Valid Directional Bias
The bias determines whether the indicator can confirm a long or short setup.
Bullish bias → only long setups allowed
Bearish bias → only short setups allowed
Both → long or short setups allowed
Automatic bias → bias determined by session-based liquidity logic explained above
◇ Required Component #2 – Liquidity Sweep
The indicator must detect one of the following:
Sellside Liquidity Sweep (SSL Sweep) for potential long setups
Buyside Liquidity Sweep (BSL Sweep) for potential short setups
◇ Required Component #3 – V Shape Recovery
After a liquidity sweep, the indicator evaluates whether price produced a valid V shape recovery.
◇ Required Component #4 – Inversion Fair Value Gap (IFVG)
An IFVG must form in the direction of the potential setup.
A bullish IFVG forms when a bearish FVG is invalidated by a candle closing above that gap
A bearish IFVG forms when a bullish FVG is invalidated by a candle closing below that gap
The IFVG must occur after the V Shape Recovery and Liquidity Sweep. The IFVG confirmation is the final structural requirement. Once it forms, the setup is considered structurally complete.
🔹 A Signals
An A-rated signal contains exactly the four required components:
Valid Bias
Liquidity Sweep
V Shape Recovery
IFVG
An A signals represent the foundational implementation of the IFVG Model.
🔹 A+ Signals
An A+ signal includes the full A-signal structure plus ONE of the following:
Higher-Timeframe FVG Tap
Multi-Liquidity Sweep
Inside a Macro Window
◇ Higher-Timeframe FVG Tap
During a liquidity sweep, the indicator checks whether price taps into any enabled HTF FVG. A tap occurs when price trades inside the boundaries of a higher-timeframe FVG during or immediately after the sweep.
A bullish HTF FVG tap during a sellside sweep supports a long setup.
A bearish HTF FVG tap during a buyside sweep supports a short setup.
◇ Multi-Liquidity Sweep
A Multi-Liquidity Sweep occurs when price sweeps two liquidity levels of the same type in the same directional push.
Sweeping two lows in one move: Multi-Sellside Liquidity Sweep (long setups).
Sweeping two highs in one move → Multi-Buyside Liquidity Sweep (short setups).
◇ Inside a Macro Window
The final IFVG confirmation must occur inside a macro time window defined by the user.
If exactly one of these additional confluences is present, the signal rating is A+.
🔹 A++ Signals (Two Additional Confluences)
An A++ signal contains the full A signal structure plus TWO of the three confluences listed above.
HTF FVG tap + Multi-Liquidity Sweep
HTF FVG tap + Inside a Macro Window
Multi-Liquidity Sweep + Inside a Macro Window
If two confluences are present, the rating becomes A++. If all three are present, the setup is still rated a A++ (there is no A+++).
🔹 Signal Plots
When a valid long/short setup is detected, a signal with its rating appears with the following:
Entry: At the close of the candle that inverted a FVG
Stop-Loss: At the nearest swing high for short setups or nearest swing low for long setups
Breakeven Level: At the nearest swing high for long setups or the nearest swing low for short setups
Take-Profit 1: At the second nearest swing high for long setups or the second nearest swing low for short setups.
Take-Profit 2: At the third nearest swing high for long setups or the third nearest swing low for short setups.
After a signal reaches either TP2 or SL, the levels for Entry, SL, BE, TP1, and TP2 are removed from the chart. If another signal appears before the prior signal reaches either TP2 or SL, the levels are also removed.
Users can hover over any signal label to view a short summary of the exact criteria that were met for that setup. This includes whether a HTF FVG tap occurred, whether a multi-liquidity sweep was detected, whether the setup formed inside a macro window, and which liquidity level was swept prior to the V shape recovery.
🔹 Long Setup – A Rating
A long A-rated setup forms when all four core requirements of the IFVG Model occur without any additional confluences. First, price must sweep a Sellside Liquidity level. Immediately after the sweep, price must form a valid V shape recovery. Once the recovery completes, a bullish IFVG must form by invalidating a bearish Fair Value Gap with a candle close above it.
For a confirmed long signal, the indicator marks:
Entry: At the candle close that invalidates the bearish FVG and creates the IFVG
Stop Loss: At the nearest swing low
Breakeven: Midpoint between entry and stop-loss
Take Profit 1: At the second nearest swing high
Take Profit 2: At the third nearest swing high
In this example, price sweeps a swing low, has a V Shape recovery, and forms a bullish IFVG:
🔹 Short Setup – A Rating
A short A-rated setup forms when all four core requirements of the IFVG Model occur without any additional confluences. Price must first sweep a Buyside Liquidity level. Immediately after the sweep, price must form a valid V shape recovery. Once the recovery completes, a bearish IFVG must form by invalidating a bullish Fair Value Gap with a candle close below it.
For a confirmed short signal, the indicator marks:
Entry: At the candle close that invalidates the bullish FVG and creates the IFVG
Stop Loss: At the nearest swing high
Breakeven: Midpoint between entry and stop-loss
Take Profit 1: At the second nearest swing low
Take Profit 2: At the third nearest swing low
In this example, price sweeps a swing high, has a V shape recovery, and forms a bearish IFVG:
🔹 Long Setup – A+ Rating
A long A+ setup forms when the four core requirements of the IFVG Model occur and exactly one additional confluence is present. Price must sweep a Sellside Liquidity level, form a valid V shape recovery, and create a bullish IFVG by invalidating a bearish FVG. One of the following must also occur: a bullish HTF FVG tap during the liquidity sweep, a multi-sellside liquidity sweep, or the IFVG confirmation forms inside a macro window.
For a confirmed long A+ signal, the indicator marks:
Entry: At the candle close that creates the bullish IFVG
Stop Loss: At the nearest swing low
Breakeven: Midpoint between entry and stop-loss
Take Profit 1: At the second nearest swing high
Take Profit 2: At the third nearest swing high
In this example, price sweeps the NY AM Session Low, taps a 30-minute HTF FVG during the sweep, has a V shape recovery, and forms a bullish IFVG:
🔹 Short Setup – A+ Rating
A short A+ setup forms when the four core requirements of the IFVG Model occur and exactly one additional confluence is present. Price must sweep a Buyside Liquidity level, form a valid V shape recovery, and create a bearish IFVG by invalidating a bullish FVG. One of the following must also occur: a bearish HTF FVG tap, a multi-buyside liquidity sweep, or the IFVG confirmation forms inside a macro window.
For a confirmed short A+ signal, the indicator marks:
Entry: At the candle close that creates the bearish IFVG
Stop Loss: At the nearest swing high
Breakeven: Midpoint between entry and stop-loss
Take Profit 1: At the second nearest swing low
Take Profit 2: At the third nearest swing low
In this example, price sweeps a swing high, has a V shape recovery, and forms a bearish IFVG inside of the 13:50-14:10 macro:
🔹 Long Setup – A++ Rating
A long A++ setup forms when the four core requirements of the IFVG Model occur and at least two additional confluences are present. Price must sweep a Sellside Liquidity level, form a valid V shape recovery, and create a bullish IFVG. The setup must also include any two or three of the following: a bullish HTF FVG tap, a multi-sellside liquidity sweep, or the IFVG confirmation forming inside a macro window.
For a confirmed long A++ signal, the indicator marks:
Entry: At the candle close that creates the bullish IFVG
Stop Loss: At the nearest swing low
Breakeven: Midpoint between entry and stop-loss
Take Profit 1: At the second nearest swing high
Take Profit 2: At the third nearest swing high
In this example, price sweeps two swing lows, has a V shape recovery, taps a bullish 30-minute HTF FVG during the liquidity sweep, and forms a bullish IFVG inside of the 10:50-11:10 macro:
🔹 Short Setup – A++ Rating
A short A++ setup forms when the four core requirements of the IFVG Model occur and at least two additional confluences are present. Price must sweep a Buyside Liquidity level, form a valid V shape recovery, and create a bearish IFVG. The setup must also include any two or three of the following: a bearish HTF FVG tap, a multi-buyside liquidity sweep, or the IFVG confirmation forming inside a macro window.
For a confirmed short A++ signal, the indicator marks:
Entry: At the candle close that creates the bearish IFVG
Stop Loss: At the nearest swing high
Breakeven: Midpoint between entry and stop-loss
Take Profit 1: At the second nearest swing low
Take Profit 2: At the third nearest swing low
In this example, price sweeps a swing high, has a V shape recovery, taps a bearish 30-minute HTF FVG during the liquidity sweep, and forms a bearish IFVG inside of the 09:50-10:10 macro:
🔹Signal Settings
◇ Liquidity Levels Used:
Users can select which type of liquidity levels the indicator uses for identifying liquidity sweeps:
Swing Points: Only uses Swing Highs/Lows
Session Highs/Lows: Only uses Session Highs/Lows
Both: Uses both Swing Highs/Lows and Session Highs/Lows
◇ Bias:
This setting determines which signal directions are allowed.
Manual Bias: Users can manually choose the directional bias, picking between Bullish, Bearish, or Both.
Automatic Bias: The indicator automatically determines a directional bias based on the criteria mentioned in the previous Bias section.
◇ IFVG Sensitivity:
This setting determines the minimum gap size required for an FVG to qualify as an Inversion FVG.
Higher values: only larger FVGs become IFVGs
Lower values: smaller gaps are allowed
◇ Use First Presented IFVG:
This setting determines whether the indicator limits signals to only the first IFVG created within the manipulation leg.
What Is the First Presented IFVG?
It is the earliest FVG formed inside the displacement that causes the liquidity sweep.
For a bearish manipulation leg (price moving downward into the sweep), the first presented IFVG is the first FVG created at the start of that downward move:
For a bullish manipulation leg (price moving upward into the sweep), the first presented IFVG is the first FVG created at the start of that upward move:
When this setting is enabled, the indicator will only confirm signals when the IFVG used is derived from this first presented FVG. IFVGs that form later in the manipulation leg are not used for signal generation.
◇ Only Take Trades:
This setting allows users to restrict signals to a defined time window.
If a complete setup occurs inside the time window, it is allowed and plotted
If it occurs outside the window, the signal will not appear
For example, if you only wanted to see long/short signals between 9:30 AM and 12:00 PM, you would enable this setting and set the time window from 09:30 - 12:00.
◇ Minimum R:R
This setting allows users to require a minimum risk-to-reward ratio before a signal is confirmed and plotted on the chart. The risk-to-reward ratio is calculated using the distance from the Entry to the Stop-Loss (risk) and the distance from the Entry to TP2 (reward). The indicator compares these distances and determines whether the setup meets or exceeds the minimum R:R value selected by the user.
If the calculated R:R is equal to or greater than the chosen threshold, the signal will be displayed.
If the calculated R:R is lower than the threshold, the signal will not appear on the chart.
🔹 Signal Rating Minimum
Users can restrict which signal ratings appear:
A: shows all signals
A+: shows only A+ and A++
A++: shows only A++ setups
🔹 Signal Styling and Customization
The indicator provides full control over how signal labels and levels appear on your chart. Users can customize long signals, short signals, all plotted lines, and the visibility of every individual element.
◇ Long Signal Styling
Users can customize:
Long Signal Label Color
Long Signal Text Color
Long Signal Label Size
◇ Short Signal Styling
Users can customize:
Short Signal Label Color
Short Signal Text Color
Short Signal Label Size
◇ Entry, Stop Loss, Breakeven, and Take Profit Lines
Each line type can be enabled or disabled individually:
Entry Line
Stop Loss Line
Breakeven Line
Take Profit 1 & 2 Lines
Users can also set custom colors for each line so every level is easy to track during live price movement.
◇ Show Price Labels
Price labels can be toggled on or off individually for each level. Users can choose whether to show or hide the price for:
Entry
Stop loss
Breakeven
Take Profit 1 & 2
NEW DAY OPENING GAP:
The New Day Opening Gap (NDOG) highlights the price difference between the previous day’s closing candle and the first candle of the new trading day. The indicator tracks this gap automatically each day and makes it available as optional context for users.
🔹 What Is the New Day Opening Gap?
A New Day Opening Gap forms when the trading day opens at a price different from the previous day’s final closing price.
If the new day opens above the prior day’s close → Bullish NDOG
If the new day opens below the prior day’s close → Bearish NDOG
This gap acts as a short-term draw on liquidity because the market may revisit the gap to rebalance price delivery. While the NDOG is not a required component for IFVG signals.
🔹 How the Indicator Uses the New Day Opening Gap
When enabled, the indicator plots the gap as a rectangular zone spanning from the previous day’s close to the new day’s open. The zone remains active until it is fully filled by price or until the next day’s opening gap forms. Once price trades through the entire gap, or once a new NDOG replaces it the following day, the zone becomes inactive and is removed from the chart. The indicator does not use the NDOG for signal generation. It is strictly a visual tool that helps traders identify areas where price may retrace or seek liquidity during the session.
🔹 Customization Options
Users have full control over how the New Day Opening Gap displays on the chart:
Show New Day Opening Gap: Toggle the NDOG zone on or off
Bullish NDOG Color: Customize the fill color for gaps formed above the prior close
Bearish NDOG Color: Customize the fill color for gaps formed below the prior close
NEW WEEK OPENING GAP:
The New Week Opening Gap (NWOG) highlights the price difference between the previous week’s final closing candle and the first candle of the new trading week. The indicator tracks this gap automatically each week and provides it as optional context for users.
🔹 What Is the New Week Opening Gap?
A New Week Opening Gap forms when the new trading week opens at a price different from the previous week’s closing price.
If the new week opens above the prior week’s close → Bullish NWOG
If the new week opens below the prior week’s close → Bearish NWOG
This gap often serves as a medium-term draw on liquidity because price may return to rebalance the weekly displacement. The NWOG is not a required component for IFVG signals.
🔹 How the Indicator Uses the New Week Opening Gap
When enabled, the indicator plots the gap as a rectangular zone spanning from the previous week’s close to the new week’s open. The zone remains active until it is fully filled by price or until the next week’s opening gap forms. Once price trades through the entire gap, or once a new NWOG replaces it the following week, the zone becomes inactive and is removed from the chart. The indicator does not use the NWOG for signal generation. It is purely a visual reference to help traders identify areas where price may rebalance or seek liquidity during the week.
🔹 Customization Options
Users have full control over how the New Week Opening Gap displays on the chart:
Show New Week Opening Gap: Toggle the NWOG zone on or off
Bullish NWOG Color: Set the fill color for gaps formed above the prior weekly close
Bearish NWOG Color: Set the fill color for gaps formed below the prior weekly close
SMT DIVERGENCES:
The indicator automatically marks SMT Divergences that occur between the current selected chart ticker and a second user-selected ticker.
A SMT Divergence forms when the prices of the currently selected chart ticker and the user-selected ticker don’t follow each other. For example, if the current chart’s ticker symbol is SEED_ALEXDRAYM_SHORTINTEREST2:NQ and the user-selected ticker is $ES. If SEED_ALEXDRAYM_SHORTINTEREST2:NQ does not sweep the low of the NY AM Session, but NYSE:ES sweeps that same exact session’s low during the same candle, then a SMT Divergence is detected.
In the images below, SEED_ALEXDRAYM_SHORTINTEREST2:NQ and NYSE:ES form a low at 12:20 AM on November 12th. At 12:35 AM, the 12:20 AM low is taken out on $NQ. However, on NYSE:ES , price failed to take out this exact low at 12:35 AM. Thus, an SMT Divergence is detected, and a line is drawn between the two lows on $NQ.
NYSE:ES Chart:
SEED_ALEXDRAYM_SHORTINTEREST2:NQ Chart:
🔹 SMT Divergence Settings
The indicator includes settings that allow users to control how SMT Divergences are detected and displayed.
◇ Length
Length controls how sensitive the pivot detection is when finding highs and lows for SMT.
Lower Length: confirms swings with fewer bars, so more swings qualify.
Higher Length: requires more bars to confirm a swing, so fewer swings qualify.
◇ Divergence Length
The Divergence Length setting defines how many bars apart the two swing points may be for them to count as part of the same SMT Divergence.
Higher Values: The two instruments can form their swing highs or lows farther apart in time. As long as both swings occur within this wider bar window, the indicator compares them for divergence.
Lower Values: The two swing points must occur very close to each other.
◇ Show Last
This setting limits how many recent SMT Divergences are displayed on the chart. For example, setting Show Last to 1 will only show the most recent SMT Divergence, while higher values allow more historical SMT Divergences to remain visible on the chart.
◇ Divergence Ticker
Users can change the ticker used for detections. Since SMT Divergences occur by comparing two tickers, the inputted ticker within the settings will always be compared to the current selected ticker on your chart.
DASHBOARD:
The dashboard provides a live summary of all major components of the Inversion Fair Value Gap Model. It updates every candle and displays the current state of each requirement used in the setup logic.
🔹 Real-Time Model Components
The state of each component is displayed with the following:
✔️ = condition is satisfied
❌ = condition is not satisfied
🐂 / 🐻 = current directional bias (bullish or bearish)
The dashboard actively tracks the following:
◇ Bias (🐂 Bullish, 🐻 Bearish, or Both)
Shows the current bias with a bull or bear emoji. If using automatic bias, the dashboard updates as soon as the session logic determines a direction.
◇ Liquidity Sweep
Displays ✔️ once a valid BSL Sweep (for shorts) or SSL Sweep (for longs) is detected.
Shows ❌ when no sweep is present.
◇ V Shape Recovery
Displays ✔️ when a confirmed V shape recovery forms after the sweep.
Shows ❌ until a valid V shape appears.
◇ Inversion Fair Value Gap (IFVG)
Shows ✔️ once a bullish or bearish IFVG forms in the correct direction.
Shows ❌ when no IFVG has yet confirmed.
◇ Higher-Timeframe FVG Interaction
Displays ✔️ when price is currently inside any enabled HTF FVG or taps a HTF FVG during a liquidity sweep.
Displays ❌ when price is not inside a HTF imbalance.
◇ Clear Opposite Draw on Liquidity (DOL)
Shows ✔️ when a clear opposite-side draw is present in the model logic.
Shows ❌ if no clear opposite draw is detected.
◇ SMT Divergence
Shows ✔️ for 20 candles immediately after an SMT Divergence forms.
After 20 candles, it returns to ❌ unless a new SMT Divergence is detected.
🔹 Signal Information Display
When a valid long or short signal appears, the dashboard expands to show the full details of the setup, including:
Signal Rating
Entry Price
Stop-Loss Price
Breakeven Price
Take Profit 1 Price
Take Profit 2 Price
🔹 Trade Statistics Module
Users can enable a built-in statistics panel to view historical performance of signals across all ratings. The trade stats include:
A Signal Win Rate
A+ Signal Win Rate
A++ Signal Win Rate
Long Signal Win Rate
Short Signal Win Rate
Total Number of Trades Used in the Calculations
A trade is counted as a win if price reaches breakeven before stop-loss. A trade is counted as a loss if price hits stop-loss before breakeven.
🔹 Dashboard Customization
The dashboard includes several options to control its appearance and position:
Show Dashboard: Toggle the entire dashboard on or off
Dashboard Size: Choose the size of the dashboard
Dashboard Position: Choose the location of the dashboard on the chart
Trade Stats Text Color: Customize the color of the 2nd column outputs under the Trade Stats section in the dashboard
◇ Component Toggles
Users can enable or disable the display of any model component based on preference. Each of these items can be shown or hidden independently:
Setup Rating
Entry
Stop-Loss
Breakeven
Take Profit 1
Take Profit 2
Bias
Liquidity Sweep
Higher-Timeframe FVG Interaction
V Shape Recovery
Inversion FVG
Clear Opposite Draw on Liquidity
Trade Stats
These toggles only affect visual display. Disabling any of them does not affect the underlying indicator’s logic.
ALERTS:
The Inversion Fair Value Gap Model includes full alert functionality using AnyAlert(), allowing users to receive notifications in real time for all major model components and signal events.
Users can enable or disable each alert type in the “Alerts” section of the settings. After selecting which alerts they want active, they can create a single TradingView alert using the AnyAlert() condition. This will automatically trigger alerts for all enabled events as soon as they occur on the chart.
Available Alerts:
Long Signal
Short Signal
Breakeven Hit (BE)
Take Profit 1 Hit (TP1)
Take Profit 2 Hit (TP2)
Stop-Loss Hit (SL)
Liquidity Sweep Detected
SMT Divergence Detected
How to Receive Alerts:
Open the TradingView alert creation window.
Select the IFVG Model indicator as the alert condition.
Choose AnyAlert() from the condition dropdown.
Create the alert.
IMPORTANT NOTES:
TradingView has limitations when running features on multiple timeframes such as the HTF FVGs, which can result in the following restriction:
Computation Error:
The computation of using MTF features is very intensive on TradingView. This can sometimes cause calculation timeouts. When this occurs, simply force the recalculation by modifying one indicator’s settings or by removing the indicator and adding it to your chart again.
UNIQUENESS:
This indicator is unique because it organizes every part of the Inversion Fair Value Gap Model into one structured, rules based system. It detects liquidity sweeps, confirms V shape recoveries, identifies valid IFVGs, checks higher timeframe FVG taps, reads macro timing, and applies a session based directional bias. All of these components are evaluated in a fixed sequence so users always know exactly why a signal appears. Every part of the logic is customizable, including which liquidity types are used, which IFVGs qualify for signals, which time windows allow trades, the minimum risk to reward for a setup, and all visual elements on the chart. The tool also includes optional SMT Divergence detection, daily and weekly opening gaps, a live dashboard that shows the state of each model requirement, and optional signal performance statistics.
Pivot-Punkte und Levels

Opening Prices by RiseOpening Prices by Rise - Multi-Timeframe Key Level Tracker
This comprehensive indicator identifies and displays critical opening price levels across multiple timeframes and customizable time-based intervals, providing traders with essential reference points for intraday and swing trading strategies.
The indicator systematically tracks opening prices from various market sessions and timeframe candles, creating persistent horizontal reference levels that extend forward on the chart. These levels represent institutional positioning points and psychological price zones where significant market reactions frequently occur.
Following level establishment, the indicator provides extensive visualization tools including customizable line styles, colors, widths, and optional vertical session markers. Advanced configuration options allow traders to display historical levels from previous trading days, implement custom time-based levels, and track higher timeframe candle opens—all within a single, streamlined interface.
This powerful solution delivers unmatched functionality for traders seeking to identify and monitor key opening price levels across multiple dimensions. Unlike basic session markers that display only current day levels, this indicator combines three distinct tracking systems—pre-configured key times, dynamic higher timeframe candle opens, and fully customizable time-based levels—into one cohesive tool. With its robust customization engine, historical multi-day tracking, and industry-leading custom level creation system, it provides capabilities that dramatically surpass conventional opening price indicators by offering complete control over every visual and functional aspect.
What are Opening Price Levels?
Opening prices represent the first traded price at the beginning of a specific time period. These levels are critical reference points because they often act as support or resistance zones throughout the trading session. The indicator tracks three primary categories:
Key Time-Based Opens
Pre-configured opening prices at strategically important times:
Daily Open -> The first price when the trading day begins
Midnight Open (00:00) -> Session start in 24-hour markets
New York Open (09:30) -> Major market session beginning
Higher Timeframe Candle Opens
Opening prices from larger timeframe candles that provide multi-timeframe context:
Monthly Open -> Beginning of each monthly candle
Weekly Open -> Start of each weekly period
4-Hour Open -> Intraday structural reference points
Each timeframe level can display multiple historical opens, allowing traders to see how price interacts with previous period opening levels.
Custom Time Levels
This indicator features a revolutionary custom level system that allows users to define unlimited time-based opening prices with complete control over styling and display options. Unlike other indicators with rigid preset times, this text-area based system provides unparalleled flexibility—simply add new levels using an intuitive comma-separated format. Each custom level has independent control over display type, line style, color, and width, making this the most versatile opening price tracking system available.
Historical Display
The indicator provides optional historical tracking, displaying opening price levels from previous trading days. This feature is invaluable for identifying recurring support/resistance zones and understanding how current price action relates to prior session opens. Most competing indicators only show current day levels, limiting their analytical value.
What Makes This Indicator Different?
Unified Multi-System Approach -> Combines time-based, candle-based, and custom levels in one indicator instead of requiring multiple tools
Advanced Historical Tracking -> Display previous days of opening levels, unlike competitors limited to current day only
Intelligent Timeframe Detection -> Automatically prevents display issues on incompatible chart timeframes for clean visualization
Industry-Leading Custom System -> Text-area based custom level creation with full parameter control per level—unmatched flexibility
Dual Display Options -> Every level can show horizontal price lines, vertical time markers, or both simultaneously
Complete Style Control -> Individual color, style, width, and text formatting for each level type
Multi-Timeframe Candle Tracking -> Display multiple previous opens from any timeframe (show last 1-5 occurrences)
Professional Label System -> Customizable text display with font, size, format, and alignment options
Smart Extension Logic -> Configurable forward extension with automatic endpoint detection
Dual Display Mode
Each opening level can be displayed as:
Horizontal price line showing the opening level
Vertical time marker indicating when the open occurred
Both simultaneously for complete context
Input Settings:
This tool offers extensive customizable options, which could be overwhelming to some users. Below you will find an in-depth definition of every input's purpose to complement the tooltips that can be found directly in the indicator's settings.
Historical 📜
Number of previous trading days to display opening levels for (0-50). Setting this to 25 or higher displays all available historical data. When set to 0, only the current day's levels are shown.
Offset 📏
Amount of bars to extend horizontal price lines past the current bar (0-50). This creates forward-looking reference levels that extend beyond the most recent price action.
Key Levels 🔑
Pre-configured opening times with individual controls for each level:
Daily -> Trading day open (typically midnight or session start)
00:00 -> Midnight open for 24-hour markets
09:30 -> New York market open
For each key level:
Checkbox -> Enable/disable this level
Type -> Display as "Open Price" (horizontal line), "Vertical Line" (time marker), or "Both"
Color -> Custom color selection
Style -> Line style (Solid, Dashed, or Dotted)
Width -> Line thickness (1-3)
Candle Levels 🕯️
Higher timeframe candle opening prices with enhanced controls:
Checkbox -> Enable/disable this timeframe
Name -> Custom label text for the level
Timeframe -> Select any timeframe (1M, 1W, 240, etc.)
Show Last -> Number of previous timeframe opens to display (1-5)
Type -> Display mode (Open Price, Vertical Line, or Both)
Color -> Custom color selection
Style -> Line style (Solid, Dashed, or Dotted)
Width -> Line thickness (1-3)
Text ✏️
Label configuration for all displayed levels:
Label -> Display "Time" (HH:mm format), "Name" (custom text), or "None"
Size -> Text size (Tiny, Small, Normal, Large, or Huge)
Font -> Font style (Default or Monospace)
Format -> Text formatting (Default, Bold, or Italic)
Align -> Vertical positioning (Top, Middle, or Bottom) and horizontal alignment (Left, Center, or Right)
Custom Levels ⚙️
Advanced custom level creation system using comma-separated parameters:
Format:
HHmmss,Label Text,Type,Style,Color,Width
Parameters:
Time -> HHmmss format (e.g., 060000 for 6:00 AM)
Text -> Custom label for this level
Type -> "Open Price", "Vertical Line", or "Both"
Style -> "Solid", "Dotted", or "Dashed"
Color -> "Red", "Green", "Blue", "Yellow", "Orange", "Purple", "Pink", "White", or "Black"
Width -> Line thickness (1-3)
Example:
060000, ,Open Price,Dotted,Blue,1
083000, ,Both,Solid,Green,2
140000, ,Vertical Line,Dashed,Orange,1
Each custom level must be on a separate line. The text area accepts multiple custom levels for maximum flexibility.
Use Cases:
Identify key support and resistance levels from session opens
Track institutional positioning zones across multiple timeframes
Establish reference points for range-bound trading strategies
Monitor previous day opens for gap trading opportunities
Create custom session markers for specific trading strategies
Analyze price reactions at higher timeframe opening levels
Build systematic entry and exit strategies around opening prices
This indicator is for educational and informational purposes only. Past performance and historical patterns do not guarantee future results. Trading involves substantial risk of loss and is not suitable for all investors. Always conduct your own analysis and consider your financial situation before making any trading decisions. The identification of patterns does not constitute trading advice.
For any additional questions and/or feedback related to this indicator, users can comment below!

Indicator setupDescription of the "Setup Indicator"
Setup Indicator is a multifunctional trading tool that combines the power of a modified ATR indicator for trend determination and a classic ZigZag for identifying key market structures. It is designed to automatically detect reversal patterns "LL to HH" (bullish) and "HH to LL" (bearish), project target levels based on Fibonacci retracements, and visualize trading zones.
🎯 Philosophy and Utility
The indicator is built on the concept that significant price movements begin with the breakout of the previous structure (a higher low in an uptrend or a lower high in a downtrend). It helps the trader to:
- Objectively identify reversal points: Automatically detects "Lower Low -> Higher High" (LL->HH) formations for long positions and "Higher High -> Lower Low" (HH->LL) for short positions.
- Determine entry zones: Visualizes a "box" between key Fibonacci levels (38.2% and 60.6%), which serves as a potential area for trade entry.
- Project targets: Calculates and displays three target levels (0.84, 1.306, 1.618 for long and 0.16, -0.306, -0.618 for short) based on the magnitude of the initial impulse.
- Manage risk: Clearly marks the "structure break" level, upon reaching which the initial trading idea is invalidated.
⚙️ Operating Principle and Logic
1. ATR Trend (Base):
- Builds dynamic support and resistance levels based on the Average True Range (ATR) multiplied by a specified coefficient.
- Trend direction is determined by the position of the closing price relative to these levels. This is the main filter for the entire indicator.
2. ZigZag (Structure):
- Leaves only significant extremes (peaks and troughs) on the chart, filtering out market noise. The ZigZag length determines sensitivity.
3. Signal Filtering (The Heart of the System):
- A signal is considered valid only if it is confirmed by the ATR trend.
- For Long (LL to HH): The lower low (LL) must be formed in a downtrend according to the ATR, and the subsequent higher high (HH) — in an uptrend.
- For Short (HH to LL): The higher high (HH) must be formed in an uptrend according to the ATR, and the subsequent lower low (LL) — in a downtrend.
- This dual verification significantly improves signal quality.
🛠️ Indicator Settings
1. "ATR Trend Settings" Group
- ATR Period: Period for calculating the ATR. Smaller values make the trend more sensitive.
- Source: Price source used for calculation (default is hl2 - the average of High and Low).
- ATR Multiplier: Coefficient for expanding/narrowing the ATR bands. The higher the value, the less frequently the trend changes.
- Change ATR Calculation Method: Switches the ATR calculation between the standard method (ta.atr) and the SMA method (ta.sma(ta.tr)).
- Show ATR Support/Resistance Lines: Shows/hides the ATR trend lines on the chart.
2. "ZigZag Settings" Group
- ZigZag Length: Defines the minimum distance between extremes. Increase the value to find larger and more significant structures.
- Show ZigZag: Shows the ZigZag line.
- Show Only Current Structure (in the "Display Settings" group): A key setting. When enabled, the indicator removes all previous structures and displays only the most recent one, preventing chart clutter.
3. Visualization Settings
- Show Boxes: Shows the trading zone (between 38.2% and 60.6%).
- Box Length: The width of the box and all accompanying lines in bars.
- Show Targets: Shows the target lines and labels.
- Show Structure Break: Shows the structure break level line and label.
- Show HH/LL Labels: Shows "HH" and "LL" labels on the corresponding extremes.
- Show Connection Lines: Draws a line connecting the HH and LL extremes.
📊 Signal Interpretation
Bullish Signal (Long Setup)
1. Formation: A structure appears: LL (Lower Low), followed by HH (Higher High).
2. Visualization:
- Green Zone (Box): The area between 38.2% and 60.6% of the move from LL to HH. Considered as an area for entering long positions.
- Structure Break Level: The price level of the LL. A stop-loss is typically placed below this level.
- Targets: Three lines calculated based on Fibonacci extensions (0.84, 1.306, 1.618). Serve as potential take-profit levels.
Bearish Signal (Short Setup)
1. Formation: A structure appears: HH (Higher High), followed by LL (Lower Low).
2. Visualization:
- Red Zone (Box): The area between 38.2% and 60.6% of the move from HH to LL. Considered as an area for entering short positions.
- Structure Break Level: The price level of the HH. A stop-loss is typically placed above this level.
- Targets: Three lines calculated based on Fibonacci extensions (0.16, -0.306, -0.618).
⚡ Alerts
The indicator has built-in conditions for creating alerts in TradingView:
"LONG Signal" - Triggers when a bullish LL->HH structure appears.
"SHORT Signal" - Triggers when a bearish HH->LL structure appears.
💎 Conclusion and Usage Tips
Setup Indicator is not just an indicator, but a complete system for finding and trading structural reversals.
- For conservative traders: Use larger values for ZigZag Length and ATR Multiplier to find only the most significant and confirmed market moves.
- For active traders: Adjust the parameters for lower timeframes to find more trade setups.
- Always use the "Structure Break" level for risk management. This is an integral part of the system.
- Combine signals with the overall market context and support/resistance levels to increase the probability of success.
Disclaimer: This tool is intended to assist in analysis and is not a direct trading recommendation. All trading decisions are made independently and at your own risk.

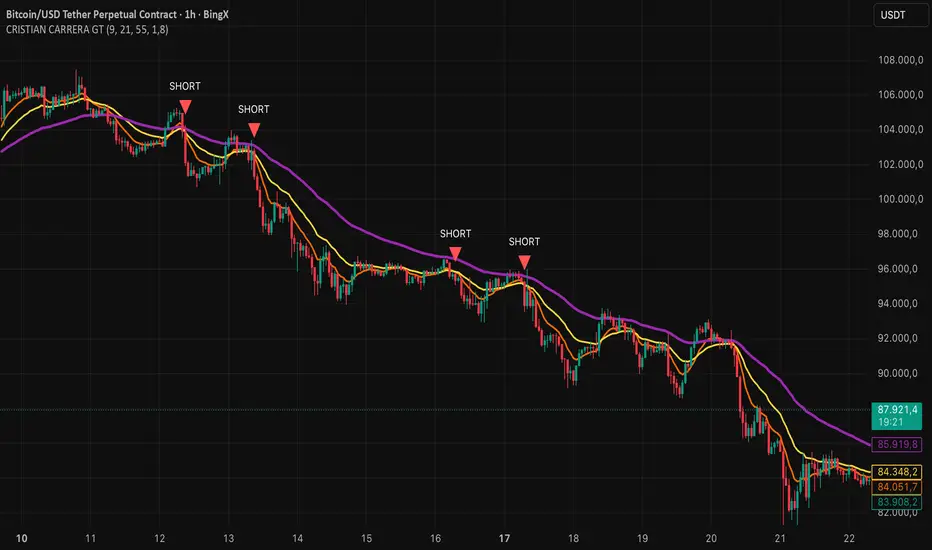
CRISTIAN CARRERA GTEMAs, Pivots, and Price Action are used.
This indicator was developed from the analysis of EMAs. We use EMAs of different periods to validate price action.
Pivots are important for detecting where the market breaks out, especially when it is trading within ranges or at strong support and resistance levels.
Price action with volume inflows or outflows gives us a better idea of where the market is headed.
deKoder | HTF3 - Multi-Timeframe Candle DisplaydeKoder | HTF3 - Multi-Timeframe Candle Display
Overview
HTF3 is a powerful multi-timeframe analysis tool that displays higher timeframe candles directly on your current lower timeframe chart. When trading lower timeframes it is sometimes easy to lose sight of the higher timeframe context. HTF3 enables better trading decisions by keeping your analysis aligned with the dominant trend.
Key Features
• Multi-Timeframe Support : Display daily, weekly, or any custom higher timeframe candles
• Visual Candle Representation : Clear OHLC candles with customizable colors
• Range Display : Show previous candle ranges with dotted center lines
• Trading Signals : Automatic breakout and rejection signals with arrow markers
• Flexible Positioning : Adjustable horizontal offset for optimal placement
• Real-time Updates : Current higher timeframe candle builds in real-time
Use Cases
• Swing Traders : Maintain daily/weekly context on intraday charts
• Position Traders : Align entries with higher timeframe structure
• Breakout Traders : Identify key levels from previous candle ranges
• Market Analysis : Quickly assess multi-timeframe alignment
Configuration
• Timeframe : Select higher timeframe to display (default: D)
• X-Offset : Adjust horizontal positioning (-4 to 50)
• Show Candles : Toggle candle display
• Show Range : Toggle previous candle high/low ranges
• Signals : Display breakout/rejection signals
• Customize bull/bear colors and text appearance
How to Use
1. Select your desired higher timeframe in the settings
2. Adjust offset for optimal positioning
3. Use the range lines to identify potential liquidity zones
4. Watch for signal arrows indicating breakouts/rejections
5. Combine with your existing strategy for confirmation
Pro Tips
• Use daily candles on 1H/4H charts for swing trading context
• The signals are not intended as standalone buy/sell triggers. They should only be used as confluence for your main trade idea

Master Level by ArthavidhiThis indicator creates support and resistance price base of fix price movement.

Price Action - Reversal BarInspired by Al Brooks' "Trading Price Action Reversals," this indicator detects potential bull and bear reversal bars. Bull reversals require a green bar with close above mid-range, small upper tail (≤30%), large lower tail (≥30%), and low below previous low without significant overlap. Bear reversals are the opposite. Triangles mark these setups for early reversal signals in trends or climaxes. Remember, markets test extremes—use with trend lines for confirmation, as single bars are often traps without a second leg.

Altseason IndexDescription of the "Altseason Index" Indicator
The Altseason Index is a powerful and visually minimalist tool designed to objectively identify the onset and conclusion of an "altseason" in the cryptocurrency market. Moving beyond subjective speculation, this indicator employs a clear, mathematical methodology by comparing the performance of a broad basket of altcoins against Bitcoin.
🎯 Core Concept and Utility
An "Altseason" is a market period where altcoins (cryptocurrencies other than Bitcoin) consistently yield higher returns than BTC. This indicator empowers traders and investors to:
Objectively Identify Market Cycles: Precisely pinpoint when capital is actively rotating from Bitcoin into altcoins and vice versa.
Make Data-Driven Decisions: Adjust their strategy in a timely manner: increasing exposure to altcoins during an altseason or rotating back into BTC upon its conclusion.
Avoid Emotional Pitfalls: Steer clear of FOMO (Fear Of Missing Out) and base decisions on hard data rather than market noise.
⚙️ How the Calculation Works
1. Asset Selection: The indicator tracks the performance of 15 leading altcoins across various market segments (Layer 1s, DeFi, Meme, Payments), ensuring a representative sample.
2. Performance Comparison: For each altcoin, the percentage price change over the user-defined lookback period (default: 90 days) is calculated. This performance is then compared to BTC's performance over the same period.
3. Counting the "Outperformers": The index counts the number of altcoins that have "outperformed" BTC.
4. Calculating the Index: The Altseason Index value is the percentage of altcoins in the basket that are outperforming BTC. For example, a value of 60% means that 9 out of the 15 coins performed better than Bitcoin.
🛠️ Indicator Settings
The settings are kept simple and intuitive, allowing you to customize the indicator to your strategy:
Lookback Period (days) (Default: 90):
- Defines the time horizon for the performance calculation.
- Shorter Periods (30-60 days) react faster to new trends but may produce more false signals.
- Longer Periods (90-180 days) provide smoother and more reliable signals, capturing sustained macro-trends.
Altseason Threshold (%) (Default: 75%):
- This is the key parameter that defines what index value constitutes an official "altseason."
- A threshold of 75% means an altseason is declared when at least 11 out of the 15 altcoins (75%) are outperforming BTC.
- You can increase the threshold (e.g., to 85%) for more conservative and stronger signals, or decrease it (e.g., to 65%) for earlier entries.
📊 Interpreting the Readings and Signals
The indicator uses a clear color-coding system and levels for easy interpretation:
🔴 < 30%: "BTC SEASON"
Bitcoin is dominating. The market is in risk-off mode or a state of anticipation. Growth is concentrated in BTC.
⚪ 30% - 49%: "NEUTRAL"
A transitional phase. The market is uncertain. Some alts show strength, but there is no unified trend.
🔵 50% - 74%: "BULLISH"
Growing strength in altcoins. Capital is beginning to rotate actively. This can be an early stage of an altseason.
🟢 ≥ 75% (or your custom threshold): "ALTSEASON"
The active altseason phase. The vast majority of altcoins are rising faster than BTC. This is the period of maximum potential returns for alts.
Signal Markers:
Green Dot: Signals the potential start of an altseason (the index crosses above the threshold).
Red Dot: Signals the potential end of an altseason (the index crosses below the threshold).
ℹ️ Information Panel
The chart displays two clean information panels:
1. Main Info Label:
Current index value (e.g., ⟠ 80%).
Market status (ALTSEASON, BULLISH, etc.).
The ratio of outperforming altcoins (11/15 alts).
2. Dominance & Market Cap Panel:
Alts: Altcoin Dominance (the market cap share of all coins except BTC).
BTC: Bitcoin Dominance.
Market: Total cryptocurrency market capitalization in billions of USD. This helps assess the overall market context (bullish/bearish).
💎 Conclusion
The Altseason Index is your strategic companion for navigating the crypto markets. It transforms the complex task of identifying market cycles into a simple and visual process. Use it to confirm broad market trends, identify potential entry and exit points, and, most importantly, to maintain discipline in your trading strategy by filtering out noise and emotion.
Disclaimer: This indicator is a tool for analysis and does not constitute investment advice. All trading decisions are taken at your own risk.

EP CPR Future CPR + 4 MA
1. CPR Trend Direction(Bias):
Bullish: If the current day's price is trading above the TC, it suggests a strong bullish trend where the CPR acts as a support zone.
Bearish: If the current day's price is trading below the BC, it suggests a strong bearish trend where the CPR acts as a resistance zone.
Range-Bound/Consolidation: If the price is trading within the CPR lines, it indicates a lack of clear directional bias and suggests a likely sideways or accumulation phase.
2. Moving average Trend Identification
Uptrend: If the price is above a moving average (and the MA line is sloping up), it confirms a bullish trend.
Downtrend: If the price is below a moving average (and the MA line is sloping down), it confirms a bearish trend.
Crossovers (Trading Signals)
A popular strategy involves using two moving averages—a short-term MA (e.g., 50-period) and a long-term MA (e.g., 200-period).
Golden Cross (Bullish Signal): Occurs when the shorter-term MA crosses above the longer-term MA.
Death Cross (Bearish Signal): Occurs when the shorter-term MA crosses below the longer-term MA.

Strict Weekly 50/200 WMA Signals True Weekly Only-Strict Weekly 50/200 WMA Signals True Weekly Only => also on other time frames than weekly (like daily, etc.) always indicates the indicators based on the weekly chart
-especially useful for Crypto
-gives buy and sell signals when the 200 WMA or the 50 WMA are crossed
-typically above the 50 WMA indicates a bull market
-reaching below the 200 WMA indicates a bear market and typically for investors with a longer time frame (>2-4 years) a good entry point

S1XP4C Bear Klr 2.1.1BTC|USD 8d
Double EMA and SMA lines with a subtle offset to show bearish and bullish changes on an 8 day chart and a WMA to show extreme lows.

Volume Matrix Pro [ChartNation]Volume Matrix Pro is a comprehensive volume profile indicator that combines delta-colored volume distribution analysis with adaptive pivot detection and automated volume node identification. The indicator visualizes where institutional volume accumulated at specific price levels, providing traders with precise entry zones backed by actual trading data.
KEY FEATURES:
Delta-Colored Volume Profile: Displays volume distribution across price bins with automatic delta coloring - green bins show buyer dominance, red bins show seller control at each price level
High Volume Nodes (HVN) Detection: Automatically identifies and marks price levels with ≥80% of POC volume using yellow diamond markers - these act as magnetic support/resistance zones where institutions built positions
Low Volume Nodes (LVN) Detection: Marks thin volume areas with gray diamond markers - zones where price moves quickly with minimal friction, ideal for breakout targets
Adaptive Smart Pivots: ATR-based pivot detection that automatically adjusts length based on market volatility - catches more swings in low volatility, filters to major reversals in high volatility
Point of Control (POC) Line: Identifies the price level with maximum traded volume - the market's center of gravity. Line colors by delta: green when buyers dominated, red when sellers controlled the level
Value Area Lines: Dotted lines marking the 70% value area (configurable 50-98%) with delta-based coloring showing cumulative buyer/seller pressure within the range
Circle Pivot Markers: Clean visual markers at confirmed pivot points with translucent horizontal lines extending to current bar
Extend-Until-Touch: Pivot lines automatically retract when price touches them, keeping charts clean and showing active levels only
Dual Profile Modes: Left-side profile (default) or right-pinned bars ahead of price with fully customizable width and padding
Volume-Filtered Pivots: Only displays pivots with significant volume backing (≥20% of POC by default) - institutional turning points, not noise
HOW IT WORKS:
The indicator divides the lookback range (default 200 bars) into volume bins (default 50) and calculates total volume and delta (buying vs selling pressure) at each price level. Each bin is colored green if buyers dominated (close > open majority) or red if sellers controlled (close < open majority).
High Volume Nodes mark price levels where the most trading occurred - these become magnetic support/resistance zones. The Point of Control identifies the single price with maximum volume, acting as the market's gravitational center.
Smart Pivots use ATR to adapt to changing volatility, then filter against the volume profile. Only pivots with substantial volume backing are displayed, ensuring you see institutional turning points, not random noise.
RECOMMENDED SETTINGS:
Scalping (1-5 min): 100 lookback bars, 40 bins, 5-7 pivot length
Day Trading (15 min - 1 hour): 200 lookback bars, 50 bins, 10 pivot length (default)
Swing Trading (4 hour - Daily): 300-500 lookback bars, 60 bins, 15-20 pivot length
USAGE TIPS:
Enter long when price touches green HVN zones with adaptive pivot confirmation
Enter short when price reaches red HVN zones with pivot confirmation
Use POC as first target when entering below it, or as support backup when entering above
Watch for LVN zones as potential breakout acceleration areas
Combine green delta bins + HVN + pivot for highest-probability setups
WHAT MAKES THIS DIFFERENT:
Unlike traditional volume profiles, Volume Matrix Pro colors each bin individually by delta, giving granular insight into buyer/seller control at every price level. The adaptive pivot system adjusts automatically to volatility, while volume-filtering ensures only institutionally-backed turning points are displayed. High/Low Volume Node detection is fully automated with visual markers.
IMPORTANT NOTES:
This is a volume analysis tool - use with trend analysis and risk management
High Volume Nodes show where volume accumulated historically, not future support/resistance guarantees
Adaptive pivots adjust to volatility automatically but can still produce false signals in choppy markets
Best used as confirmation alongside price action, not as a standalone system
Profile recalculates on each bar to reflect current lookback range

Universal Pivot ScannerUniversal Pivot Scanner
Professional pivot pattern detection for any market data source.
A robust pivot detector designed to work across all timeframes and data types - price action, technical indicators, volume, or custom studies. One tool, multiple applications.
Core Functionality
Identifies two high-probability retracement patterns:
HH+HL → Bullish continuation setup (higher high followed by higher low)
LL+LH → Bearish continuation setup (lower low followed by lower high)
Key Features
Non-repainting detection. Labels and alerts trigger at pivot confirmation, ensuring real-time actionable signals without historical bias.
Source flexibility. Compatible with any input - price data, oscillators (RSI, MACD), volume analysis, or proprietary indicators. Single implementation across multiple strategies.
Adaptive configuration. Adjustable lookback period optimizes performance for different market conditions and data types.
Recommended Settings
Lookback: 1 → Oscillators and momentum indicators
Lookback: 3-10 → Price action and ranging markets
Includes visualization table displaying recent pivot sequence and active pattern status.
Designed for systematic traders requiring consistent, verifiable signals across diverse market conditions.

smart honey 2.0The smart honey 2.0 is a long-only trading strategy based on averaging entries.
At "Entry" you can set to enter a trade at a specified averaging level. The best backtest result at "only 4th averaging".
"Tp" is take profit.
"Sensitivity" controls the frequency of trades - lower sensitivity means fewer, but higher-quality trades.
Settings recommendations
For 1m-5m timeframes, use low sensitivity and take profit values. For higher timeframes, increase the take profit value.
For example, a profitable setting for many coins on a 5-minute timeframe is
Tp = 1.5%
Sensitivity = 2.7
Entry = only 4th averaging
The strategy features a "Blue line" showing liquidity clusters influenced by Sensitivity. Price often bounces off this line.
You can also set alerts for lists of coins, receiving notifications at each new candle about active positions
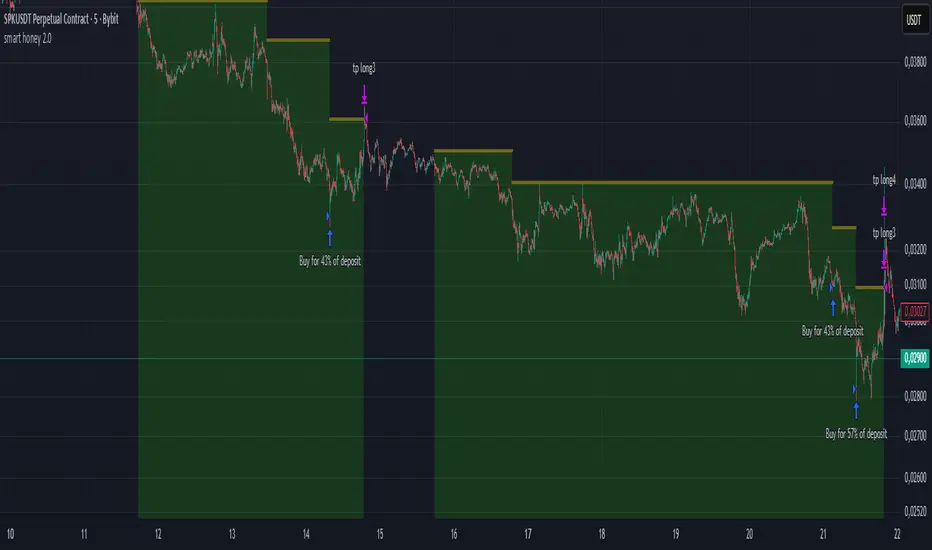
1H & 15M Swing Liquidity BSL / SSL (Projected to Lower TFs)I created this script to plot 1H intermediate and 15m short term liquidity on the lower timeframe charts. Works best when used with high timeframe keylevels as a catalyst to move price to these liquidity zones.

Leverage LineLeverage Line is an indicator represented by a simple line. This line corresponds to the average of three other values:
- The current price of the listed asset
- The average price calculated since the asset's listing based on TradingView data
- The equilibrium price between supply and demand
This indicator can be used on all assets. Regarding timeframes, they can be used on all of them, although the line's movements and position will not change in any case. However, if you want a broader view, you absolutely can. But for the best views, for bounces or breakout confirmations, I highly recommend the weekly timeframe, and occasionally the daily one as well, but the weekly one is truly the best.
I hope this indicator will allow you to better visualize where the price is supposed to be, and that you will adapt it to your trading or even create your own strategies with it.
Glebesqu,
Sincerely.

Yesterday's OHLC → O | H | L | C WITH LabelsORIGNAL INDICATOR Yesterday's open, high, low and close BY EduardoMattje AND FULL CREDIT TO HIM
I have only modified with 2 changes
1.Now yesterdays levels are visible from very first candle of any small time frame
2/Labels are also visible of OHLC so it removes confusion for trders
What it does:
Plots yesterday’s Open, High, Low, and Close as horizontal lines on any timeframe (1min, 5min, hourly, daily, etc.).
Lines automatically extend to the right edge of the chart (until the current day ends).
Shows permanent labels on the far right with short prefixes:
O = Yesterday’s Open
H = Yesterday’s High
L = Yesterday’s Low
C = Yesterday’s Close
Key features:
Works perfectly in regular and extended (pre/post-market) sessions
Option to hide the levels on previous days (keeps chart clean)
Very lightweight and fast
No compilation errors
Perfect for day traders who want yesterday’s key levels always visible with clear O/H/L/C labels on the right side of the screen. Just add it once and forget – it updates automatically every day

Mancini Levels (with alerts, majors only option)This indicator displays Support and Resistance levels on ES or MES (E-mini and Micro E-mini S&P 500 Index Futures) charts by parsing text copied and pasted by the user.
(The levels displayed on the chart above are not valid, they are for illustration only)
Features
Option to display only the major levels
The chart on the left displays both major and minor levels, distinguished by color and line style. The chart on the right shows only the major levels; minor levels are disabled:
Alert function for when the price approaches a major level or zone (within a customizable distance).
The script provides a trigger for alerts. When creating an alert, you can then choose your desired frequency (Only once/Once per bar/Once per bar close/Once per minute) from the TradingView alert pop-up.
The alert message contains the current price and the approached major level price.
Customizable Lookback Period
Set how many days into the past the lines should appear (Subject to a maximum of 5000 bars).
To display lines for the current day only, set this value to 1.
Functions only on ES or MES (E-mini and Micro E-mini S&P 500 Index Futures) charts, as the text format is intended for these instruments.
How to Use
Copy and paste the support and resistance levels into the indicator's "Supports" and "Resistances" input fields.
Format Example:
For the "Supports" input: 6772-6770 (major), 6764 (major), 6757, 6751-54
For the "Resistances" input: 6799 (major), 6814, 6828-30, 6839-40 (major)
The indicator supports the display of zone levels in multiple formats
(e.g., 6235-45 and 6235-6245 and 6245-6235 are all valid).
For hundred- or thousand-point rollovers, please use only the full number format: 5995-6005.
The indicator includes an error-checking system to help you troubleshoot common setup issues.
An on-chart error label will be displayed on the chart if:
The chart instrument is not ES or MES.
The "Supports" and "Resistances" fields are both empty.
A data formatting error is detected (e.g., non-numeric characters, incomplete zones, etc.).
How It Works
For optimal resource efficiency and performance, the script executes all computationally intensive tasks only once, on the very first bar when the chart loads (if barstate.isfirst).
One-time Parsing: The parsing, splitting, and conversion of the text (string) formatted levels, which are provided in the settings, occurs only once.
Persistent Objects: The lines (line.new), fills (linefill.new), and price labels (label.new) that mark the levels are all persistent graphical objects. The script creates these on the first bar and stores their references in arrays declared with the var keyword.
No Redrawing: On subsequent bars, the indicator does not delete and redraw these objects. It merely updates the x-axis position of the existing lines and labels (line.set_x1, line.set_x2, label.set_x) on the last bar (if barstate.islast), ensuring they always remain on the right edge of the chart, following the formation of new bars.
By default, TradingView charts have a limit of 50 lines and 50 labels. Given that the number of levels often exceeds this, the script's drawing logic is as follows:
The number of displayable lines and labels has been increased (to 500) in the indicator's declaration line.
The script applies a prioritized order when drawing levels and labels. Major levels have priority over minor levels during drawing.
Disclaimer
This indicator is provided for educational and informational purposes only. It is not financial advice.
Trading involves substantial risk of loss and is not suitable for every investor. Past performance shown in examples is not indicative of future results.
The indicator provides signals and calculations, but trading decisions are solely your responsibility. Always:
Test strategies on paper before using real money
Never risk more than you can afford to lose
Understand that all trading involves risk
Consider seeking advice from a licensed financial advisor
The publisher makes no guarantees regarding accuracy, profitability, or performance. Use at your own risk.
Flex Multi-MA ScannerMoving Average Support Scanner
Tired of guessing whether price will hold at key moving averages? This indicator analyzes your selected MAs and tells you which one is closest to price and whether it's likely to hold as support.
How It Works:
Select up to 10 moving averages (SMA/EMA) and the system automatically identifies the most relevant one. You'll get clear, color-coded signals:
🟢 Green (Strong Buy) - High probability the MA will hold
🟡 Yellow (Accumulation) - Good probability to start building positions
🟠 Orange (Weak/Watch) - Low probability, watch carefully
🔴 Red (Avoid) - Stay away, MA unlikely to hold
My Trading Approach:
I keep it simple - I only use moving averages, this indicator, and another one I'll release for public testing soon. I trade exclusively on the daily timeframe for swing trading – I don't do day trading because I prefer to open a trade and wait for results rather than staying at the computer all day.
About the Algorithm:
This indicator was developed by me based on my trading experience and after extensive testing and backtesting. It reflects what actually works in real market conditions.
Simple Setup:
Choose up to 10 moving averages to track
Set your % thresholds above and below for detection
That's it!
Limited-Time Offer:
FREE access until end of year! After that, a small monthly subscription applies.
📩 Private message me to get your free access today!
111 Robin Levels [StoneFace - Testing]111 Robin Levels
Overview The 111 Robin Levels indicator is a precision trading tool designed to plot dynamic Fibonacci extension and retracement levels based on key trading session ranges. It automatically detects specific time windows (Asia, London, and key hourly candles) and projects significant reaction levels used in the "Robin" trading methodology.
Key Features
Multi-Session Support: Easily toggle between key trading windows:
Asia Session (20:00 - 00:00 NY)
London Session (02:30 - 04:00 NY)
3 AM Candle (03:00 - 04:00 NY)
6 AM Candle (06:00 - 07:00 NY)
9 AM Candle (09:00 - 10:00 NY)
Dynamic Fibonacci Levels:
1.111 Extensions: Automatically plots the +/- 1.111 expansion levels from the session range, often used to identify stop hunts or reversals.
Highlights the 0.37 and 0.55 levels with a customizable shaded background for clear visualization of internal reaction zones.
Mirrored Sets: Capable of generating multiple sets of extensions (e.g., 2.111, 3.111) based on user configuration for trending markets.
Smart Visualization:
Dynamic Extension: Lines for the current day extend dynamically (Current Bar + 3) for real-time visibility but cap at 17:00 NY to prevent chart clutter.
Historical Accuracy: Past session lines remain fixed at the 17:00 NY daily close.
Full Customization: Control line styles (Solid, Dotted, Dashed), widths, colors, and fill transparency to match your charting theme.
How It Works
Once a selected session completes, the indicator calculates the High and Low of that specific time period. It immediately projects the 1.111 expansion levels and the internal 0.37/0.55 zones. Users can adjust the "Set Visible Ranges" setting to project further expansions (Sets 2, 3, 4, etc.) for days with high volatility.
Settings
Session to Display: Select the specific session or candle time you wish to analyze.
Set Visible Ranges: Define how many upper and lower extension sets are displayed.
Style: Customize colors for the 1.111 levels and the 37/55 zones, adjust fill transparency, and select your preferred line style.

HybridWhales DAY TRADINGThis indicator offers a streamlined view of prevailing market trends on lower timeframes, empowering day traders to execute their strategies with greater precision
It incorporates two widely used exponential moving averages (EMAs)—the 50-period and 200-period—alongside an 800-period EMA, which effectively mirrors the 200-period EMA on the next higher timeframe. This setup provides enhanced flexibility, delivering multi-timeframe insights without the need to switch charts manually.
In addition, the indicator highlights essential intraday levels for quick reference:
Daily Open, denoted in yellow
Monday Highs, marked in red
Monday Lows, indicated in green
The indicator's core strength lies in its ability to detect market maker activity through color-coded candlesticks, based on volume analysis. Candles exhibiting significantly higher volume than the average of the prior eight candles are colored green (for bullish closes) or red (for bearish closes), signaling active market maker positioning—either entering shorts or longs.
Candles with moderately elevated volume (above average but not extreme) are shaded blue (bullish) or pink (bearish), suggesting market makers are accumulating short or long positions.
Interpretation is key: Red or pink candles (bearish) imply that market makers have initiated long positions, with price likely to revisit and fill these areas in the future. Conversely, green or blue candles (bullish) indicate market makers establishing shorts, anticipating a eventual pullback to these levels
To pinpoint the precise zones where price may return, the indicator places a white marker on each colored candle at its 50% retracement level, representing a fair value gap or imbalance.
Overall, this tool enables traders to spot market maker footprints, identify critical support and resistance zones, gauge weekly ranges, and assess potential momentum. While it fosters stronger confluence in analysis, results are not guaranteed and depend on individual trading execution.

Huli-Huli (Reversal) WindowHuli-Huli (Reversal) Time-Zone Highlighter
Huli (Hawaiian for "turn/flip") highlights specific time regions on your chart where price reversals and pivots are statistically more common during major trading sessions (Asian, London, NY).
This indicator identifies potential turning points based on historical session transitions and market behavior patterns. It does NOT predict or guarantee reversals - it simply marks time zones where pivots frequently occur.
When combined with key support/resistance levels, supply/demand zones, or other confluence factors, these highlighted periods may provide additional context for timing entries and exits.
Use this indicator as one piece of your trading puzzle, not as a standalone signal. Always combine with proper risk management and other technical analysis tools.
Note: Past performance and statistical tendencies do not guarantee future results. Trade responsibly.
***UTC Time should match EST - So depending on Daylight Savings or not you will want to select UTC 4 or UTC 5***